

Summary
Tobacco control policies are examined utilizing a simulation model for California, the state with the longest running comprehensive program. We assess the impact of the California Tobacco Control Program (CTCP) and surrounding price changes on smoking prevalence and smoking-attributable deaths. Modeling begins in 1988 and progresses chronologically to 2004, and considers four types of policies (taxes, mass media, clean air laws, and youth access policies) independently and as a package.
The model is validated against existing smoking prevalence estimates. The difference in trends between predicted smoking rates from the model and other commonly used estimates of smoking prevalence for the overall period were generally small. The model also predicted some important changes in trend, which occurred with changes in policy.
The California SimSmoke model estimates that tobacco control policies reduced smoking rates in California by an additional 25% relative to the level that they would have been if policies were kept at their 1988 level. By 2004, the model attributes over 60% of the reduction to price increases, over 25% of the overall effect to media policies, 10% to clean air laws, and only a small percent to youth access policies. The model estimates that over 5,000 lives will be saved in the year 2010 alone as a result of the CTCP and industry-initiated price increases, and that over 50,000 lives were saved over the period 1988-2010.
Tobacco control policies implemented as comprehensive tobacco control strategies have significantly impacted smoking rates. Further tax increases should lead to additional lives saved, and additional policies may result in further impacts on smoking rates, and consequently on smoking-attributable health outcomes in the population.
Keywords: Smoking, simulation models, tobacco control policy, California
INTRODUCTION
Smoking is the single most preventable cause of premature mortality, increasing the risk of lung cancer, emphysema, heart disease, stroke and other diseases (U.S. DHHS 1989; U.S. DHHS 1990). Approximately 440,000 deaths are attributable to smoking each year in the US, which results in 5.5 million years of potential life lost, $75 billion in direct medical costs, and $22 billion in lost productivity (CDC 2002, Armour et al. 2005). In 2000, approximately 8.6 million people in the US had an estimated 12.7 million smoking-attributable serious chronic illnesses (CDC 2003).
Substantial evidence indicates that higher cigarette taxes, clean air restrictions and media campaigns can considerably reduce adult smoking rates, especially when combined as a comprehensive strategy (U.S. DHHS 1994, 2000; CDC 1999; Hopkins et al. 2001; Levy et al. 2004). These policies not only reduce smoking initiation, but also lead current smokers to quit. Quitting can halt or even reverse many of the health problems associated with smoking (U.S. DHHS 1990; Taylor et al. 2002).
Due to data limitations, most statistical studies of tobacco control policies have examined the effect of only one policy or at most two policies (e.g., Hu et al. (1995a), Farrelly et al. (2003)). In addition, it is often difficult to distinguish the effects of tobacco control policies on smoking rates and especially health outcomes, because those effects are delayed. Policy-oriented simulation models provide a useful tool for examining how the effects of public policies unfold over time in complex social systems (Homer and Hirsch 2006; Levy et al. 2006). Simulation models of trends in smoking prevalence and health outcomes and of the effect of tobacco control policies on those trends have been developed by Mendez and Warner (2004), Mendez et al. (1998), Orme et al. (2001), Tengs et al. (2001; 2004), Ahmad (2005), Ahmad and Billimek (2005; 2006), Levy et al. (2000b; 2005a, b; 2006). The SimSmoke model of Levy et al. simultaneously considers a broader array of public policies than other models.
The purpose of this paper is to develop a SimSmoke simulation model for the state of California. California was the first state to implement strong anti-tobacco interventions statewide. California voters passed Proposition 99 in 1988, which increased excise taxes on cigarettes by 25¢ per pack, and designated one quarter of the increased revenue to establish and support the California Tobacco Control Program (CTCP). The strategy of the CTCP was to “denormalize” tobacco. The program was initially directed at increasing cessation, but later targeted its efforts at reducing exposure to environmental smoke, reducing youth access to cigarettes, and countering pro-tobacco messages. Specific CTCP elements included a statewide mass media campaign, competitive grants program, school-based prevention and cessation programs, community programs and coalitions, health care provider education, restrictions on marketing, and clean indoor air laws (Wakefield and Chaloupka 2000). As the first state to initiate a comprehensive tobacco control campaign and known for its success, California is of special interest and serves as a benchmark for other states. This paper attempts to show the effect of the different tobacco control policies in California on adult smoking rates and smoking-attributable deaths.
The California SimSmoke is patterned after the SimSmoke for the entire US. The California model is developed using data on population characteristics, smoking rates and public policies for that state. We consider four major policies: tax changes, clean air laws, media/comprehensive campaigns, and youth access enforcement. Specifically, the California SimSmoke model gauges how much smoking prevalence and deaths were changed by the introduction of these policies individually and as a group after controlling for other trends. Predictions of smoking prevalence between the years 1987/8 (the years before the CTCP began) through 2004 are compared to actual changes in smoking prevalence, and the role of the different policies are distinguished. We also consider the impact of tobacco control policies on smoking attributable deaths.
METHODOLOGY
Basic model
The SimSmoke model projects smoking rates and deaths attributable to smoking (Levy et al. 2000a, 2003). The simulation model begins with the number of smokers, never smokers, and ex-smokers by age and gender in the baseline year. In developing the model for California, it was important to pick a baseline year before the CTCP campaign started in order to capture the full effects of the campaign. Our choice also depended on the availability of sufficient data. We chose 1988 as our baseline year, since it met these two criteria as described below.
The basic model involves a population model, a smoking model, a smoking attributable death model and policy modules. A discrete time, first order Markov process is employed to project future population growth and smoking rates over time. A mathematical formulation and further description of the model can be found at https://cisnet.flexkb.net/mp/pub/cisnet_lung_pire_profile.pdf. The data sources for the California model are summarized in Table 1.
Table 1.
Data Used in California SimSmoke
| Variable | Source | Specifications |
|---|---|---|
| I. Population model | ||
| A. Population | CA Dept. of Finance estimates | Breakdowns by age, gender, and racial/ethnic groups |
| B. Fertility rates | CA Dept Health Services Vital Statistics data | Breakdowns by age and racial/ethnic group |
| C. Mortality rates | CA DHS Vital Statistics Public Use Death data and Death Master File | Breakdowns by age, gender, and racial/ethnic groups, total deaths and by lung cancer, COPD heart and stroke |
| II. Smoking model | ||
| A. Baseline prevalence rates for current and ex-smokers | NHIS for ages 18+, and 1990 CYTS <age 18. | Based on 100+ cigarettes lifetime and distinction between current and previous smokers. Breakdowns by smoking experience (<1, 1-2, 3-5, 6-10, 11-14, 15+ years), age, gender, and racial/ethnic groups. |
| B. Initiation rates | NHIS for ages 18+, and 1990 CYTS <age 18. | Breakdowns by age, gender, and racial/ethnic groups. |
| C. First year quit rates | NHIS | Breakdowns by age, gender, and racial/ethnic groups. |
| D. Relapse rates | USDHHS (1989), COMMIT data and other studies | Breakdowns by age |
| E. Relative death risks of smokers and ex-smokers | Cancer Prevention Study II (see NCI 1997 and USDHHS 2001) | Breakdowns by age and gender. |
| III. Policy Modules | ||
| A. Taxes | Tobacco Institute, CDC website, Orzechowki and Walker (2002) | Prices and taxes for 1993-2000 |
| B. Clean air laws | CDC and CTCP website, NCI (2001) ANR database | Different types of laws and their stringency |
| C. Media & other educational campaigns | CDC and CTCP website, and CTCP report | Expenditures per capita and audience |
| D. Youth access | SAMHSA and FDA (see Levy et al. 2001), CTCP website | Enforcement checks, penalties, community campaigns, self-service and vending machine bans |
Population model
We use estimates of population in 1988 to correspond to the smoking data and the start of the CTCP. Over time, the population changes through births and deaths.
Population data were from the Census population from 1988 with projections through 2020. They were originally obtained from Census Bureau (2002) Population Estimates Program, Population Division, U.S. Census Bureau, Washington, DC 20233. Data for death rates were collected from Birth Public Use Files and Death Public Use Files obtained from Vital Statistics of the California Department of Health Services, Center for Health Statistics, Office of Health Information and Research. We obtained data from the California Department of Finance, Demographic Research Unit website: http://www.dof.ca.gov/HTML/DEMOGRAP/Druhpar.asp.
In calibrating the population model over the period 1989 to 2000, we found population growth rates declining slightly in the early nineties and accelerating in the late nineties, when there were major changes in birth, migration rates and death rates. Consequently, we used population estimates and projections from the California Department of Finance website to correct the model’s population estimates. Specifically, we used the actual population estimates through age ten, when the smoking model first divides the population into never smokers, current smokers and former smokers. We then scaled the population aggregated over smoking groups to actual population by age, so that they totaled the actual and projected figures from the state.
Smoking model
Structure
Individuals are classified as never smokers from birth until they initiate smoking or die. Within the smoking model, individuals may evolve from never smokers to smokers through smoking initiation. Smokers may become ex-smokers through cessation and may return to smoking through relapse. Initiation, cessation and relapse rates are specific to age. Relapse also depends on the first year cessation rate and the number of years since quitting.
In the model, smokers are defined as individuals who have smoked more than 100 cigarettes in their lifetime and are currently smoking (either daily or on some days). Due to empirical challenges in measuring initiation and quitting and to insure stability and internal consistency of the model, initiation rates at each age are measured net of quitting. Specifically, net initiation is measured as the change in smoking rate at a given age and the rate at the previous age. Because the duration of smoking is not considered, we do not track the specific year when individuals initiate in this population-level model. An examination of prevalence data for 1987-90 indicated that smoking rates level off at about age 24, which is typical of patterns for the US as a whole (U.S. DHHS 1994). Consequently, initiation in the model occurs until age 24.
Cessation is tracked from age 24, since the relative risks of mortality from smoking are not discernable for those who quit smoking before that age (U.S. DHHS 1990; U.S. DHHS 2004). Cessation rates in the first year are distinguished by age, but relapse rates in later years are only distinguished by years since quitting. Ex-smokers are defined as those over the age of 24 who were not smoking at the time of the survey. In SimSmoke, ex-smokers are broken down into six categories, categorized by year since quitting through 15 years and then aggregated at > 15 years. Never smokers are those who have not smoked 100 cigarettes in their lifetime or have smoked 100 cigarettes in their lifetime, but are less than the age of 24 and not currently smoking.
Data
With the exception of the 1985 Current Population Survey (CPS), the only large scale data set that contained data prior to 1989, the start date of the CTCP, was the National Health Interview Survey (NHIS). The NHIS data are also used in previous studies (Pierce et al. 1998b; Gilpin et al. 2001; Gilpin et al. 2003). The NHIS data tracked well over the period 1990-9 with data from the 1990-9 California Tobacco Survey (CTS), and the 1992/3, 1995/6 and 1998/9 Tobacco Use Supplement (TUS) of the CPS.
Between 1985 and 1990, NHIS data were available for the years 1985, 1987, 1988, and 1990. Estimates of adult smoking prevalence for 1985 were substantially outside the upper bound of the confidence interval for the trend line for the period 1978-88 (N= 10,094). Estimates for 1987 and 1988 were within the bounds and very close to each other. To increase stability of the estimates, we averaged the NHIS data over the two years, 1987 and 1988. We obtained data by age for ages 18-20 and 21-24, by 10 year age groups from 25 through age 65, for ages 65-79, and for ages 80 and above. We were also able to distinguish never smokers, smokers, and ex-smokers (for <1, 1-2 years, and 3 years and above since quitting). Because data were not available in the NHIS data to create smoking rates by age before age 18, we used data from the 1990 California Youth Tobacco Survey (CYTS) for ages 10-17 and from the 1990 CTS for older ages to further distinguish smoking rates by individual age for the ages 10-24. We used data from the 1990 CTS to divide ex-smoker rates for those who quit more than 3 years into the groups needed for the model (3-5 years, 6-10 years, and 11-15 years and 15+ years). We used the relative proportions from the CYTS or CTS [e.g., (CTS rate by ex-smoker category * percentage of ex-smokers in NHIS that are 3+ years)/ CTS total percentage of ex-smokers 3+ years].
Data on quit rates for California for those age 25 and above were obtained from the NHIS. For each age bracket, the first year cessation was calculated as (the percent of the population that quit in the last year)/ (the percent of the population that quit in the last year + the percent of current smokers). For first quit rates net of relapse, Burns et al. (2000) recommend a measure based on those who quit in the last year but not the last 3 months. We used data on the percent that quit in the last 3 months to gauge first year relapse. We used US data from the US SimSmoke model (U.S. DHHS 1989; McWhorter et al. 1990; U.S. DHHS 1990; Gilpin et al. 1997) to measure relapse rates after the first year for California, assuming that relapse rates are similar to those in the US previous to the implementation of the CTCP program.
Smoking-Attributable Deaths
Smoking-attributable deaths in the SimSmoke model are predicted using smoking prevalence rates and the relative risks of smokers and ex-smokers relative to non-smokers, similar to standard attribution measures (Shultz et al. 1991; CDC 2000). Specifically, the relative risks and prevalence rate of smokers and ex-smokers and the death rate of a particular age group are used to distinguish the death rates of never smokers, smokers, and ex-smokers (see Appendix). The number of smokers at each age is then multiplied by (the death rate of smokers minus the death rate of never smokers) to obtain the excess deaths due to being a smoker. The same procedure is applied to each ex-smoker group using the ex-smoker death rate, and the results are summed over smoking groups for all ages to obtain the number of smoking attributable deaths.
Deaths rates are distinguished by age, gender and smoking types (never, current, and the 6 ex-smoker groups) using the data on death rates and smoking rates for California as described above, and relative risks estimates for smokers and ex-smokers from the Cancer Prevention Study II (U.S. DHHS 1989; Burns et al. 1997; Thun et al. 1997). While mortality rates by smoking status used in this study did not adjust for demographic and life style factors such as diet and physical activity, other studies (Malarcher et al. 2000; Thun et al. 2000) have found that these adjustments made little difference in the relative risk for smoking-attributable deaths. We assume that smoking mortality risks for the US as a whole apply to California.
Policy modules
The effects of stronger policies are calculated as percent reductions, PR, relative to the initial rates, i.e., [PR= (post-policy rate - initial rate)/initial rate, where PR<0]. Policies generally have their greatest effect in the first years. The effects are modeled as a permanent additive effect on smoking prevalence in the first year that the policy is implemented, i.e., Smokerst,a * (1+PRi,t,a) for policy i at time period t and which may vary by age a.
After the first year, policies affect initiation and cessation rates. If the policy affects initiation, the effects of the policy are sustained through lower initiation rates. Throughout the years in which the policy i is in effect, the percentage reduction lowers the initiation rate [as Initiation ratea *(1+PRi)]. The effects of a policy i may also be augmented over the same time period through increases in the first year cessation rate [as Cessation ratea *(1-PRi)]. First year quit rates continue to be elevated for each of the policies (except youth access policies) through the higher propensity to quit among individuals who smoke less (Hymowitz et al. 1991, 1997; Hughes 2000) and other (e.g., economic and informational) factors. We assume that the proportion of individuals who relapse increases in direct proportion with any added cessation, which is to say that the rates of relapse are unaffected by policy changes.
When more than one policy is in effect, we assume that there are constant proportional reductions, i.e., (1+PRi)*(1+PRj) for policies i and j. This formulation implies that the relative effect (PR) of a policy is independent of other policies in effect, but the absolute reduction in the smoking rate is smaller if another policy is in effect (due to the reduction from the other policy).
In separate policy modules, we examine the effect of tax changes, clean indoor air laws, mass media/comprehensive policies, and strategies to reduce youth access to cigarettes. The policy parameters in the model used to generate the predicted effects are based on thorough reviews of the literature (Levy et al. 2000a, b; Levy and Friend 2001; Levy et al. 2001a,b; Levy and Friend 2002a, b) and the advice of an expert panel. To consider uncertainty, we also provide bounds on the effect size parameters of the different policies. We rely on meta-analyses and reviews where available, exercising caution in their use, since some studies may not be directly relevant to the parameters in the model. In addition, we refer to recent studies and studies specifically considering the California experience. A description of policies and their effect sizes and bounds can be found in Table 2.
Table 2.
Policy Inputs for California SimSmoke Projection
| Policy | Description | Percentage Effect |
|---|---|---|
| Tax Policy | ||
| Most Recent Price | The state level average price for a pack of cigarettes is computed as the weighted average of single pack, carton, and vending machine cigarette prices, including state excise taxes. Prices of both branded and generic cigarettes are used in the average. | Elasticity -0.6 ages 10-17 -0.3 ages 18-24 -0.2 ages 25-34 -0.1 ages 35 and above |
| Most Recent State Tax Rate | Actual taxes per pack corresponding to price measure | |
| Clean Air Policies | ||
| Worksite Total Ban, well-enforced | Ban in all indoor worksites in all areas, with strong public acceptance and enforcement of laws | 6% reduction. |
| Restaurant Total Ban | Ban in all indoor restaurants in all areas | 2% reduction |
| Other Places Bans | Ban in 3 of 4 (government buildings, retail stores, public transportation and elevators) | 1% reduction |
| Mass Media Campaigns | ||
| Highly publicized media campaign | Campaign publicized heavily on TV (at least two months of the year) and at least some other media, with a social marketing approach | 6% reduction. |
| Moderately publicized media campaign | Campaign publicized sporadically on TV and in at least some other media, and a local program | 3.6% reduction. |
| Low publicity media campaign | Campaign publicized only sporadically in newspaper, billboard or some other media. | 1.2% reduction. |
| Youth Access Restrictions | ||
| Strongly enforced & publicized | Compliance checks are conducted 4 times per year per outlet, penalties are potent and enforced, and with heavy publicity and community involvement | 25% reduction |
| Well enforced | Compliance checks are conducted regularly, penalties are potent, and publicity and merchant training are included, but there is little community support | 12.5% reduction |
| Low enforcement | Compliance checks are conducted sporadically, penalties are weak, there is little merchant awareness and minimal community participation | 2.5% reduction |
Since the NHIS data are collected throughout the year, we consider the estimates as representing smoking rates in the midpoint month, July, and policy data are matched to their levels on July 1 of the particular year. The level of each individual policy from 1988 to 2004 in California is shown in Table 3.
Table 3.
Policy levels for the years 1988-2004 in California*
| Year | 1988 | 1989 | 1990 | 1991 | 1992 | 1993 | 1994 | 1995 | 1997 | 1999 | 2000 | 2001 | 2002 | 2003 | 2004 |
|---|---|---|---|---|---|---|---|---|---|---|---|---|---|---|---|
| Policy | |||||||||||||||
| Price | $1.25 | $1.61 | $1.82 | $2.00 | $2.04 | $1.94 | $1.95 | $1.97 | $2.06 | $3.35 | $3.65 | $3.91 | $4.06 | $3.99 | $4.08 |
| CPI | 123.0 | 128.6 | 136.1 | 141.8 | 146.5 | 150.0 | 152.2 | 154.5 | 162.2 | 171.4 | 178.4 | 185.1 | 190.0 | 193.0 | 200 |
| Adjusted Tax** | $0.26 | $0.45 | $0.51 | $0.54 | $0.55 | $0.58 | $0.61 | $0.61 | $0.61 | $0.99 | $1.19 | $1.21 | $1.25 | $1.26 | 1.26 |
| Adjusted Price** | $2.02 | $2.50 | $2.67 | $2.81 | $2.79 | $2.59 | $2.55 | $2.55 | $2.54 | $3.91 | $4.08 | $4.22 | $4.27 | $4.12 | $4.08 |
| Clean air laws*** | |||||||||||||||
| Work site | 28.3 | 28.3 | 28.3 | 28.7 | 28.8 | 30.4 | 32.6 | 74.1 | 76.0 | 78.0 | 78.0 | 78.0 | 79.0 | 80.0 | 80.0 |
| Restaurant | 37.0 | 37.0 | 37.8 | 38.8 | 39.3 | 43.7 | 49.1 | 100.0 | 100.0 | 100.0 | 100.0 | 100.0 | 100.0 | 100.0 | 100.0 |
| Other | 50.0 | 50.0 | 50.0 | 50.0 | 50.0 | 66.0 | 66.0 | 100.0 | 100.0 | 100.0 | 100.0 | 100.0 | 100.0 | 100.0 | 100.0 |
| Media campaign | None | Low | High | High | High | High | Med. | Med. | High | High | High | High | High | High | High |
| Youth access enforcement | Low | Low | Low | Low | Low | Low | Low | Med | Med. | Med. | Med. | Med. | Med. | Med. | Med. |
Policy in effect in January, implemented during year is recorded in the next year.
Converted to 2004 base year dollars
% of population covered by strict law
Taxes
The percentage effects of price on prevalence, initiation, and quit rates are modeled using a transformation of standard price elasticities, as described in (Levy et al. 2000a). The model assigns a participation elasticity for both males and females of -0.6 for younger than age 18, -0.3 for ages 18 to 24, -0.2 for ages 25 to 35, and -0.1 for ages 36 and above.
Consistent evidence is obtained in studies for California and for recent studies of initiation and cessation. Hu et al. (1995a) found that the overall price elasticity of cigarettes for California was estimated at -0.56, with a price elasticity of -0.33 for smoking participation and of -0.22 for the conditional quantity demand. (Emery et al. 2002) found that the reduction in per capita consumption after the 1999 California price increase was consistent with earlier elasticity estimates and that non-taxed sources (e.g., the internet and cross border purchases) were relatively small. Some recent studies for the US focus specifically on initiation and cessation. For adolescents, Tauras et al. (2001) obtained an elasticity of daily initiation of about -0.8 to -1.0%, with later work (Cawley et al. 2004) finding similar elasticities for males (-0.9 to -1.3). For young adults, Tauras (2005) obtained elasticities of uptake of -0.4 to -0.6, with potentially additional effects through cessation (specifically quit attempts) with an elasticity of about 3.5% (Tauras 2004). These studies do not specifically distinguish the immediate effect of policy changes from their more long-term impact, but their magnitudes are within ranges consistent with the SimSmoke effect sizes. A recent meta-analysis (Gallet and List 2003) found that total price elasticities, which incorporate quantity and prevalence effects, center around -0.48, with higher elasticities over longer time periods and for younger individuals and lower elasticities for more recently published studies. For our analysis, we consider bounds that incorporate a 33% reduction to a 33% increase in the age-specific elasticities, similar to consensus range of elasticities (-0.3 and -0.5 around a median of -0.4) observed in previous reviews (Chaloupka and Warner 1999; Hopkins et al. 2001).
The effect of prices are tracked over the period 1988-2004 using data on state retail prices and taxes were obtained from the Orzechowski and Walker (2005). The retail price was measured by a price index that includes generic cigarettes weighted by their proportionate sales. The simulation model adjusted prices to a base year using a simple average of the All Urban Consumer Price Indices for San Francisco and Los Angeles (www.bls.gov). Actual prices and taxes are used for the period 1985 through 2004. Since prices are for November of each year, we took weighted averages to reset them to July of each year.
The raw data and the deflated prices are shown for the first quarter of 1989-2004 in Table 3. California implemented a 25¢ tax increase at the initiation of the program in 1989, a 2¢ increase in 1994, and an additional 70¢/pack tobacco industry-driven retail price increase in 1999. There was also a reduction in cigarette prices in 1993 by tobacco manufacturers.
To project the future prices, price increases by the amount of the tax change (Levy et al. 2000a), and the untaxed portion of cigarette prices plus the sales tax are assumed to increase with the general price level, which implies that the cost of cigarettes exclusive of excise taxes increases with general price inflation while taxes are unaffected by inflation.
Clean Air
The clean air policy module examines the effect of three types of laws: work site, restaurant, and other public places (Levy et al. 2001b). The module projects a 10% reduction in prevalence rates with all policies fully implemented and with strong enforcement and media publicity. With smoking banned in all areas, work site laws have the largest effect, 7%, with restaurant and bars laws producing a 2% effect, and laws covering other places have a 1% effect. Partial bans (limited to separate areas) have one-third the effect and those limited to separately ventilated areas have two-thirds the effect of total bans.
Consistent evidence is obtained in recent studies for California and from a recent review of worksite studies. Moskowitz et al.(2000) found that California smokers who worked in localities with stronger workplace ordinance (compared with no workplace ordinance) were more likely to report the existence of a worksite smoking policy and to report quitting smoking in the prior 6 months. California studies (Woodruff et al 1993; Patten et al. 1995) have also found that worksites with stricter bans have lower smoking prevalence rates and smoke fewer cigarettes. A recent review (Fichtenberg and Glantz 2002a) found smoking prevalence in firms with worksite bans is 3.8 absolute percentage points lower with a 95% confidence interval of 2.8% to 4.7%. Accounting for the percent of the US population that works indoors and using a 25% initial smoking prevalence (based on smoking rates when most of the studies were conducted), this translates to a roughly 8% drop (6-10% confidence interval) in smoking prevalence in relative terms, slightly larger than the SimSmoke estimates. As bounds, we consider 25% below and 25% above the effect size for work site laws based on Fichtenberg and Glantz (2002a). We increase the range to 50% above and below the effect size for restaurant and pubic place laws, where the evidence is weaker (Levy and Friend 2003).
At the state level, there were no worksite restrictions until 1995, but many cities already had laws. In 1995, a law banning smoking in worksites except in specially ventilated areas was passed. Similar changes occurred in restaurants and other public places. We created indices for the worksite and restaurant local and state clean air laws, using data collected by the American Nonsmokers’ Rights Foundation (www.no-smoke.org/EffectivePopulationList.pdf). When the file indicated that the law was amended, we checked National Cancer Institute (2000) for earlier years to determine whether the law changed substantially. Because California SimSmoke is a state model, the local indices were weighted by the population (obtained from the US Census), and their incremental effects added to the state indices.
Mass media
The mass media policy module is based on a model of the effect of media campaign expenditures (Levy and Friend 2001). The model projects that a highly publicized mass media campaign (publicized heavily on TV and other media, and with a social marketing approach and the publicity from other policies) directed at all smokers yields a 6% reduction in smoking prevalence, with moderately publicized media campaign (as publicized sporadically on TV and in at least some other media and local programs) as having a 3.6% effect and a low publicity campaign (publicized only sporadically) as having a. 1.2% effect.
The only studies that have specifically attempted to distinguish the effects of statewide media campaigns from tax policies for California were by Hu et al. (1995a,b). Their studies indicated that the media campaign through 1994 yielded a reduction in per capita consumption rates of about 7-8%, of which prevalence might be expected to fall by a smaller amount. Over the same period, Pierce et al. (1998a) found that smoking prevalence fell by 12% (after netting out trends) while per capita tobacco consumption fell by 16%, suggesting that 75% of the per capita reduction would be through prevalence (assuming similar changes for price).
While studies have shown states with media campaigns as part of broader tobacco control programs have shown gains, the specific effect of media campaigns is less clear (Hopkins et al. 2001; Friend and Levy 2002; Secker-Walker et al. 2002). The Hopkins et al. (2001) review found an absolute reduction in smoking prevalence of 3.4% (approximately 13% in relative terms), but with a broad range of effects. Farrelly et al. (2003) estimated that tobacco control expenditures at high levels (including media campaigns) would reduce per capita (18 years and above) tobacco consumption (which includes prevalence and quantity smoked per smoker changes) by 8%, with similar results obtained for youth (Farrelly et al. 2005). A recent meta-analysis of the effect of smoking media campaigns (Snyder et al. 2004) found an absolute reduction of 4% in adults, which in relative terms translates to a 16% reduction. As bounds for media campaigns, we consider relative reductions over the range of 3%, based on some of the studies of less successful campaigns, to 15% based on the Hopkins et al. and Snyder et al. reviews.
The California state media campaign was launched in 1990, with low publicity prior to that time.. Per capita expenditures on the campaign averaged about $0.50 between 1990 and 1993, fell to about $0.35 between 1994 and 1996, and then increased to at least $0.50 from 1996 to 2004 (Gilpin et al. 2001; 2003). Studies indicate high levels of media awareness even for youth (Gilpin et al. 2001; 2003). We estimate that a highly publicized campaign was in effect between 1990 and 1993, fell to a medium level campaign between 1994 and 1996, and then went back to a highly publicized campaign from 1997 to 2004.
Youth access laws
The youth access module considers the effect of restrictions or bans on self-service and vending machines, and three components of retail compliance (enforcement through compliance checks, penalties, and merchant awareness/ community mobilization). The model considers three levels of enforcement: strongly enforced & publicized (compliance checks are conducted 4 times per year per outlet, penalties are potent and enforced, and with heavy publicity and community involvement), well enforced (compliance checks are conducted regularly, penalties are potent, and publicity and merchant training are included, but there is little community support), and weak enforcement (compliance checks are conducted sporadically, penalties are weak, there is little merchant awareness and minimal community participation).
With the substitution of other sources of cigarettes for retail purchases, Levy et al. (2000, 2001a) found that strongly enforced youth access policies with community mobilization reduced youth smoking by 25% (with no effect on quitting), with the effect on 10-15 year olds 1.5 times that on 16 and 17 year olds. The well enforced and low enforcement policies, respectively, yield 50% and 10% of the effect. No studies on the effect of youth access polices on smoking rates were conducted for the state of California, but Landrine et al. (2000) obtains retail compliance rates for the state consistent with our previous estimates.
Evidence on the effectiveness of youth access policies is weak, with mixed effects across studies (Hopkins et al. 2001; Levy et al. 2004). Hopkins et al. (2001) considered interventions with community mobilization and found a median decrease in smoking of 5.8 percentage points (translating to about a 20% relative decrease using a 30% last 30 day prevalence rate), with a range of 3.8 to 11 (or 13% to 37% in relative terms). Recent meta-analyses fail to find significant effects of policies on smoking rates (Stead and Lancaster 2000; Fichtenberg and Glantz 2002b). Consequently, we consider no effects as a lower bound. An upper bound of a 40% effect is considered, which is consistent with the results found for some intensive campaigns (Jason et al. 1991; Jason et al. 1996; Forster et al. 1998).
There was relatively little enforcement of laws restricting merchants from selling cigarettes to youth through the early nineties (Erickson et al. 1993). In California, compliance with youth access increased in 1995 with the passage of the Stop Tobacco Access to Kids Enforcement (STAKE) Act. The STAKE Act implemented a statewide program to decrease tobacco sales to youth to 20% of purchase attempts as measured by regular “sting operations” in stores. Compliance rates increased from about 60% to 80% in 1996, but have changed little through 2004 (www.dhs.ca.gov/tobacco/documents/pubs/2004TCSupdate.pdf). California had a low level of compliance from 1988 to 1995, and a well enforced policy since 1996.
The Effect of Tobacco Control Policies
The simulation model was programmed using Excel software. As indicated above, we consider the impact of policies implemented between 1989 and 2004.
We did not calibrate the model, because of the lack of sufficient data points before policies were implemented and the need to track policies from 1998 onward. To validate the model, we compare the predicted rates for adults (those ages 18 and above) to smoking prevalence rates obtained from CTS (unstandardized measures from Gilpin et al., 2003 for the years 1990, 1993, 1996, 1999, 2002), CPS-TUS [obtained from diskette for the years 1992 (sampled in Sept.), 1993 (sampled in Jan. and May), 1995 (sampled in Sept.), 1996 (sampled in Jan. and May), 1998 (sampled in Sept.), 1999 (sampled in Jan. and May), 2001 (sampled in June and Nov), and 2002 (sampled in Feb.)] and from California Behavioral Risk Factor Surveillance Survey (BRFFS, http://apps.nccd.cdc.gov/statesystem/). Since the estimates at any point in time (and over time in the case of the BRFSS) may reflect differences in how the surveys are conducted, we focus on percentage changes in the rates over time. Within the 1988-2004 time period, we consider 2-3 year intervals, focusing on period where there are major policy changes.
We then examine the effect of individual policies. First, we programmed the model so that all policies remain at their 1988 levels, just before California increased its tax by 25¢ per pack. Comparing the predictions of this model with the estimates with all CTCP policies implemented provides an estimate of the net reductions in smoking prevalence due to the policies implemented since 1988. We examine these effects in terms of relative reductions in the smoking rate [(Policy rate- status quo rate)/ status quo rate]. We next consider the role of individual policies in terms of relative reductions from the status quo and their contribution to the overall predicted decline in smoking during the 1988-2004 period. The sum of the effect of the individual policies does not add up to the contribution when all policies are simultaneously implemented, due to the assumption of a multiplicative relationship between the relative effects of policies. Consequently, we summed up the individual relative reductions from the four policies consider, and examined the relative reduction in each policy relative to that sum. Finally, we consider the impact of policies on smoking attributable deaths through the year 2010, assuming that policies remain constant at their 2004 levels for the years 2004 onward.
RESULTS
Validation of the Model
To validate the model, we compare smoking prevalence rates predicted by the model to actual prevalence rates, as shown in Table 4 and Figure 1. California SimSmoke projects a relatively large decline between 1988 and 1990, after the program began, a flattening between 1990 and 1995, a slightly greater decline in 1995 with the passage of clean air laws and increased media campaign, and then a greater decline in 1998, after the large price increases.
Table 4.
California SimSmoke Predictions and Data Estimates of Adult (ages 18+) Smoking Prevalence, 1988-2004
| Years | Model Prediction | Model % Change* | CTS | CTS % Change* | TUS** | TUS % Change* | BRFSS | BRFSS % Change* |
|---|---|---|---|---|---|---|---|---|
| 1988 | 25.5% | 22.7% | ||||||
| 1989 | 24.0% | 21.1% | ||||||
| 1990 | 22.0% | -13.6% (88-90) | 22.0% | 19.4% | -14.5% (88-90) | |||
| 1991 | 21.5% | 19.2% | ||||||
| 1992 | 21.1% | 20.0% | 20.0% | |||||
| 1993 | 20.8% | -5.5% (90-93) | 22.0% | -8.2% (90-93) | 19.7% | 18.2% | -6.2% (90-93) | |
| 1994 | 20.5% | 16.6% | ||||||
| 1995 | 19.7% | 19.1% | 15.9% | |||||
| 1996 | 19.3% | -7.0% (93-96) | 20.2% | -10.4% (93-96) | 19.1% | -3.3% (93-96) | 17.8% | *** |
| 1997 | 18.9% | 17.4% | ||||||
| 1998 | 18.4% | 18.1% | 17.5% | |||||
| 1999 | 17.1% | -11.7% (96-99) | 18.1% | -3.3% (96-99) | 16.8% | -12.2% (96-99) | 17.1% | -3.9% (96-99) |
| 2000 | 16.6% | 16.3% | ||||||
| 2001 | 16.1% | 15.1% | 16.4% | |||||
| 2002 | 15.8% | -7.8% (99-02) | 17.5% | -12.0% (99-02) | 14.8% | -11.7% (99-02) | 15.8% | -7.6% (99-02) |
| 2003 | 15.5% | 15.4% | ||||||
| 2004 | 15.1% | -3.8% (02-04) | 14.6% | -7.3% (02-04) |
% change estimated relative to the initial year (e.g. (1996-1993)/1993). The years over which the percentage change are estimated appear in parentheses
CPS-TUS data for 1992, 1995, and 1998 are from the September survey of that year, while the data for 1993, 1996 and 1999 are from the January and May surveys of that year. For 2001, the surveys were conducted in June and November and for 2002 in February.
We do not include calculate percentage changes from the BRFSS between 1993 and 1996 because of a definition change in the survey that led to the inclusion of more some day smokers.
Figure 1.
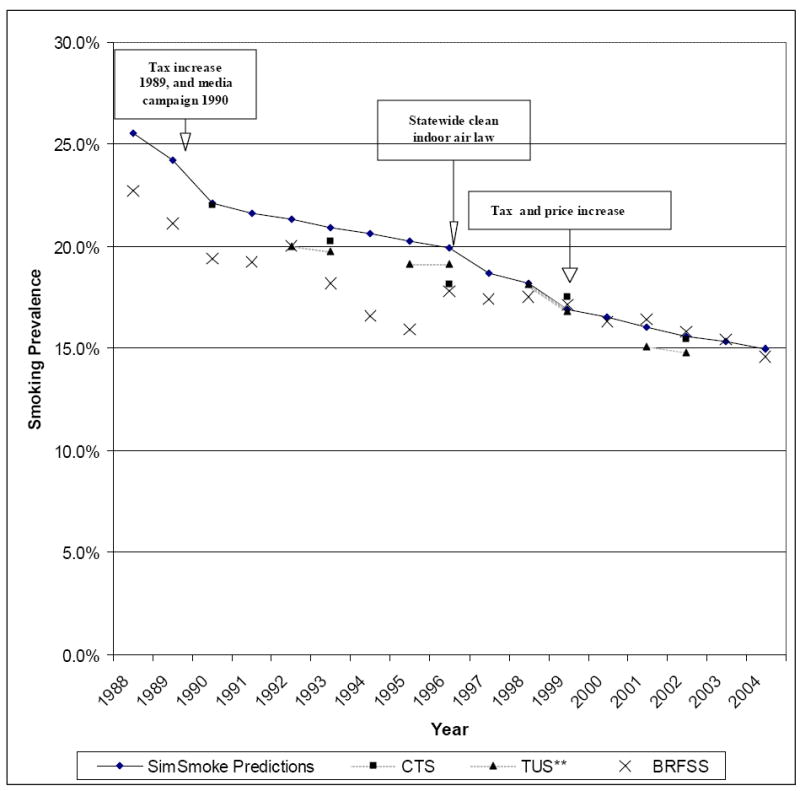
California SimSmoke Predictions and Data Estimates of Adult (age 18+) Smoking Prevalence, 1988-2004.
For 1990, the CTS prevalence estimate of 22.0 is close to the California SimSmoke estimate of 22.1. Over the period of 1990 and 2002 (not shown in Table), the predicted reduction from California SimSmoke (-28.5%) is close to that of CTS (-30.0%). However, the changes by sub-period differ, which may be due to differences in the timing of the surveys. Prevalence estimates from the state representative TUS are similar to those of California SimSmoke, and the percent change between 1993 and 2002 from TUS (-24.9%) are very close to those of California SimSmoke (-24.3%). The percent change for three-year sub-periods from the TUS are quite different from CTS, and are closer to that of the California SimSmoke for 1996-99. Both the CTS and TUS data indicate a large drop in the 1999-2002 period than predicted by the model.
Data from BRFSS covers a longer time period than the CTS or TUS data. Overall, California SimSmoke predicted a 41% prevalence decline from 1988 to 2004 compared to a 36% decline observed in BRFSS during the same period. A major change in definition occurring in 1996, which lead to the inclusion of more occasional smokers, could explain less decline in the BRFSS. Like the model, BRFSS indicates the largest percentage drops between 1988 and 1990 and between 1998/9 and 2004, although the impacts appear to be delayed in the later period in comparison to the model. The poor tracking over 1990-1996 period may be due to additional changes in definition and survey methods that occurred in 1991 and 1994 (Pierce et al. 1998a).
The Effect of Policies
Table 5 shows the predictions from California SimSmoke of adult smoking prevalence between 1988 and 2010 under different policy scenarios. In the presence of the CTCP and other policy changes, smoking rates were estimated to decline from 25.5% in 1988 to 15.1% in 2004 (a 41% reduction) to 13.5% by 2010 (a 47% reduction). As shown in the second column with policies all maintained at their 1988 level (i.e., no new policies as a result of the CTCP), the model projects that smoking prevalence among adults would have fallen from 25.5% in 1988 to 19.9% in 2004 (a 21% reduction) to 18.5% by 2010 (a 27% reduction). The model projects that the smoking prevalence in 2004 was 24% [i.e., (15.1-19.9)/19.9] lower than it would have been in the absence of the CTCP and price changes. Much of the difference is in the change in trends in 1988-90 and after 1998.
Table 5.
California SimSmoke Predictions of Adults (aged 18 and over) Smoking Prevalence with and without Tobacco Control Policies, 1988-2010
| Year | With actual Policies | With policies at their 1988 level | With price changes only | With clean air laws only | With only media policies | With only youth access policies |
|---|---|---|---|---|---|---|
| 1988 | 25.5% | 25.5% | 25.5% | 25.5% | 25.5% | 25.5% |
| 1989 | 24.0% | 25.2% | 24.3% | 25.2% | 25.1% | 25.2% |
| 1990 | 22.0% | 24.9% | 23.7% | 24.9% | 23.3% | 24.9% |
| % change 88-90 | -13.6% | -2.4% | -7.2% | -2.4% | -8.7% | -2.4% |
| 1991 | 21.5% | 24.5% | 23.1% | 24.5% | 23.0% | 24.5% |
| 1992 | 21.1% | 24.1% | 22.7% | 24.1% | 22.6% | 24.1% |
| 1993 | 20.8% | 23.8% | 22.4% | 23.7% | 22.2% | 23.8% |
| % change 90-93 | -5.5% | -4.5% | -5.4% | -4.8% | -4.5% | -4.5% |
| 1994 | 20.5% | 23.4% | 22.0% | 23.2% | 21.8% | 23.4% |
| 1995 | 19.7% | 23.0% | 21.6% | 22.3% | 21.6% | 23.0% |
| 1996 | 19.3% | 22.6% | 21.2% | 22.0% | 21.3% | 22.6% |
| % change 93-96 | -7.0% | -4.9% | -5.1% | -7.2% | -4.3% | -4.9% |
| 1997 | 18.9% | 22.2% | 20.8% | 21.6% | 20.1% | 22.2% |
| 1998 | 18.4% | 21.8% | 20.3% | 21.2% | 19.8% | 21.8% |
| 1999 | 17.1% | 21.5% | 18.9% | 20.8% | 19.5% | 21.4% |
| % change 96-99 | -11.7% | -5.0% | -11.1% | -5.1% | -8.4% | -5.2% |
| 2000 | 16.6% | 21.1% | 18.4% | 20.5% | 19.2% | 21.1% |
| 2001 | 16.1% | 20.8% | 17.9% | 20.2% | 18.9% | 20.7% |
| 2002 | 15.8% | 20.5% | ||||
| 2003 | 15.5% | 20.2% | 17.2% | 19.6% | 18.4% | 20.1% |
| 2004 | 15.1% | 19.9% | 16.9% | 19.3% | 18.1% | 19.8% |
| % change 99-04 | -11.4% | -7.1% | -10.5% | -7.2% | -6.9% | -7.5% |
| % change 88-04 | -40.6% | -21.8% | -33.8% | -24.1% | -28.9% | -22.3% |
| 2005 | 14.7% | 19.7% | 16.6% | 19.1% | 17.9% | 19.5% |
| 2010 | 13.5% | 18.5% | 15.3% | 17.9% | 16.9% | 18.3% |
| % change 04-10 | -10.9% | -7.2% | -9.6% | -7.3% | -7.0% | -7.7% |
The price of cigarettes rose relative to other prices in California between 1988 and 1992, then fell through late 1997, and then increased through 2002 (Table 3). With only price changes, the smoking rate among adults is projected to have fallen to 16.9% by 2004, which is 15.3% lower than the level in 2004 with policies at their 1988 levels. The model predicts a lower (upper) bound of 10.7% (19.6%) around the predicted level of a 15.3% reduction in 2004.
In contrast to taxes, if only clean air policies, media programs, or youth access policies were implemented, the projected smoking rates would be at least 18.1% in 2004 (compared to 15.0% if all these policies plus the tax increase were experienced). However, the projected impact of each of these policies varies at different points in time. Media policies had their biggest impact in the initial years of CTCP, leading to as much as a 7% reduction in smoking prevalence, with a lower (upper) bound prediction of 3.4% (14.7%). Clean air laws had little impact until 1995, but by 2004 show a reduction of 3.0%, with a lower (upper) bound prediction of 1.7% (4.3%). Youth access laws had little impact reaching a 0.5% reduction on smoking prevalence in 2004, with a lower (upper) bound prediction of 0% (1.1%).
Figure 2 shows the projected relative contribution of each specific policy on the reduction in smoking prevalence by 2004. The model projections suggest that the price increases, resulting from higher taxes or industry initiated increases, account for a majority (59%), media accounts for 28%, clean air laws account for 11%, and youth access only 2% of the reduction.
Figure 2.
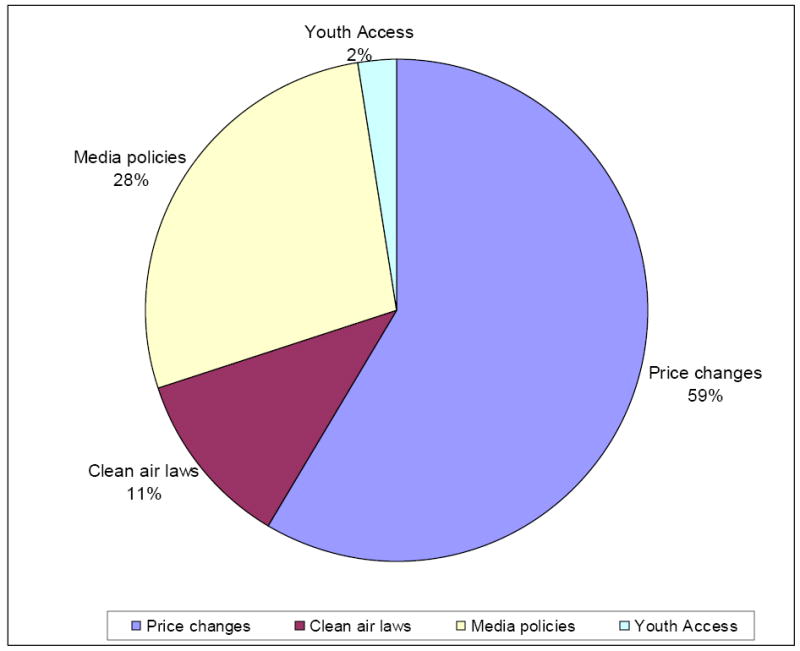
The Percent of the Change in Adult (age 18+) Smoking Prevalence Explained by Each Policy Relative to the Status Quo in 2004
Deaths Attributable to Smoking
Table 6 shows the projected effect of policies on deaths attributable to smoking. In 1988, we estimate that 40,042 smokers or ex-smokers died from cigarettes in California. By the year 2004, we predict that 46,985 Californians died in that year from smoking when the CTCP program is in effect, compared to 50,653 Californians in the absence of the program, or a difference of nearly 3,668 lives in the year 2004 alone. This difference grows over time, as the effects of the policy increase and as time since quitting of those who quit smoking increases (and hence the relative risks decline) as a result of CTCP. By 2010, the estimated number of deaths avoided increases to over 5,223 in that year alone. Summing over the years 1989 to 2010, the model estimates that about 55,444 lives were saved as a result of tobacco control policies in the state of California.
Table 6.
Smoking Attributable Deaths in California From California SimSmoke Predictions, 1989-2010
| Year | 1988 | 1989 | 1992 | 1995 | 1998 | 2001 | 2004 | 2005 | 2010 |
|---|---|---|---|---|---|---|---|---|---|
| Actual policies | 40,042 | 40,748 | 43,286 | 44,157 | 44,959 | 45,830 | 46,985 | 46,855 | 48,155 |
| Policies maintained at 1988 levels | 40,042 | 40,753 | 43,635 | 45,172 | 46,975 | 48,961 | 50,653 | 51,069 | 53,378 |
| Lives saved* | - | 5 | 349 | 1,016 | 2,016 | 3,131 | 3,668 | 4,213 | 5,223 |
Lives saved = deaths with actual policies-deaths with policies maintained at their 1988 levels
DISCUSSION
The California SimSmoke model distinguishes the role of new policies from previous long-term trends in smoking prevalence. The model projects that smoking rates would have fallen by 24% between 1988 and 2004 in the absence of policy change. This figure is similar to that observed in the United States over the same period (CDC 2004). The model projects that, by 2004, the CTCP and price increases reduced the adult smoking prevalence by over 25% more than the rates that would have been obtained in the absence of policies. Consistent with other estimates (Max et al. 2004), over 40,000 Californians are estimated to die each year. Over 50,000 lives are projected to be saved by the year 2010 as a result of the CTCP and price increases. The number of lives saved each year is projected to increase as benefits from cessation increase and those who are deterred from smoking initiation reach an age of 35 when smokers have higher mortality risks than non-smokers.
Consistent with our earlier models for the United States (Levy et al. 2005b) and for Arizona (Levy, Bauer et al. forthcoming), the model generally predicts well. To validate the model, we compare the level and trend in smoking prevalence from California SimSmoke to the estimates from three separate data sets. California SimSmoke shows very similar declines over the 1990-2002 time period to that of the CTS, and over the 1993-2002 period to that of the TUS over the 1993-2002 period. The model predicts less well compared to the BRFSS over the 1988-2004 period, but that survey is suspect in generating trends.
Unlike a simple trend line prediction, the model also does reasonably well at predicting trends over various sub-periods of time corresponding to policy changes (the price increase and implementation of the media campaign in 1988, the reduction in the media campaign in 1993, the price increase in late 1998). California SimSmoke generally shows a larger drop between 1996 and 1999 and underestimates the drop between 1999 and 2002 relative to the other data sets, but the smoking prevalence estimates from the different data sets show different trends over these sub-periods. In addition, Pierce et al. (1998a, b) and Siegel et al. (2000) observed similar changes in trend to those of the California SimSmoke, with a drop in trend after 1988, and a flattening in 1993. For example, relative to the estimated prevalence smoking rates from Pierce et al. (1998a), estimates from SimSmoke were quite close (-22.2% vs. -24.1%) between 1988 and 1996, with the largest drops between 1988 and 1993. Gilpin et al. (2001, 2003) also found larger drops in per capita tobacco consumption between 1988 and 1990 and between 1998 and 2000 than other years.
In addition to sampling error and data problems, the discrepancies between SimSmoke and other estimates may reflect timing issues. Data presented in Gilpin et al. (2001, 2003) indicate large reductions in quantity smoked between years 1993 and 2000, suggesting that the effects of policies (the 1998/9 price increases and possibly delayed effect of the 1995 clean air laws) were initially on the quantity smoked by current smokers. The policies may have taken more time to affect prevalence, e.g., through quitting, than predicted by California SimSmoke. Although the model does not explicitly consider quantity smoked, it does allow for continued effects of policies through increased cessation rates.
This study considered the effect of different policies in explaining the large reduction in smoking prevalence in California. The majority of the predicted policy effect was due to price increases. Some of this change is due to the national price increase in 1998 following the tobacco settlement, which is arguably not due to the CTCP. For example, based on prices in states such as Kentucky and Virginia, that did not increase their tax on cigarettes between 1998 and 2003, about $1.00 of the price increase might be attributed to non-tax factors, such as the tobacco settlement in 1998. Reducing the price by $1.00 would lead to an increase in the smoking rate of about 6%, or about 4% of the original 24% reduction due to the CTCP and price.
Future tax increases and the indexing of tobacco taxes to inflation might lead to further reductions in smoking rates and saving of lives. For example, an additional $1.00 cigarette excise tax increase is predicted to decrease smoking rates by 5% in the first year with additional effects in future years. However, the model does not consider tax evasion. Although evidence indicates that tax evasion is not a major factor in the state of California (Gilpin et al. 2001, 2003), it could be a greater concern with higher price differentials or increasing use of Internet purchases, as it has shown to be in other states where these conditions are met (Hyland et al. 2004).
While about 60% of the predicted effect of policies on prevalence was attributed to price, clean air laws and media also played an important role. The impact of the state clean air law implemented in 1995 and 1998 is less than the full potential of clean air laws, because many localities already had strict clean air laws prior to 1988 and many private worksites in other areas had stringent bans. Nevertheless clean air laws are relatively inexpensive to implement and have additional benefits in reducing second hand smoke exposure. Media explained about 28% of the policy-induced effect, with the media effects based on being integrated into a larger program (i.e., there is synergy with the tax and clean air policies). Maintaining adequate funding for a pro-health media campaigns is necessary to continue to reap the benefits of this policy. Youth access policies explain the smallest part of policy-induced changes in the adult smoking rate. They reduce smoking rates of youth by about 12% in the model, but youth are a small percentage of the population. In the absence of delayed initiation (Levy 2000a), their effect grows over time, as youth who have been deterred from smoking become a larger percentage of the adult population.
The predictions of policy effects in the model are based on an expert panel and extensive reviews of the literature, but are subject to the uncertainties inherent in such estimates. We have provided bounds for the effects of individual policies, based on the ranges observed in literature for individual policies. However, the relationship between the effects of the different policies when implemented together has not been clearly distinguished in the empirical literature. There may be important synergies as smoking is de-normalized, which can fuel policy change, which in turn can lead to further changes in societal norms that reduce smoking rates.
While synergies may lead to the model to under-predict the reduction in smoking rates, other factors may be responsible for the model over predicting the effect of policies. The large tax increase in California in 1998 was by voter initiative, and may not have occurred without the change in norms associated with prior anti-tobacco policies. In particular, studies (Gilpin et al. 2001; 2003) indicate that trends in smoking rates began changing before implementation of the CTCP, suggesting that anti-smoking sentiment played a role in the passage of policies and may have been responsible for some of the change in smoking prevalence after 1988. In addition, industry responses to changing policies and norms may act to dampen the effect of policies. Unfortunately, our knowledge of the effects of synergies between policies, social norms and industry feedback is limited, and consequently we did not attempt to model these effects. Further research is needed on these important topics (Levy et al. 2006).
Some tobacco control policies were not considered in the model. The state has only been subject to the weak federal limitations on advertising and warning labels implemented before 1988. However, stricter policies may be important in reducing future smoking rates, especially among 18-24 year olds who have been the target of industry advertisements and promotions (Gilpin et al. 2003). We also did not consider the role of a smoking ban in bars that was implemented in 1998, due to the lack of efficacy studies. While we expect that this policy probably had limited effects on smoking prevalence in the early years after implementation, it may have greater effects in future years as habits and societal norms concerning smoking change. California has also implemented public policies designed to increase the provision of cessation treatments and the implementation of the California Smoker’s Helpline. The total number of calls represented about 2% of smokers in 1998/99, resulting in further client contacts representing about 1% of smokers, and the annual number has since declined (Zhu S. Personal communication via email (10/3/02); 2002). The effect on smoking prevalence of cessation treatment policies implemented at a small scale is likely to be small in the early years (Levy and Friend 2002a).
Other limitations should also be recognized. While the model corrects for age related variations in population over time, the model does not explicitly incorporate migration from other states or immigration from other countries. Because the focus of the model presented here is the effect of policies within the state over a particular period of time, these populations would not have been directly affected by the policies (except possibly those who became residents during the nineties) and are not considered. These populations, however, may have different smoking rates, which would affect point estimates of smoking prevalence (Gilpin et al. 2003).
The model also does not explicitly consider differing gender and racial/ethnic groups or the role of income. California has large Hispanic and Asian populations. These groups generally have lower smoking rates than the rest of the population, but Hispanics have been found to be particularly sensitive to price policies (CDC 1998). Lower income smokers may also be more responsive to price increases (Chaloupka and Warner 1999; CDC 1998).
In summary, the results indicate that California policies have been effective in reducing smoking. Previous empirical studies have not distinguished the effect of the panoply of policies that were in effect in California. This modeling exercise shows the potential limitations in these partial analyses. While some of the success is attributed to the price increase in 1998 following the legal settlement with the tobacco companies, a large percent is due to the tax increases in California and the programs associated with that tax increase. The results from the California SimSmoke model are based on previous studies of policy effectiveness, and provide strong evidence that the success in California can, in fact, be attributed to their comprehensive tobacco control policies.
Acknowledgments
Funding for this project was received through grant # UO1-CA-097450 of the National Cancer Institute’s CISNET Program and grant # 10-RT-0102 from California’s Tobacco Related Disease Research Program.
The authors would like to thank all those who made their data available for development of the California SimSmoke computer simulation model including: Elizabeth Gilpin provided NHIS data and very helpful comments. We would also like to thank Jan Christensen of the Vital Statistics Section of the California Department of Health Services Office of Health Information and Research for access to Public Use Birth data and Public Use Death data; Maggie Leigheninger of the Americans for Non-Smokers Rights (ANR) and April Roeseler of the California Department of Health Services for access to the ANR State and Local Tobacco Control Policy Database; Bonnie Davis, Chief of the Survey Research Group of the Public Health Institute for access to the data from the California Adult Tobacco Survey (CATS), the California Youth Tobacco Survey (CYTS) and the California Behavioral Risk Factor Surveillance (BRFS) survey data and Holly Cisneros and David Cowling of the California Tobacco Control Program for information on enforcement and Synar compliance. The California Tobacco Survey (CTS) is conducted by Westat and is available from the Internet off the UC San Diego website at ssdc.ucsd.edu/ssdc/cpc00001.html, and population projections by the California Department of Finance are available off the Internet at www.dof.ca.gov/HTML/DEMOGRAP/Race7090.xls and www.dof.ca.gov/HTML/DEMOGRAP/Race/calif.xls (these tables have since been consolidated and, as of 9/10/04, the data are available at www.dof.ca.gov/HTML/DEMOGRAP/e-7.xls).
SimSmoke Model: Mathematical Appendix
Demographics Model
SimSmoke is built first on a demographic model. The total population (Pop) is distinguished by time period t and age a. Mortality rates (MR) are distinguished by age. Newborns depend on first year deaths rates and fertility rates (Fert) of females by age (through age 49) with equal birth rates for males and females, births through the first year (age 0) are:
After the first year, the population evolves as:
Smoking Rates
SimSmoke divides the population in the base year into (1) never smokers, (2) smokers and (3) 16 categories of ex-smokers (n=1,…, 16+), corresponding to years since last smoking. After the base year, individuals are classified as never smokers (designated by ns) from birth until they initiate smoking or die, according to:
Through age 24, the number of smokers (designated by s) is tracked as:
Once a smoker (designated by s), individuals continue in that category until they quit or die or re-enter the group through relapse. After age 24, smokers are tracked as:
First year ex-smokers are determined by the first year cessation rate applied to surviving smokers in the previous year. Ex-smokers for between n= 2,…, 15, are defined as:
For those who have ceased smoking for more than fifteen years, we add to the above equation the ex-smokers from the previous year who had quit for more than fifteen years and have not died or relapsed in the previous year.
Smoking-attributable deaths
Smoking-attributable deaths are estimated for each age and smoking group by multiplying the number of smokers in that group by the difference between the death rate of that smoking group and the death rate of never smokers. To estimate death rates, DRa,s, for each smoking group and never smokers were calculated for each age group and gender using the prevalence (Prev), relative risks (RRa,s) and death rates (DRa). The death rate of an age group can be expressed as:
Dividing both sides by DRa,ns, we obtain:
because RRa,s = DRa,s/DRa,ns and similarly for ex-smokers, and RRa,ns =1. Rearranging terms, the death rate for never smokers becomes:
For any smoking group s* (of either smokers or ex-smokers), we multiply both sides by DRa,s* / DRa,ns to obtain the death rate:
Footnotes
Publisher's Disclaimer: This is a PDF file of an unedited manuscript that has been accepted for publication. As a service to our customers we are providing this early version of the manuscript. The manuscript will undergo copyediting, typesetting, and review of the resulting proof before it is published in its final citable form. Please note that during the production process errors may be discovered which could affect the content, and all legal disclaimers that apply to the journal pertain.
Contributor Information
David T. Levy, Pacific Institute for Research and Evaluation, Professor, University of Baltimore.
Andrew Hyland, Roswell Park Cancer Institute.
Cheryl Higbee, Roswell Park Cancer Institute.
Lillian Remer, Pacific Institute for Research and Evaluation.
Christine Compton, Pacific Institute for Research and Evaluation.
References
- Ahmad S. Increasing excise taxes on cigarettes in California: a dynamic simulation of health and economic impacts. Prev Med. 2005;41(1):276–83. doi: 10.1016/j.ypmed.2004.10.024. [DOI] [PubMed] [Google Scholar]
- Ahmad S, Billimek J. Estimating the health impacts of tobacco harm reduction policies: a simulation modeling approach. Risk Anal. 2005;25(4):801–12. doi: 10.1111/j.1539-6924.2005.00647.x. [DOI] [PubMed] [Google Scholar]
- Ahmad S, Billimek J. Limiting youth access to tobacco: Comparing the long-term health impacts of increasing cigarette excise taxes and raising the legal smoking age to 21 in the United States. Health Policy. 2006 doi: 10.1016/j.healthpol.2006.04.001. [DOI] [PubMed] [Google Scholar]
- Armour BS, Woollery T, Malarcher A, Pechacek TF, Husten C. Annual Smoking- Attributable Mortality, Years of Potential Life Lost, and Productivity Losses – United States, 1997-2001. MMWR. 2005;54(25):625–628. [PubMed] [Google Scholar]
- Burns D, Anderson C, Johnson M, et al. Cessation and cessation measures among daily adult smokers: National- and State-specific data; Population-based Smoking Cessation: A Conference on What Works to Influence Smoking in the General Population Smoking and Tobacco Control Monograph No. 12. N. C. Institute; Bethesda, MD: National Cancer Institute, National Institutes of Health; 2000. pp. 113–304. [Google Scholar]
- Burns D, Garfinkel L, Samet J. Smoking and Tobacco Control Monograph 8. Bethesda, MD: National Institutes of Health, National Cancer Institute; 1997. Changes in Cigarette-Related Disease Risks and Their Implication for Prevention and Control. [Google Scholar]
- Cawley J, Markowitz S, Tauras J. Lighting up and slimming down: the effects of body weight and cigarette prices on adolescent smoking initiation. J Health Econ. 2004;23(2):293–311. doi: 10.1016/j.jhealeco.2003.12.003. [DOI] [PubMed] [Google Scholar]
- CDC. Response to increases in cigarette prices by race/ethnicity, income and age groups-United States, 1976-1993. MMWR Morb Mortal Wkly Rep. 1998;47:605–9. [PubMed] [Google Scholar]
- CDC. Best practices of comprehensive tobacco control programs. Atlanta, GA: U.S. Department of Health and Human Services, Centers for Disease Control; 1999. [Google Scholar]
- CDC. Cigarette smoking among adults--United States, 1998. MMWR Morb Mortal Wkly Rep. 2000;49(39):881–4. [PubMed] [Google Scholar]
- CDC. Annual smoking-attributable mortality, years of potential life lost, and economic costs--United States, 1995-1999. MMWR Morb Mortal Wkly Rep. 2002;51(14):300–3. [PubMed] [Google Scholar]
- CDC. Cigarette smoking-attributable morbidity---United States, 2000. MMWR Morb Mortal Wkly Rep. 2003;52(35):842–4. [PubMed] [Google Scholar]
- CDC. Cigarette smoking among adults--United States, 2002. MMWR Morb Mortal Wkly Rep. 2004;53(20):427–31. [PubMed] [Google Scholar]
- Chaloupka FJ, Warner KE. The economics of smoking. New York, North-Holland: Elsevier Science B.V; 1999. [Google Scholar]
- Emery S, White MM, Gilpin EA, Pierce JP. Was there significant tax evasion after the 1999 50 cent per pack cigarette tax increase in California? Tob Control. 2002;11(2):130–4. doi: 10.1136/tc.11.2.130. [DOI] [PMC free article] [PubMed] [Google Scholar]
- Erickson AD, Woodruff SI, Wildey MB, Kenney E. A baseline assessment of cigarette sales to minors in San Diego, California. J Community Health. 1993;18(4):213–24. doi: 10.1007/BF01324432. [DOI] [PubMed] [Google Scholar]
- Farrelly MC, Davis KC, Haviland ML, Messeri P, Healton CG. Evidence of a dose-response relationship between “truth” antismoking ads and youth smoking prevalence. Am J Public Health. 2005;95(3):425–31. doi: 10.2105/AJPH.2004.049692. [DOI] [PMC free article] [PubMed] [Google Scholar]
- Farrelly MC, Pechacek TF, Chaloupka FJ. The impact of tobacco control program expenditures on aggregate cigarette sales: 1981-2000. J Health Econ. 2003;22(5):843–59. doi: 10.1016/S0167-6296(03)00057-2. [DOI] [PubMed] [Google Scholar]
- Fichtenberg CM, Glantz SA. Effect of smoke-free workplaces on smoking behaviour: systematic review. British Medical Journal. 2002a;325(7357):188. doi: 10.1136/bmj.325.7357.188. [DOI] [PMC free article] [PubMed] [Google Scholar]
- Fichtenberg CM, Glantz SA. Youth access interventions do not affect youth smoking. Pediatrics. 2002b;109(6):1088–92. doi: 10.1542/peds.109.6.1088. [DOI] [PubMed] [Google Scholar]
- Forster JL, Murray DM, Wolfson M, et al. The effects of community policies to reduce youth access to tobacco. American Journal of Public Health. 1998;88(8):1193–1198. doi: 10.2105/ajph.88.8.1193. [DOI] [PMC free article] [PubMed] [Google Scholar]
- Friend K, Levy D. Reductions in smoking prevalence and cigarette consumption associated with mass-media campaigns. Health Education Research. 2002;17:1, 85–98. doi: 10.1093/her/17.1.85. [DOI] [PubMed] [Google Scholar]
- Gallet CA, List JA. Cigarette demand: a meta-analysis of elasticities. Health Econ. 2003;12(10):821–35. doi: 10.1002/hec.765. [DOI] [PubMed] [Google Scholar]
- Gilpin EA, Emery SL, Farkas AJ, et al. The California tobacco control program: a decade of progress, 1989-1999. La Jolla, CA: University of California, San Diego; 2001. [Google Scholar]
- Gilpin EA, Emery SL, Farkas AJ, et al. Tobacco Control Successes in California: A focus on the Young People, Results from the California Tobacco Control Surveys, 1990-2002. La Jolla, CA: University of California, San Diego; 2003. [Google Scholar]
- Gilpin EA, Pierce JP, Farkas AJ. Duration of smoking abstinence and success in quitting. J Natl Cancer Inst. 1997;89(8):572–6. doi: 10.1093/jnci/89.8.572. [DOI] [PubMed] [Google Scholar]
- Homer JB, Hirsch GB. System dynamics modeling for public health: background and opportunities. Am J Public Health. 2006;96(3):452–8. doi: 10.2105/AJPH.2005.062059. [DOI] [PMC free article] [PubMed] [Google Scholar]
- Hopkins DP, Briss PA, Ricard CJ, et al. Reviews of evidence regarding interventions to reduce tobacco use and exposure to environmental tobacco smoke. Am J Prev Med. 2001;20(2 Suppl):16–66. doi: 10.1016/s0749-3797(00)00297-x. [DOI] [PubMed] [Google Scholar]
- Hu TW, Sung HY, Keeler TE. Reducing cigarette consumption in California: tobacco taxes vs an anti-smoking media campaign. Am J Public Health. 1995a;85(9):1218–22. doi: 10.2105/ajph.85.9.1218. [DOI] [PMC free article] [PubMed] [Google Scholar]
- Hu TW, Sung HY, Keeler TE. The state antismoking campaign and the industry response: the effects of advertising on cigarette consumption in California. Am Econ Rev. 1995b;85(2):85–90. [PubMed] [Google Scholar]
- Hughes JR. Reduced smoking: an introduction and review of the evidence. Addiction. 2000;95(Suppl 1):S3–7. doi: 10.1080/09652140032008. [DOI] [PubMed] [Google Scholar]
- Hyland A, Higbee C, Bauer JE, Giovino GA, Cummings KM. Cigarette purchasing behaviors when prices are high. J Public Health Manag Pract. 2004;10(6):497–500. doi: 10.1097/00124784-200411000-00004. [DOI] [PubMed] [Google Scholar]
- Hymowitz N, Cummings KM, Hyland A, et al. Predictors of smoking cessation in a cohort of adult smokers followed for five years. Tobacco Control. 1997;6(Suppl 2):S57–S62. doi: 10.1136/tc.6.suppl_2.s57. [DOI] [PMC free article] [PubMed] [Google Scholar]
- Hymowitz N, Sexton M, Ockene J, Grandits G. Baseline factors associated with smoking cessation and relapse. MRFIT Research Group. Prev Med. 1991;20(5):590–601. doi: 10.1016/0091-7435(91)90057-b. [DOI] [PubMed] [Google Scholar]
- Jason LA, Billows WD, Schnopp-Wyatt DL, King C. Long-term findings from Woodridge in reducing illegal cigarette sales to older minors. Eval Health Prof. 1996;19(1):3–13. doi: 10.1177/016327879601900101. [DOI] [PubMed] [Google Scholar]
- Jason LA, Ji PY, Anes MD, Birkhead SH. Active enforcement of cigarette control laws in the prevention of cigarette sales to minors. JAMA. 1991;266(22):3159–61. [PubMed] [Google Scholar]
- Landrine H, Klonoff EA, Reina-Patton A. Minors’ access to tobacco before and after the California STAKE Act. Tob Control. 2000;9(Suppl 2):II15–7. doi: 10.1136/tc.9.suppl_2.ii15. [DOI] [PMC free article] [PubMed] [Google Scholar]
- Levy DT, Bauer JE, Lee HR. Simulation modeling and tobacco control: creating more robust public health policies. Am J Public Health. 2006;96(3):494–8. doi: 10.2105/AJPH.2005.063974. [DOI] [PMC free article] [PubMed] [Google Scholar]
- Levy DT, Bauer J, Ross H, Powell L. The Role of Public Policies in Reducing Smoking Prevalence and Deaths Caused by Smoking in Arizona: Results from the Arizona Tobacco Policy Simulation Model. Journal of Public Health Management and Practice. doi: 10.1097/00124784-200701000-00010. forthcoming. [DOI] [PubMed] [Google Scholar]
- Levy DT, Chaloupka F, Gitchell J, Mendez D, Warner KE. The use of simulation models for the surveillance, justification and understanding of tobacco control policies. Health Care Manag Sci. 2002;5(2):113–20. doi: 10.1023/a:1014476916361. [DOI] [PubMed] [Google Scholar]
- Levy DT, Cummings KM, Hyland A. Increasing taxes as a strategy to reduce cigarette use and deaths: results of a simulation model. Prev Med. 2000a;31(3):279–86. doi: 10.1006/pmed.2000.0696. [DOI] [PubMed] [Google Scholar]
- Levy DT, Cummings KM, Hyland A. A simulation of the effects of youth initiation policies on overall cigarette use. Am J Public Health. 2000b;90(8):1311–4. doi: 10.2105/ajph.90.8.1311. [DOI] [PMC free article] [PubMed] [Google Scholar]
- Levy DT, Friend K. A computer simulation model of mass media interventions directed at tobacco use. Prev Med. 2001;32(3):284–294. doi: 10.1006/pmed.2000.0808. [DOI] [PubMed] [Google Scholar]
- Levy DT, Friend K. Examining the effects of tobacco treatment policies on smoking rates and smoking related deaths using the SimSmoke computer simulation model. Tob Control. 2002a;11(1):47–54. doi: 10.1136/tc.11.1.47. [DOI] [PMC free article] [PubMed] [Google Scholar]
- Levy DT, Friend K. A simulation model of policies directed at treating tobacco use and dependence. Med Decis Making. 2002b;22(1):6–17. doi: 10.1177/0272989X0202200101. [DOI] [PubMed] [Google Scholar]
- Levy DT, Friend K, Holder H, Carmona M. Effect of policies directed at youth access to smoking: results from the SimSmoke computer simulation model. Tobacco Control. 2001a;10(2):108–116. doi: 10.1136/tc.10.2.108. [DOI] [PMC free article] [PubMed] [Google Scholar]
- Levy DT, Friend K, Polishchuk E. Effect of clean indoor air laws on smokers: the clean air module of the SimSmoke computer simulation model. Tob Control. 2001b;10(4):345–51. doi: 10.1136/tc.10.4.345. [DOI] [PMC free article] [PubMed] [Google Scholar]
- Levy DT, Friend KB. A simulation model of tobacco youth access policies. J Health Polit Policy Law. 2000;25(6):1023–50. doi: 10.1215/03616878-25-6-1023. [DOI] [PubMed] [Google Scholar]
- Levy DT, Friend KB. The effects of clean indoor air laws: what do we know and what do we need to know? Health Educ Res. 2003;18(5):592–609. doi: 10.1093/her/cyf045. [DOI] [PubMed] [Google Scholar]
- Levy DT, Gitchell JG, Chaloupka F. The Effects of Tobacco Control Policies on Smoking Rates: A Tobacco Control Scorecard. J Public Health Manag Pract. 2004;10:338–351. doi: 10.1097/00124784-200407000-00011. [DOI] [PubMed] [Google Scholar]
- Levy DT, Mumford E, Pesin B. Tobacco Control Policies, and Reductions in Smoking Rates and Smoking-Related Deaths: Results from the SimSmoke Model. Expert Review of Pharmacoeconomics and Outcomes Research. 2003;3(4):457–68. doi: 10.1586/14737167.3.4.457. [DOI] [PubMed] [Google Scholar]
- Levy DT, Nikolayev N, Mumford EA. The Healthy People 2010 Smoking Prevalence and Tobacco Control Objectives: Results from the SimSmoke Tobacco Control Policy Simulation Model. Cancer Causes and Control. 2005a;16(4):359–71. doi: 10.1007/s10552-004-7841-4. [DOI] [PubMed] [Google Scholar]
- Levy DT, Nikolayev N, Mumford EA. Recent Trends in Smoking and the Role of Public Policies: Results from the SimSmoke Tobacco Control Policy Simulation Model. Addiction. 2005b;10(10):1526–37. doi: 10.1111/j.1360-0443.2005.01205.x. [DOI] [PubMed] [Google Scholar]
- Malarcher AM, Schulman J, Epstein LA, et al. Methodological issues in estimating smoking-attributable mortality in the United States. Am J Epidemiol. 2000;152(6):573–84. doi: 10.1093/aje/152.6.573. [DOI] [PubMed] [Google Scholar]
- Max W, Rice DP, Sung HY, Zhang X, Miller L. The economic burden of smoking in California. Tob Control. 2004;13(3):264–7. doi: 10.1136/tc.2003.006023. [DOI] [PMC free article] [PubMed] [Google Scholar]
- McWhorter WP, Boyd GM, Mattson ME. Predictors of quitting smoking: the NHANES I followup experience. J Clin Epidemiol. 1990;43(12):1399–405. doi: 10.1016/0895-4356(90)90108-2. [DOI] [PubMed] [Google Scholar]
- Mendez D, Warner KE. Adult cigarette smoking prevalence: declining as expected (not as desired) Am J Public Health. 2004;94(2):251–2. doi: 10.2105/ajph.94.2.251. [DOI] [PMC free article] [PubMed] [Google Scholar]
- Mendez D, Warner KE, Courant PN. Has smoking cessation ceased? Expected trends in the prevalence of smoking in the United States. Am J Epidemiol. 1998;148(3):249–58. doi: 10.1093/oxfordjournals.aje.a009632. [DOI] [PubMed] [Google Scholar]
- Moskowitz JM, Lin Z, Hudes ES. The impact of workplace smoking ordinance in California on smoking cessation. American Journal of Public Health. 2000;90(5):757–761. doi: 10.2105/ajph.90.5.757. [DOI] [PMC free article] [PubMed] [Google Scholar]
- National Cancer Institute. State and Local Legislative Action to Reduce Tobacco Use. Bethesda MD: U.S. DHHS, National Institutes of Health, National Cancer Institute; 2000. [Google Scholar]
- Orme ME, Hogue SL, Kennedy LM, Paine AC, Godfrey C. Development of the health and economic consequences of smoking interactive model. Tob Control. 2001;10(1):55–61. doi: 10.1136/tc.10.1.55. [DOI] [PMC free article] [PubMed] [Google Scholar]
- Orzechowski and Walker. The tax burden on tobacco, historical compilation. Arlington, VA: 2005. [Google Scholar]
- Patten CA, Gilpin E, Cavin SW, Pierce JP. Workplace smoking policy and changes in smoking behaviour in California: A suggested association. Tobacco Control. 1995;4:36–41. [Google Scholar]
- Pierce J, Gilpin E, Emery S, et al. Tobacco control in California: Who’s winning the war? An evaluation of the California Tobacco Control Program, 1989-1996. La Jolla, CA: University of California, San Diego; 1998a. [Google Scholar]
- Pierce JP, Gilpin EA, Emery SL, et al. Has the California tobacco control program reduced smoking? Jama. 1998b;280(10):893–9. doi: 10.1001/jama.280.10.893. [DOI] [PubMed] [Google Scholar]
- Secker-Walker RH, Gnich W, Platt S, Lancaster T. Community interventions for reducing smoking among adults. Cochrane Database Syst Rev. 2002;(3):CD001745. doi: 10.1002/14651858.CD001745. [DOI] [PMC free article] [PubMed] [Google Scholar]
- Shultz JM, Novotny TE, Rice DP. Quantifying the disease impact of cigarette smoking with SAMMEC II software. Public Health Rep. 1991;106(3):326–33. [PMC free article] [PubMed] [Google Scholar]
- Siegel M, Mowery PD, Pechacek TP, et al. Trends in adult cigarette smoking in California compared with the rest of the United States, 1978-1994. Am J Public Health. 2000;90(3):372–9. doi: 10.2105/ajph.90.3.372. [DOI] [PMC free article] [PubMed] [Google Scholar]
- Snyder LB, Hamilton MA, Mitchell EW, et al. A meta-analysis of the effect of mediated health communication campaigns on behavior change in the United States. J Health Commun. 2004;9(Suppl 1):71–96. doi: 10.1080/10810730490271548. [DOI] [PubMed] [Google Scholar]
- Stead LF, Lancaster T. A systematic review of interventions for preventing tobacco sales to minors. Tobacco Control. 2000;9:169–76. doi: 10.1136/tc.9.2.169. [DOI] [PMC free article] [PubMed] [Google Scholar]
- Tauras JA. Public policy and smoking cessation among young adults in the United States. Health Policy. 2004;68(3):321–32. doi: 10.1016/j.healthpol.2003.10.007. [DOI] [PubMed] [Google Scholar]
- Tauras JA. Can public policy deter smoking escalation among young adults? Journal of Policy Analysis and Management. 2005;24(4):771–84. doi: 10.1002/pam.20137. [DOI] [PubMed] [Google Scholar]
- Tauras JA, O’Malley P, Johnston L. Effects of price and access laws on teenage smoking initiation: a national longitudinal analysis 2001 [Google Scholar]
- Taylor DH, Jr, Hasselblad V, Henley SJ, Thun MJ, Sloan FA. Benefits of smoking cessation for longevity. Am J Public Health. 2002;92(6):990–6. doi: 10.2105/ajph.92.6.990. [DOI] [PMC free article] [PubMed] [Google Scholar]
- Tengs TO, Ahmad S, Moore R, Gage E. Federal policy mandating safer cigarettes: a hypothetical simulation of the anticipated population health gains or losses. J Policy Anal Manage. 2004;23(4):857–72. doi: 10.1002/pam.20051. [DOI] [PubMed] [Google Scholar]
- Tengs TO, Osgood ND, Lin TH. Public health impact of changes in smoking behavior: results from the Tobacco Policy Model. Med Care. 2001;39(10):1131–41. doi: 10.1097/00005650-200110000-00010. [DOI] [PubMed] [Google Scholar]
- Thun MJ, Apicella LF, Henley SJ. Smoking vs other risk factors as the cause of smoking-attributable deaths: confounding in the courtroom. Jama. 2000;284(6):706–12. doi: 10.1001/jama.284.6.706. [DOI] [PubMed] [Google Scholar]
- Thun MJ, Myers DG, Day-Lally C, et al. Changes in cigarette related disease risks and their implication for prevention and control. N. C. Institute. Bethesda, MD: National Cancer Institute; 1997. Age and the exposure-response relationships between cigarette smoking and premature death in Cancer Prevention Study II; pp. 383–475. [Google Scholar]
- U.S. DHHS. Reducing the health consequences of smoking: 25 years of progress: a report of the Surgeon General. Atlanta, GA: Centers for Disease Control and Prevention, National Center for Chronic Disease Prevention and Health Promotion, Office on Smoking and Health; 1989. [Google Scholar]
- U.S. DHHS. The Health Benefits of Smoking Cessation: a report of the Surgeon General. Atlanta Georgia: U.S. Department of Health and Human Services, Public Health Service, Centers for Disease Control, Office on Smoking and Health; 1990. [Google Scholar]
- U.S. DHHS. Preventing tobacco use among young people: a report of the Surgeon General. Atlanta, GA: Centers for Disease Control and Prevention, National Center for Chronic Disease Prevention and Health Promotion, Office on Smoking and Health; 1994. [Google Scholar]
- U.S. DHHS. Healthy people 2010. Atlanta: Centers for Disease Control, Office of Disease Prevention and Health Promotion; 2000. [Google Scholar]
- U.S. DHHS. The Health Consequences of Smoking. Atlanta, GA: Centers for Disease Control and Prevention, National Center for Chronic Disease Prevention and Health Promotion, Office on Smoking and Health; 2004. [Google Scholar]
- Wakefield M, Chaloupka F. Effectiveness of comprehensive tobacco control programmes in reducing teenage smoking in the USA. Tobacco Control. 2000;9:177–186. doi: 10.1136/tc.9.2.177. [DOI] [PMC free article] [PubMed] [Google Scholar]
- Woodruff TJ, Rosbrook B, Pierce J, Glantz SA. Lower levels of cigarette consumption found in smoke-free workplaces in California. Arch Intern Med. 1993 Jun 28;153(12):1485–93. [PubMed] [Google Scholar]