

Abstract
Oligonucleotide assays have been invaluable for elucidation of the molecular mechanisms of retroviral integrases. A suite of rapid and sensitive fluorescence assays to measure the DNA binding, processing, and joining activities of integrase (IN) is described here. The assays are especially useful for characterizing the major activities of the enzyme, and for handling large numbers of samples efficiently. They can greatly facilitate further biochemical and structural analyses for HIV-1 and other IN proteins. The assays can also be adapted for moderate-high throughput testing of various inhibitory compounds.
Keywords: Integrase (IN), fluorescence, anisotropy, carbofluorescein, oligonucleotides
1. Introduction
The integration reaction mediated by retroviral integrase (IN) proteins proceeds in two temporally distinct steps (Fig. 1A). In the first step called processing, two nucleotides adjacent to a conserved CA are removed from the 3′-ends of viral DNA. This reaction can occur in the cytoplasm of infected cells as soon as reverse transcriptase has completed synthesis of the viral DNA ends. The second step, joining, is a concerted cleavage and ligation reaction in which the newly processed 3′-ends of the viral DNA are joined to staggered phosphates in the backbone of host nuclear DNA. The product of this reaction is a gapped intermediate, and the length of the gap (4 to 6 nucleotides) is characteristic of the IN protein. Continuity of the host DNA is restored, and the provirus stabilized, through the action of host cell DNA damage sensing and repair functions [1].
Fig. 1.
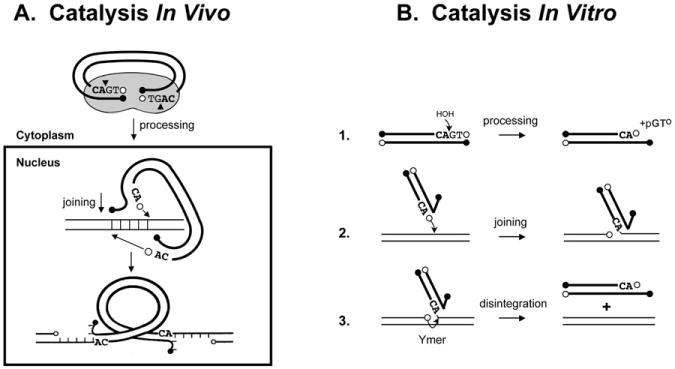
Catalysis by retroviral integrase (IN). (A), Shows the steps known to occur in vivo. (B), Shows the steps that can be measured separately in vitro using short oligodeoxyribonucleotide duplexes (oligos) that represent a viral DNA end (heavy lines) and a target DNA (light lines). The last four nucleotides in the 3′-ends of HIV-1 DNA are shown. Open circles indicate 3′-OH ends; filled circles, 5′-PO4 ends.
It has been more than two decades since the first report of a simple deoxyoligonucleotide-based assay to measure the catalytic activities of retroviral integrases in vitro [2] (Fig. 1B). In this assay, short (18-22 bp) radioactively labeled DNA duplexes comprising the sequence of either viral DNA terminus are incubated with the cognate IN protein in the presence of a required metal cofactor (Mg2+ or Mn2+). The processing and/or subsequent joining of the labeled processed strand to other such duplexes (self-integration), or other target DNAs added to the reaction, is then followed by electrophoresis of the mixture in polyacrylamide gels [3, 4]. The development of this assay was a watershed in the field, greatly facilitating the subsequent biochemical and structural analyses that have contributed to our current understanding of integrase function. Such gel assays and derivatives thereof, are still used by many laboratory investigators, and have become somewhat of a “gold standard” in that respect. Detailed protocols for these assays, reviewed some years ago [5, 6], are still relevant today. These gel assays have the advantage that all of the substrates, products, and byproducts of the reaction can be visualized directly and quantified. Nevertheless, they do suffer from some distinct disadvantages. They are time-consuming, labor-intensive, and for some applications, particularly quantification of joining activity, have low sensitivity.
To circumvent some of the disadvantages mentioned above, and to facilitate high throughput analyses, various modifications of the oligonucleotide assay have been developed, which eliminate the need for electrophoretic separation. In some cases, reporters other than radioactivity have been exploited and/or nucleotide modifications have been included to immobilize substrates or allow isolation of the products. For example, Surface Plasmon Resonance has been used to measure the kinetics of IN DNA binding to immobilized oligonucleotide duplexes representing viral DNA ends or target DNAs [7] and anisotropy has been used to measure IN binding to similar substrates labeled with a fluorophore [8, 9]. The processing reaction has been assayed by quantitating the released radioactively-labeled dinucleotide, which is separated from uncleaved substrate [10], or by measuring the release of a fluorescently-labeled dinucleotide product directly by anisotropy [11-13]. Release from quenching of a fluorescent moiety on the 5′-end, opposite to the processing site has also been used to monitor this activity [14]. Introduction of biotin at the 3′-end of the viral DNA strand that is not processed, was the basis of the first high throughput assay for joining [15]. In this case, the 5′-end of the processed strand was radioactively labeled and the covalently joined products of self-integration were captured, after denaturation, by adherence to avidin-coated wells of a microtiter plate [15], or to streptavidin agarose beads [10]. There have been many variations on this last theme, including assays in which the biotin modified viral DNA is first immobilized on a streptavidin coated surface, and the target DNA is labeled either radioactively [16] or with a chemical moiety (e.g. digoxygenin) that can be detected with an antibody [17]. This type of assay has been employed extensively in high throughput screens for inhibitors of the joining reaction catalyzed by HIV-1 IN [18; see also Chapter 7 of this volume], but it is not optimal for analyzing biochemical/kinetic properties, because the substrates and enzymes cannot interact freely in solution. A microtiter plate [19] and a magnetic bead assay [20], in which products are selected after they are formed in solution, are more suitable for such studies. Finally, fluorescence resonance energy transfer (FRET) from donor to acceptor fluorophores incorporated into oligodeoxynucleotide substrates has been used to measure processing and joining [21], IN-mediated fraying of viral DNA ends (R.A. Katz, unpublished observations), and their positioning an IN-DNA complex [22]. Certain fairly expensive FRET reporters with a long half life [21] have the advantage that they can be detected in the presence of inhibitor compounds that have an intrinsic fluorescence of their own, which can interfere with conventional fluorescent reporter detection in high throughput screening assays. While not within the scope of this chapter, assays based on long oligo or plasmid-derived substrates that measure the concerted integration of two viral DNA ends into a target DNA have also been described [23-25, 26; see Chapter 5, this volume].
As a practical alternative that circumvents both the need for electrophoresis and the use of radioactivity, we have come to rely on a suite of fluorescence assays that are especially convenient for routine laboratory analysis of DNA binding, processing, and joining by IN proteins. An obvious advantage of the fluorescence-base assays is that the substrates have long shelf lives. These solution assays are very sensitive, and suitable for kinetic studies. Furthermore, numerous samples can be analyzed in a fraction of the time required for the gel assays. To measure the DNA binding and processing activities, we have adopted the fluorescence anisotropy methods described and validated by Deprez and coworkers [11-13]. For measuring joining activity we provide our standard protocol for a new assay that builds upon some of the modifications described above and a previously described selection strategy [27]. This joining assay combines the use of biotin to isolate products and fluorescence for detection; a more extensive description of the assay and its validation will be reported separately (Andrake et al., in preparation). Our standard protocols for measuring HIV IN activities using these assay, as well as some typical results, follow.
2. Fluorescence anisotropy assays for DNA binding and processing
These assays for DNA binding and processing depend on measuring changes in anisotropy of a fluorescent probe that is covalently attached to the viral (donor) oligodeoxyribonucleotide (hereafter abbreviated as oligo). In the recording instrument, the fluorescent probe is excited by and also emits polarized light. Because the molecules are tumbling in solution, the emitted light can be depolarized. The extent of depolarization depends on the rate of tumbling of the molecule, which decreases with increasing size. The fluorescent polarization assays rely on an instrument′s capacity to record fluorescent emissions from a given fluorochrome at perpendicular angles measured in short time intervals. The difference in fluorescence intensity between the two planes is used to calculate the parameter anisotropy (r), which is directly proportional to the size of the fluorochrome bearing molecule.
To monitor DNA binding of IN, the probe may be attached to either end of the donor oligo (see Fig. 2A). Because enzyme binding increases the molecular size of the complex that contains the probe, causing it to tumble more slowly, this reaction can be detected as an increase in anisotropy upon binding of the enzyme.
Fig. 2.
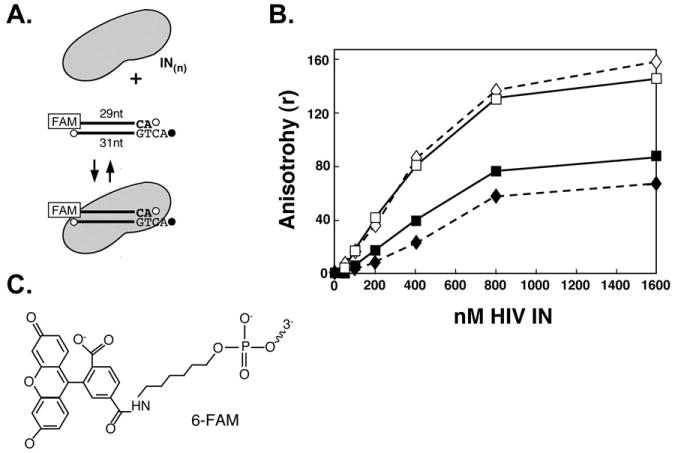
Binding of HIV-1 IN to a 6-FAM-labeled, recessed viral DNA oligo. (A), Illustration of the reaction. (B), Anisotropy measurements. Diamonds (dashed lines) show results with 6-His-tagged IN; solid lines are results with untagged IN. Solid symbols show binding in the presence of MgCl2; open symbols, in the presence of MnCl2. (C), Structure of 6-carbofluorescein (6-FAM). Conjugation occurs through the terminal phosphate.
To assay DNA processing, the probe is attached to the 3′- end of the strand that will be cleaved in the viral duplex oligo. The dead-end product of processing, a fluorescently-labeled dinucleotide, is much smaller than either the viral oligo or the enzyme-DNA complex, and its formation can be detected as a decrease in anisotropy (see Fig. 3A).
Fig. 3.
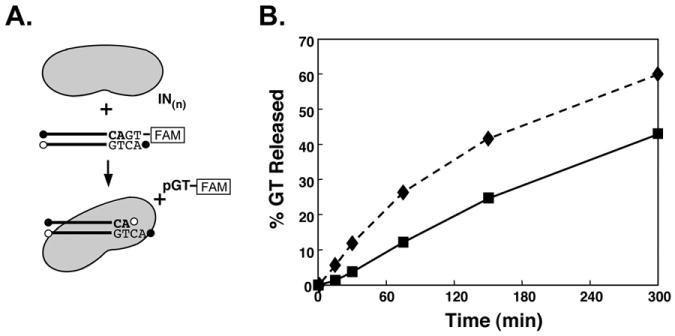
Processing by 6-His-tagged or untagged HIV-1 IN in the presence of MgCl2. (A), Illustration of the reaction. (B), Diamonds (dashed lines) show product released with 6-His-tagged IN, and squares (solid line) with untagged IN.
2.1. General needs/preparation
Integrase preparation
Several methods have been described for purification of bacterially-expressed HIV integrase, with or without a 6-His-Tag [26, 28-30], and for removal of this Tag when desired [28]. The preparations used in the examples provided here, were obtained after expression of either tagged or untagged enzyme, and the proteins were purified from the soluble portion of the bacterial lysates that were adjusted to 1 M NaCl and 1 M Urea [30]. Use of detergents was avoided during purification, as previous reports have noted that this can affect the multimeric state [8] and Mg2+-dependent activity of the enzyme [29].
DNA Substrates
DNA substrates with a covalently attached 6-carboxyflourescein (6-FAM) moiety on either 5′- or 3′-end can be purchased from Integrated DNA Technologies (Coralville, IA). Alternatively, 3′ FAM-labeled oligonucleotides can be synthesized at local facilities using 3′-(6-FAM) CPG (controlled pore glass resin) columns purchased from Glen Research Inc., Sterling, VA. HPLC purification is recommended for all oligos, and gel purification is strongly recommended for 3′-6-FAM-labeled oligos. In addition, the efficiency of labeling should be quantified by absorbance at 260 nm compared to the peak absorbance of the fluorophore (e.g. 495 nm for 6-FAM).
Fluorescence Detection
For data recording and processing we use a Tecan “GENious Pro” microplate plate reader equipped with Magellan Standard V5.03 software (Tecan Austria GmbH, Salzburg, Austria). The machine is set in the fluorescence polarization (FP) mode for binding and processing assays.
Ionic strength
A value ≤ 100 mM NaCl (including contribution from the metal co-factor and salt from the IN storage buffer) is recommended. Higher values will result in reduced activity for HIV-1 IN.
2.2. Protocol 1, DNA binding assay
For a 150-μl assay vol:
0 to 1600 nM IN
50 nM 6-FAM-oligo (e.g. 29 bp duplex)
50 mM HEPES, pH 8.2 (at room temperature)
2 mM β-mercaptoethanol
10 mM MnCl2 or MgCl2
Ionic Strength = 83 mM NaCl equivalent
Order of addition
A reaction mixture containing IN and the metal cofactor is set on ice for 5 min. The 6-FAM-oligo is then added, and the mixture left on ice for an additional 15 min. Samples are read immediately thereafter.
Data acquisition/processing
Assays are made up in the wells of a 96 well plate (Corning PN 3650, black, flat bottomed, non-binding surface) chilled on ice. A buffer blank is necessary as its value is subtracted from the raw fluorescence values before calculation of the anisotropy values. A substrate alone control is also included. Controls must be matched to experimental conditions, particularly for either metal cofactor. A fluorescence polarization reference and blank (Invitrogen, FP One-Step Reference Kit, PN P3088) are also added to wells in the plate for G factor determination. The software calculates anisotropy (r) values from the raw data according to the equation:
where I par is the intensity in the parallel plane and I per in the perpendicular plane.
Fig. 2 shows results from a sample experiment, which compares the DNA binding properties of HIV-1 IN with or without a 6-His-Tag in the presence of either MnCl2 or MgCl2 as co-factor. These data indicate that the viral oligo starts to be limiting at a ratio of enzyme to DNA of about 8:1.
2.3. Protocol 2, 3′-end processing
For a 150-μl assay vol:
200 nM HIV IN
50 nM blunt ended 22 bp viral DNA oligo (6-FAM attached to the 3′-end of the strand that will be cleaved)
5 mM dithiothreitol (DTT)
10% dimethyl sulfoxide (DMSO).
25 mM Tris, pH 8.1 (at 37°C), with 10 mM MnCl2 or
25 mM BisTris, pH 6.5 (at 37°C) with 10 mM MgCl2,
Ionic Strength ≤ 100 mM NaCl equivalent
Order of addition
All ingredients, except the metal cofactors are combined and the mixtures set on ice for 15 minutes. The reaction is started by addition of MnCl2 or MgCl2, vortexing, and immediate incubation in a waterbath at 37 °C.
Data acquisition
After the desired time intervals, the reactions are stopped by addition of sodium dodecyl sulfate (SDS) to a final concentration of 0.26%, which is necessary to dissociate the pGT-6-FAM product from IN. The reactions are transferred to a black, flat bottom, 96 well plate with a non-binding surface (Corning, PN 3650). One control sample contains no IN (for obtaining rNP); a second control sample contains 50 nM of the fluorescently labeled dinucleotide product, pGT-6-FAM (for obtaining rdinuc). A fluorescence polarization reference and blank are also included in separate wells (Invitrogen, FP One-Step Reference Kit, PN P3088) for instrument calibration (G factor determination).
Data Processing
The fraction of dinucleotide released is calculated according to the following formula [11]:
Where
Fdinuc = fraction of dinucleotide (pGT-6-FAM) released
rNP = anisotropy of the 6-FAM-oligo substrate (control without added IN)
rdinuc = anisotropy of pGT-6-FAM (product control)
r = anisotropy of the experimental reaction
Minor changes in assay composition can effect the anisotropy of the controls, rNP & rdinuc. Consequently, each assay condition (including the particular metal co-factor) must have a matching set of controls.
Fig. 3 shows results from a typical experiment with 6-His-tagged or untagged HIV-1 IN with MgCl2 as the co-factor. Data are expressed as the percentage of dinucleotide product released as a function of time.
3. Fluorescence intensity assay for joining
In this assay, 6-FAM is attached to the 3′-end of the stand in the viral oligo that is complementary to the strand that will be joined to the target oligo (Fig. 4A). The viral oligo can have either a blunt or recessed (preprocessed) end. The latter is used to study joining independent of processing. Biotin is attached to both 3′-ends of the target DNA to optimize capture of joined products. In our hands, the optimal ratio of IN:viral oligo:target oligo is 4:1:6.
Fig. 4.
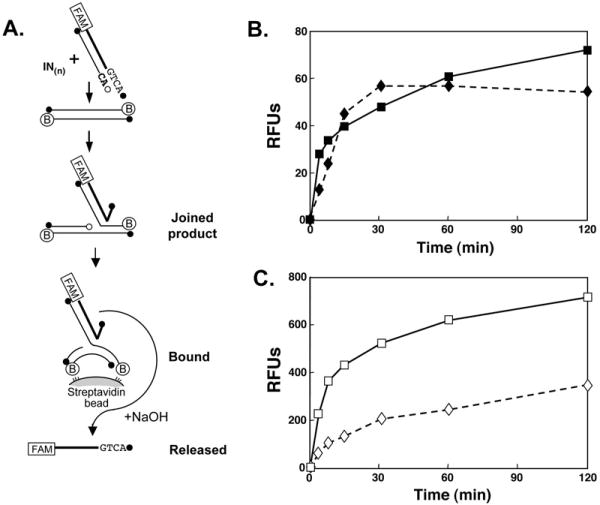
Fluorescent joining assay of 6-His-tagged or untagged HIV-1 IN in the presence of MgCl2 or MnCl2. (A), Illustrates the single end joining assay in which the product is bound to streptavidin-coated beads via the biotin-conjugated target oligo. The bound FAM-labeled viral strand is released upon denaturation by addition of NaOH. The amount of released, FAM-labeled viral strand is then quantified. (B), Joining activity as a function of time in the presence of MgCl2. (C), Joining activity as a function of time in the presence of MnCl2. Note the 10-fold increase in scale compared with (B). In this assay 400 RFU ≃1% joining of viral oligo. Diamonds (dashed lines) represent data points with 6-His-tagged IN; squares (solid lines) with untagged IN.
3.1. Protocol 3, joining
For a 20 μl assay vol:
1 μM IN
0.25 μM 6-FAM-labeled viral oligo (e.g. 26nt/28nt recessed duplex)
1.5 μM Biotin-conjugated target oligo (e.g. 27 bp duplex with single nucleotide overhang on each 3′-end to which biotin is attached).
5 mM DTT
10% DMSO
25 mM Hepes, pH 7.5 (at 37 °C) with 10 MnCl2 or
25 mM BisTris pH 6.5 (at 37 °C) with 10 MgCl2
Ionic Strength ≤ 100 mM NaCl equivalent
Order of Addition
The 6-FAM-viral oligo is mixed with IN and the metal cofactor in the indicated buffer. This mixture is left on ice for 15 min. The Biotin-conjugated target oligo is added, and the mixture left at on ice for an additional 15 min, after which it is transferred to a waterbath at 37 °C (or another selected temperature) to incubate for the desired period. The reaction is then stopped by the addition of 10 μl of 30 mM EDTA.
Product capture
A 96 well filter plate (Pall Life Sciences; AcroPrep 96 filter plate, 0.45 μm GHP membrane, 350 μl/well, PN 5030) is prepared for use by adding 50 μl of a 1:1 slurry of streptavidin agarose beads to each well (Invitrogen; streptavidin agarose, sedimented bead suspension, PN S951). Assay reactions are transferred to the wells, and incubated at room temperature for 30 min to allow the Biotin-conjugated target and joined products to bind to the beads. The wells are then washed 10 times with 200 μl Wash Buffer (1X PBS, 0.05% SDS, 1 mM EDTA) using a vacuum manifold (Pall Life Sciences; Multi-well Plate Vacuum manifold, PN5017). The last wash can also be collected by centrifugation into a reader plate to confirm that all of the unbound, unjoined FAM-labeled viral oligo has been removed.
Probe release
The viral oligo strand that includes the 6-FAM probe is dissociated from the bound product by denaturation via addition of 150 μl of freshly prepared 50 mM NaOH to each well. The plate is then left at room temperature for 5 min. The soluble fractions are collected by centrifugation (2K × g/10 min) into a black, round bottom 96 well plate (Costar, storage plate, PN 3356).
Data acquisition
Wells are read using the Tecan GENois pro fluorescent plate reader set to the fluorescence intensity mode. Typical substrates and results from an assay of the joining activity of 6-His-tagged and untagged HIV-1 IN in the presence of MnCl2 and MgCl2 are shown in Fig. 4. The data from the plate scanner are expressed as relative fluorescence units (RFUs). To convert these values to percent joining, one can derive a calibration plot of RFUs/pmole 6-FAM-oligo and then compare the values obtained for product in this assay with the total input/well.
4. Discussion
Biochemical and structural analysis of integrase proteins requires the preparation and routine characterization of enzyme under various conditions, from various sources, and with numerous combinations of amino acid substitutions and modifications. Assays for the major activities, DNA binding, viral end processing, and joining to target DNA, have been performed in many laboratories by using radioactively labeled oligos and gel assays. However, such assays are labor intensive, slow, and relatively insensitive, especially for measuring joining.
The suite of fluorescent assays described here can readily handle large numbers of samples, do not require radioactive oligos with limited half-life, are much faster, and equally or more sensitive than the gel assays. The sensitivity is best illustrated in the time-dependent measurement of joining by HIV-1 IN in the presence of MgCl2 (Fig. 4 B), an activity that can be difficult to detect in a typical gel assay, especially at early times, due to the heterogeneous size of the single-stranded products.
In the protocols presented here, conditions for measuring HIV-1 IN activities have been optimized. The relatively high concentrations of enzyme called for in the processing (200 nM) and joining (1 μM) assays are likely to facilitate the multimerization required for optimal enzymatic activities. The concentration of viral oligo substrate in these assays comprise a ratio of enzyme to substrate close to that expected from a variety of previous studies [31-33]. By use of a Ymer substrate (Fig. 1B.3.) with a short viral DNA component [34, 35], the fluorescense anisotrophy assay could also be adapted to monitor disintegration activity. Finally, all of the protocols described here can be adapted for moderate to high throughput screening of potential IN inhibitors, provided that the compounds to be tested do not absorb strongly in wavelengths that overlap with the probes and do not emit competing fluorescence. Weak to moderately fluorescent compounds can be tested by applying a correction curve to the data.
Acknowledgments
This work was supported by National Institutes of Health grants CA071515, AI040385, Institutional grant CA006927 from the National Institutes of Health, and also by an appropriation from the Commonwealth of Pennsylvania. We acknowledge Glenn Miller and the Fox Chase Cancer Center DNA Synthesis Facility for oligo substrate preparations, Dr. Richard Katz for fruitful discussions and review of the manuscript, and Marie Estes for its skillful preparation. The contents of this manuscript are solely the responsibility of the authors and do not necessarily represent the official views of the National Cancer Institute, or any other sponsoring organization.
Footnotes
Publisher's Disclaimer: This is a PDF file of an unedited manuscript that has been accepted for publication. As a service to our customers we are providing this early version of the manuscript. The manuscript will undergo copyediting, typesetting, and review of the resulting proof before it is published in its final citable form. Please note that during the production process errors may be discovered which could affect the content, and all legal disclaimers that apply to the journal pertain.
References
- 1.Skalka AM, Katz RA. Cell Death Diff. 2005;12:971–978. doi: 10.1038/sj.cdd.4401573. [DOI] [PubMed] [Google Scholar]
- 2.Katzman M, Katz RA, Skalka AM, Leis J. J Virol. 1989;12:5319–5327. doi: 10.1128/jvi.63.12.5319-5327.1989. [DOI] [PMC free article] [PubMed] [Google Scholar]
- 3.Katz RA, Merkel G, Kulkosky J, Leis J, Skalka AM. Cell. 1990;63:87–95. doi: 10.1016/0092-8674(90)90290-u. [DOI] [PubMed] [Google Scholar]
- 4.Craigie R, Fujiwara T, Bushman F. Cell. 1990;62:829–837. doi: 10.1016/0092-8674(90)90126-y. [DOI] [PubMed] [Google Scholar]
- 5.Chow SA. Methods. 1997;12:306–317. doi: 10.1006/meth.1997.0484. [DOI] [PubMed] [Google Scholar]
- 6.Marchand C, Neamati N, Pommier Y. Methods Enzymol. 2001;340:624–633. doi: 10.1016/s0076-6879(01)40446-0. [DOI] [PubMed] [Google Scholar]
- 7.Yi J, Asante-Appiah E, Skalka AM. Biochemistry. 1999;38:8458–8468. doi: 10.1021/bi982870n. [DOI] [PubMed] [Google Scholar]
- 8.Deprez E, Tauc P, Leh H, Mouscadet JF, Auclair C, Brochon JC. Biochemistry. 2000;39:9275–9284. doi: 10.1021/bi000397j. [DOI] [PubMed] [Google Scholar]
- 9.Deprez E, Tauc P, Leh H, Mouscadet JF, Auclair C, Hawkins ME, Brochon JC. Proc Natl Acad Sci U S A. 2001;98:10090–10095. doi: 10.1073/pnas.181024498. [DOI] [PMC free article] [PubMed] [Google Scholar]
- 10.Müller B, Jones KS, Merkel GW, Skalka AM. Proc Natl Acad Sci U S A. 1993;90:11633–11637. doi: 10.1073/pnas.90.24.11633. [DOI] [PMC free article] [PubMed] [Google Scholar]
- 11.Guiot E, Carayon K, Delelis O, Simon F, Tauc P, Zubin E, Gottikh M, Mouscadet JF, Brochon JC, Deprez E. J Biol Chem. 2006;281:22707–22719. doi: 10.1074/jbc.M602198200. [DOI] [PubMed] [Google Scholar]
- 12.Smolov M, Gottikh M, Tashlitskii V, Korolev S, Demidyuk I, Brochon JC, Mouscadet JF, Deprez E. FEBS J. 2006;273:1137–1151. doi: 10.1111/j.1742-4658.2006.05139.x. [DOI] [PubMed] [Google Scholar]
- 13.Hawkins ME, Pfleiderer W, Mazumder A, Pommier YG, Balis FM. Nucleic Acids Res. 1995;23:2872–2880. doi: 10.1093/nar/23.15.2872. [DOI] [PMC free article] [PubMed] [Google Scholar]
- 14.He HQ, Ma XH, Liu B, Zhang XY, Chen WZ, Wang CX, Cheng SH. Acta Pharmacol Sin. 2007;28:11–817. doi: 10.1111/j.1745-7254.2007.00561.x. [DOI] [PubMed] [Google Scholar]
- 15.Craigie R, Mizuuchi K, Bushman FD, Engelman A. Nucleic Acids Res. 1991;19:2729–2734. doi: 10.1093/nar/19.10.2729. [DOI] [PMC free article] [PubMed] [Google Scholar]
- 16.Hazuda DJ, Hastings JC, Wolfe AL, Emini EA. Nucleic Acids Res. 1994;22:1121–1122. doi: 10.1093/nar/22.6.1121. [DOI] [PMC free article] [PubMed] [Google Scholar]
- 17.John S, Fletcher TM, 3rd, Jonsson CB. J Biomol Screen. 2005;10:606–614. doi: 10.1177/1087057105276318. [DOI] [PubMed] [Google Scholar]
- 18.Hazuda DJ, Felock P, Witmer M, Wolfe A, Stillmock K, Grobler JA, Espeseth A, Gabryelski L, Schleif W, Blau C, Miller MD. Science. 2000;287:646–650. doi: 10.1126/science.287.5453.646. [DOI] [PubMed] [Google Scholar]
- 19.Hwang Y, Rhodes D, Bushman F. Nucleic Acids Res. 2000;28:4884–4892. doi: 10.1093/nar/28.24.4884. [DOI] [PMC free article] [PubMed] [Google Scholar]
- 20.He HQ, Ma XH, Liu B, Chen WZ, Wang CX, Cheng SH. Acta Pharmacol Sin. 2008;29:397–404. doi: 10.1111/j.1745-7254.2008.00748.x. [DOI] [PubMed] [Google Scholar]
- 21.Wang Y, Klock H, Yin H, Wolff K, Bieza K, Niswonger K, Matzen J, Gunderson D, Hale J, Lesley S, Kuhen K, Caldwell J, Brinker A. J Biomol Screen. 2005;10:456–462. doi: 10.1177/1087057105275212. [DOI] [PubMed] [Google Scholar]
- 22.Bera S, Vora AC, Chiu R, Heyduk T, Grandgenett DP. Biochemistry. 2005;44:15106–15114. doi: 10.1021/bi0508340. [DOI] [PubMed] [Google Scholar]
- 23.Aiyar A, Hindmarsh P, Skalka AM, Leis J. J Virol. 1996;70:3571–3580. doi: 10.1128/jvi.70.6.3571-3580.1996. [DOI] [PMC free article] [PubMed] [Google Scholar]
- 24.Li M, Craigie R. J Biol Chem. 2005;280:29334–29339. doi: 10.1074/jbc.M505367200. [DOI] [PMC free article] [PubMed] [Google Scholar]
- 25.Sinha S, Grandgenett DP. J Virol. 2005;79:8208–8216. doi: 10.1128/JVI.79.13.8208-8216.2005. [DOI] [PMC free article] [PubMed] [Google Scholar]
- 26.Sinha S, Pursley MH, Grandgenett DP. J Virol. 2002;76:3105–3113. doi: 10.1128/JVI.76.7.3105-3113.2002. [DOI] [PMC free article] [PubMed] [Google Scholar]
- 27.Landgraf A, Reckmann B, Pingoud A. Anal Biochem. 1991;193:231–235. doi: 10.1016/0003-2697(91)90014-k. [DOI] [PubMed] [Google Scholar]
- 28.Jenkins TM, Engelman A, Ghirlando R, Craigie R. J Biol Chem. 1996;271:7712–7718. doi: 10.1074/jbc.271.13.7712. [DOI] [PubMed] [Google Scholar]
- 29.Leh H, Brodin P, Bischerour J, Deprez E, Tauc P, Brochon JC, LeCam E, Coulaud D, Auclair C, Mouscadet JF. Biochemistry. 2000;39:9285–9294. doi: 10.1021/bi000398b. [DOI] [PubMed] [Google Scholar]
- 30.Taganov KD, Cuesta I, Daniel R, Cirillo LA, Katz RA, Zaret KS, Skalka AM. J Virol. 2004;78:5848–5855. doi: 10.1128/JVI.78.11.5848-5855.2004. [DOI] [PMC free article] [PubMed] [Google Scholar]
- 31.Bao KK, Wang H, Miller JK, Erie DA, Skalka AM, Wong I. J Biol Chem. 2003;278:1323–1327. doi: 10.1074/jbc.C200550200. [DOI] [PubMed] [Google Scholar]
- 32.Faure A, Calmels C, Desjobert C, Castroviejo M, Caumont-Sarcos A, Tarrago-Litvak L, Litvak S, Parissi V. Nucleic Acids Res. 2005;33:977–986. doi: 10.1093/nar/gki241. [DOI] [PMC free article] [PubMed] [Google Scholar]
- 33.Li M, Mizuuchi M, Burke TR, Jr, Craigie R. EMBO J. 2006;25:1295–1304. doi: 10.1038/sj.emboj.7601005. [DOI] [PMC free article] [PubMed] [Google Scholar]
- 34.Chow SA, Vincent KA, Ellison V, Brown PO. Science. 1992;255:723–736. doi: 10.1126/science.1738845. [DOI] [PubMed] [Google Scholar]
- 35.Kulkosky J, Jones KS, Katz RA, Mack JP, Skalka AM. Mol Cell Biol. 1992;12:l2331–2338. doi: 10.1128/mcb.12.5.2331. [DOI] [PMC free article] [PubMed] [Google Scholar]