Abstract
The Case cryo-imaging system is a section and image system which allows one to acquire micron-scale, information rich, whole mouse color bright field and molecular fluorescence images of an entire mouse. Cryo-imaging is used in a variety of applications, including mouse and embryo anatomical phenotyping, drug delivery, imaging agents, metastastic cancer, stem cells, and very high resolution vascular imaging, among many. Cryo-imaging fills the gap between whole animal in vivo imaging and histology, allowing one to image a mouse along the continuum from the mouse → organ → tissue structure → cell → sub-cellular domains. In this overview, we describe the technology and a variety of exciting applications. Enhancements to the system now enable tiled acquisition of high resolution images to cover an entire mouse. High resolution fluorescence imaging, aided by a novel subtraction processing algorithm to remove sub-surface fluorescence, makes it possible to detect fluorescently-labeled single cells. Multi-modality experiments in Magnetic Resonance Imaging and Cryo-imaging of a whole mouse demonstrate superior resolution of cryo-images and efficiency of registration techniques. The 3D results demonstrate the novel true-color volume visualization tools we have developed and the inherent advantage of cryo-imaging in providing unlimited depth of field and spatial resolution. The recent results continue to demonstrate the value cryo-imaging provides in the field of small animal imaging research.
Keywords: small animal imaging, block-face imaging, cryosection, brightfield microscopy, fluorescence microscopy
1. INTRODUCTION
There is a significant interest in imaging of small animals, particularly mice since the genetic manipulation of mice is an extraordinary tool in modern biology. What started more than a century ago1 have since become indispensable to researchers and a huge number of genetic modifications are being continually made, using a variety of techniques 2,3. In parallel, imaging techniques are being developed targeted specifically to the small animal. Techniques include MRI, PET, SPECT, CT, in vivo fluorescence, in vivo bioluminescence, and intravital imaging 4-9. All these imaging modalities and techniques offer advantages and disadvantages and have limitations in resolution, contrast mechanism or the depth of view they provide.
We have been developing a new imaging system based on a mouse sized cryostat and a microscope imaging system. The Case cryo-imaging system alternately sections and images the block-face and is capable of producing ultrahigh resolution color block-face images with superior morphological details. A base version of the system had produced encouraging results 10,11. An improved version now provides a unique combination of field of view, depth of field, high resolution over a large field of view through tiled acquisition as well as color/fluorescence contrast. Unlike every other imaging technique, cryo-imaging allows to image an entire mouse at micron order resolution and detect fluorescently tagged single cells.
The most famous episcopic imaging of block-face project historically had been the visible human projects in the USA and elsewhere 12-17. These projects have provided extraordinary new information about human anatomy, and data have been used for a variety of applications. There have also been reports of episcopic block-face imaging of small animals and organs 18-26. There are also research papers on 3D reconstruction from serial histology sections 27-29 for a variety of biomedical applications 30-34. However, histology sections are associated with tears, tissue shrinkage, and errors in image alignment. There exist section-and-image systems for small samples 20,22. However such systems work on fixed specimens and rely only on autofluorescence of tissue. Other systems include Surface Imaging Microscopy (SIM) 21 which provide block-face images of fluorescently labeled, fixed and polymer embedded samples. Tsai et al. created an innovative block face imaging system whereby lasers ablate fixed tissue from the block face 35. The Case cryo-imaging system can accommodate samples as large as whole mouse, does not suffer from the limitations of histological sections and in the new design allows detection of fluorescently tagged cells by imaging the entire mouse.
In the next section we describe the new system and an overview of the methods used to embed, section and image a specimen. In subsequent sections we present images acquired in various experiments and the various image processing and volume visualization results.
2. CRYO-IMAGING SYSTEM & METHODS
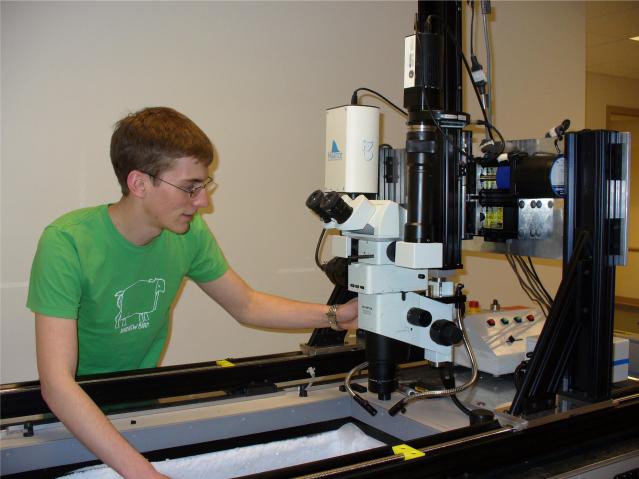
The present system consists of a cryomicrotome, the imaging system, a robotic xyz positioner and the computer control system. Following acquisition of cryo-image volumes, the Image Processing and Visualization system is used for analysis of data. The cryomicrotome is a large section whole body cryostat which has been mechanically modified for access to the block-face by the robotic positioner and electrically modified to interface to the computer control system. The imaging system consists of a stereomicroscope, low noise camera for fluorescence and brightfield imaging, illumination sources and interchangeable optical filters to image fluorophores such as GFP, RFP etc. The camera is connected to the camera/video port of the microscope and interfaced to the control computer. The microscope/camera assembly is mounted on a xyz linear actuator system for moving the imaging system into the cryostat chamber and for moving around the sample. A custom application program has been developed which controls the cryostat, the robotic positioner, the illuminators and the camera for a fully automated sectioning and imaging session. The imaging protocol can be setup to acquire tiled images across a region, thus providing final stitched images with mouse-sized field of view and pixel sizes ≈2μm.
Before the cryo-imaging session, animals are euthanized in a method approved by Case Animal Resource Center (ARC) which consists of either inhalation of Carbon dioxide delivered from tank or anesthetization using an agent such as pentobarbital, at a dose prescribed by the Case ARC. Different experiments are covered under various IACUC-approved projects. Once the mice are euthanized, they are generously covered with the cryo-embedding compound Optimal Cutting Temperature (OCT) solution (Tissue-Tek, Terrance, CA) so that no air bubbles are formed by the air trapped between the skin and fur. A mould is made to size with aluminum foil and the mouse is then embedded in OCT. The mould is covered with another layer of aluminum foil and then snap-frozen in liquid nitrogen. After this, mould assembly is removed from liquid nitrogen bath and placed inside the cryostat chamber for equalizing the specimen temperature to the cryostat temperature. Then, in a few hours time, the mould is removed and the frozen specimen is mounted on the microtome stage using more OCT as a base. After initial “facing” (continuous slicing at maximum thickness to reach animal proper), the desired slice thickness (typically 10 μm for fine z-spacing) is set. The imaging system is readied and lowered inside the chamber, the region of interest is digitally marked by moving the imaging system around with the robotic positioner, the imaging modes (brightfield, fluorescence or a combination) are set and the number of sections is set. Once triggered the system then alternately sections and images per the chosen protocol and runs the sequence without requiring any operator intervention.
After the 2D images are acquired on the imaging workstation, the data is transferred to a high-end workstation. Cry-image volumes tend to be large and a high-resolution brightfield and fluorescence volume of an entire mouse can result in a data size of over 100 gigabytes. We employ a 32GB RAM, quad-processor Windows 64-bit PC system to perform image processing, analysis and visualization. We have developed customized Matlab (Mathworks Inc., Natick, MA) programs and AMIRA (Mercury Computer Systems, San Diego, CA) scripts for our specific needs. Processing steps include illumination intensity compensation, fine image alignment, optional stitching, removal of subsurface image signal, and image interpolation to create isotropically distributed samples. The 3D image data sets can be resliced using multi-planar reformatting techniques. Structures of interest can be manually or semi-automatically segmented. A multitude of volume visualization techniques developed by us are then applied to visualize the 3D datasets.
3. RESULTS
The biological experiments using cryo-imaging include anatomical imaging of wild type mice, detection of injected labeled cells using brightfield and fluorescence imaging, registration with MRI and imaging of small samples such as an embryo. While the 2D images in itself provide extraordinary details, the subsequent 3D reconstruction provide additional information as detailed in example images in Figures 1-7. In Figure 1 we show a high resolution wide field of view coronal image of a WT mouse and which shows the anatomy in exquisite detail. We can clearly identify all major organs such as the heart, liver, lung, gastro-intestinal system and even muscles such as the rectus muscles of the eye from the low resolution image. The high resolution insets show details of the intestinal villi, cardiac vessels, nasal septum etc. The mouse data volume consists of 662 sections, with each section image being composed of 20 tiles for a native in-plane resolution of 15.6 μm. A staggering 55GB data volume is thus produced. The improved Case cryo-imaging setup is shown in Figure 2 with the various hardware components.
Figure 1.
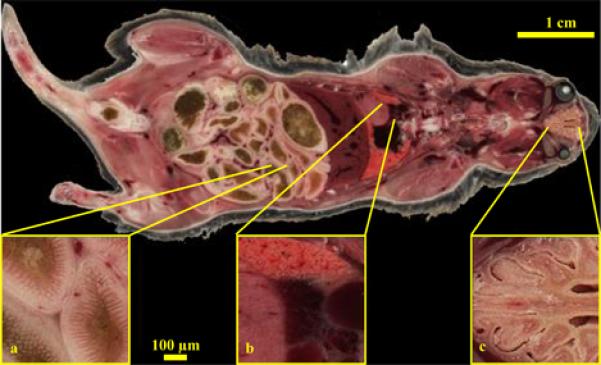
High resolution Cryo-image of a male wild type mouse. A whole mouse was embedded and sectioned and a tiled image acquisition scheme was employed. Each block-face image was composed of 20 tiled images. The low resolution whole image shows all the major organs with remarkable detail like the hepatic vessels of the liver, rectus muscles of the eye, muscle architecture etc. while the high resolution insets show selected areas like the villi of the intestines (a), heart, lung and cardiac vessel architectures (b) and the folds of the nasal septum (c).
Figure 7.
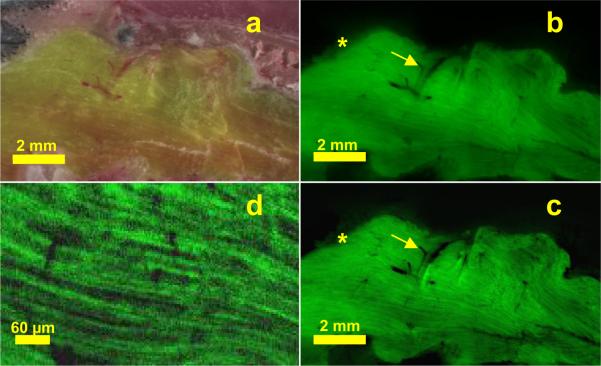
GFP labeled mouse skeletal muscle, bright field (a), and original (b) and subtraction processed (c) fluorescence cryo-images. In the subtracted image (c), fibers are made apparent due to the removal of subsurface fluorescence. The “halo effect,” has been removed (*), and blood vessels (arrows) have been clarified with removal of subsurface fluorescence. A magnified view of muscle fibers (d) gives single fiber diameter ≈ 10 μm and clearly shows fiber orientation.
Figure 2.
The present cryo-imaging system. The imaging system comprising of a stereo microscope and digital camera is maneuvered through a xyz robotic positioner. The system is lowered inside the cryo-chamber and positioned above the blockface with the lens parallel to the tissue slicing plane. An imaging workstation computer is interfaced to the cryostat, robotic positioner, illuminators and the camera. Once positioned over the mouse/tissue sample and after imaging protocols are set, the system then automatically goes through a section-and-image sequence without further operator interaction. Both brightfield and fluorescence images in any combination can be captured.
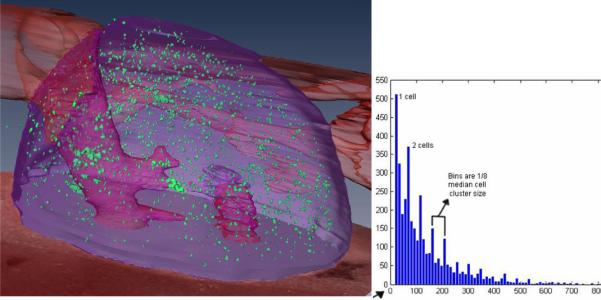
In Fig 3, we show results of an experiment using GFP-labeled Lewis Lung Carcinoma (LLC) cancer cells, a cell line used for studies of metastatic cancer and therapies. We made tail vein injections of ≈5 million LLC cells and after seven days post injection, cryo-imaging surveys identified cells in the liver, adrenal gland, and tail near the injection site. Most cells were in the adrenal gland. A histogram of cluster size showed peaks at integer numbers of the nominal cell size of 8.4 μm diameter, indicating an ability to count cells within tissue.
Figure 3.
Cryo-imaging detects even single cells, as shown in this experiment with GFP-labeled Lewis Lung Carcinoma cancer cells. 7 days after tail vein injection, 3850 fluorescent cell aggregates were found in the adrenal gland. This fused 3D rendering combines volume rendering of fluorescent cells with surface rendering of the adrenal gland (purple) and artery (red). Image data were pre-processed to remove sub-surface fluorescence. A histogram of cluster size (right) shows peaks at integer numbers of the nominal cell size of 8.4 μm, indicating an ability to count cells within tissue.
Figure 4 shows results from multi-modal registration of Magnetic Resonance and Cryo-Image of a whole mouse. In this demonstration study, we imaged mice in a special immobilization chamber with MRI (200 μm)3 and cryo-imaging (40 μm)3. We registered data using a normalized mutual information algorithm, followed by non-rigid transformations to account for subtle misalignments, due mostly to small head movements. Registration efficacy was qualitatively confirmed using visual overlays from cryo and MRI data. A sliding window overlay between 2D slices from cryo and MRI images showed almost exact overlap after registration.
Figure 4.
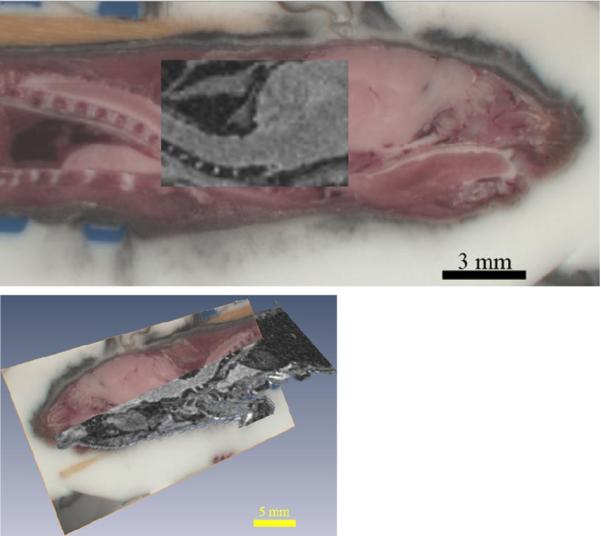
Normalized Mutual Information was used to register the RGB cryo-image volume of a WT mouse to MRI data of the same mouse from a 9.4T scanner. 2D slices from the two data sets are overlaid on top of each other to show the efficacy of registration. The top image also shows the orientation and spacing of the vertebrae in the cryo image while the corresponding registered MRI image lacks such detail.
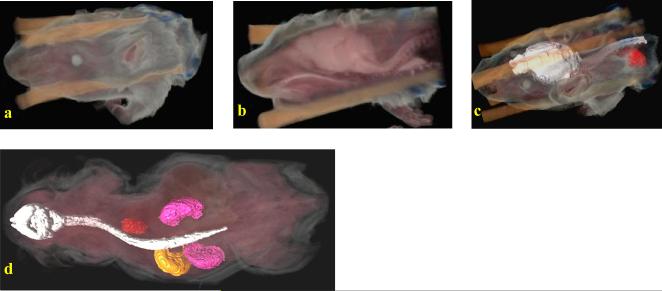
The Case cryo-imaging system allows us to image whole mouse as well as small samples such as embryos. In Figure 5(a), we show a 3D volume rendering of mouse embryo data that uses natural colors but sets the rendered voxel opacity to be the inverse of the grayscale value (i.e. 255 – g, where g is the grayscale value) at each point within the volume. Figure 5(b) shows a multiplanar reformatting algorithm applied to the 3D dataset to extract 2D image data on an oblique plane which is then superimposed on a cutaway volume rendering. However, this basic volume rendering approach does not enhance boundaries or enable one to look at internal structures in more detail. We have developed a novel volume visualization method that computes 3D gradients directly from color data and uses these gradients to determine voxel opacities to be used during rendering. This enables us to visualize boundaries between structures with different color properties. Figure 5(c) shows a volume rendering obtained using this approach. Channel-specific enhancements can be applied in addition to the color gradient-based enhancement. Figure 5(d) shows a volume rendering obtained by applying a red channel enhancement (over and above the color gradient enhancement) to highlight the liver and umbilical cord. In Figure 6(a), the baseline volume rendering approach discussed above has been applied on an adult mouse dataset with Figure 6(b) showing a cutaway view, this time using a sagittal cutting plane. Internal organs are very clearly visible from this cutaway view. Sometimes, all details regarding the internal structure cannot be perceived using a volume rendering approach alone. A semi-automatic method for segmenting out organs of interest within the mouse was employed in Figure 6(c). This used a region growing method in 3D that utilized user-specified tolerances to grow a region around a user-chosen seed point. The brain and spinal cord (white), along with the heart (red) were segmented, converted into surface models and rendered as surfaces that were fused with the original true color volume rendering. In Figure 6(d), a similar fused volume visualization involving surface and volume rendering has been shown with a whole body mouse dataset. The organs of interest were the kidneys (pink), stomach (yellow), heart (red), and brain and spinal cord (white).
Figure 5.
Advanced volume rendering techniques for mouse embryo data from our cryo-imaging system. The embryo was stained blue with β-gal where a β-gal sensitive reporter gene was expressed. The volume rendering in (a) shows the baseline technique where natural colors are used for the voxels but the opacity is set equal to (255 – g) where g is the grayscale value derived from the color data at each voxel. In (b), we show 2D image data from an oblique plane overlaid on the cutaway 3D volume. (c) shows a novel technique that computes gradients from color data directly to determine the voxel opacity resulting in an enhanced volume visualization. Finally, (d) shows a red-channel enhancement performed on the volume shown in figure (c), thereby enabling one to see the liver and umbilical cord which both have significant red content
Figure 6.
3D volume renderings of adult mice. In (a), a true color rendering of the partial volume is shown. (b) shows a cutaway view using a sagittal cutting plane revealing details of internal organs. In (c), a semi-automatic segmentation algorithm was employed on the 3D volume to label the brain and spinal cord (white) and heart (red) following which surface renderings were generated and fused with the original volume rendering. In (d), a whole body adult mouse with surface renderings of both kidneys (pink), stomach (yellow), heart (red), brain and spinal cord (white) is shown fused with a volume rendering obtained from the original data.
In Figure 7, we demonstrate brightfield and fluorescence cryo-image and the necessity of subtraction processing. GFP-labeled skeletal muscles of a transgenic mouse exhibit sub-surface fluorescence in the fluorescence image. We have developed a novel subtraction processing algorithm which removes such sub-surface fluorescence enabling one to see fiber orientation and single fibers.
4. DISCUSSION AND CONCLUSION
Even on a first generation basic setup we had demonstrated 10,11 how cryo-imaging provides a combination of field of view, depth of field, resolution and color and fluorescence contrast mechanisms not possible with in-vivo imaging or with traditional ex-vivo microscope imaging approaches. Our enhanced system not only provides high resolution tiled brightfield anatomical images but also high resolution fluorescent images to enable detection of bright single cells. For example, the LLC cell injection experiment demonstrates the capability of detecting bright single cells when imaged at high resolution. The multi-modality experiment involving MRI and cryo-imaging demonstrate that registration accuracy is sufficient to enable the use of cryo-images to aid interpretation of conventional mouse images. Bright field cryo-images reveal many fine anatomical features unavailable in the co-registered MRI data, including small blood vessels, muscle fiber orientation, cardiac morphology, and differentiation of fat types.
Much of the enhancements in the system include the development of custom software. The automated sectioning and imaging software allows high resolution, tiled acquisition of images – both brightfield and fluorescence without involving any operator interaction once the protocol is set and imaging sequence is started. Likewise, we have developed new post-processing and visualization techniques. We have found that bright subsurface fluorescence from a depth up to ≈ 120 μm in transparent tissues can have a contribution to the block face image. This results in subsurface fluorescent structures being visible for multiple slices, which in turn leads to artifacts in 3D reconstruction, error in quantifying cell numbers, etc. For example a single fluorescent bead can be seen across multiple slices, essentially elongating the object in 3D. In order to accurately reconstruct/measure a volume or locate a feature of interest in 3D, it is necessary to remove these subsurface structures. Subtraction processing is an image processing method for removing subsurface fluorescence so as to create images containing the fluorescence from a single tissue slice. Subtraction processing removes subsurface fluorescence by modeling the attenuation and scattering of emitted fluorescent photons as they travel to the block face. Because different tissue types have different optical properties, tissues must be characterized prior to performing subtraction processing. Using subtraction processing, the GFP skeletal muscles are visible down to single fibers.
Cryo-imaging also provides us with the unique opportunity to exploit color data at each point within a 3D volume. Along with simple volume visualization schemes using natural color and inverse grayscale opacity map, we have also developed gradient based opacity maps that enhance boundaries and channel-specific enhancements for a variety of visualization schemes. These techniques enable one to clearly see individually segmented organs within a 3D anatomical context.
We have presented new enhancements to our baseline Case cryo-imaging system for creating block-face cryo-image volume of small animals and excised organs and demonstrated example images from a variety of applications. This novel imaging system has advantages of resolution, contrast and depth of field and along with the plethora of other tools available to researchers in small animal imaging, would continue to provide a new insight into disease and cure..
ACKNOWLEDGMENT
We acknowledge our collaborators for their valuable inputs and many of the specimens. The wild type mouse used to produce Figure 1 was provided by P. Hakimi (Department of Biochemistry, Case Western Reserve University), the LLC cells (Figure 3) provided by Dr. H. von Recum (Department of Biomedical Engineering, Case Western Reserve University) and the embryo images (Figure 5) obtained with Dr. R. Atit (Department of Biology, Case Western Reserve University). This investigation was conducted in a facility constructed with support from Research Facilities Improvement Program Grant Number C06 RR12463-01 from the National Center for Research Resources, National Institutes of Health. This research is supported by the Ohio Wright Center of Innovation and Biomedical Research and Technology Transfer award: “The Biomedical Structure, Functional and Molecular Imaging Enterprise,” NIH R41HL084822-01, and The Center for Stem Cell and Regenerative Medicine. Dr. Wilson has an interest in a start-up company, BioInVision, Inc., which intends to commercialize cryo-imaging technology.
REFERENCES
- 1.Morse HC., III . The laboratory mouse--A historical perspective. In: Foster HL, Small JD, Fox JG, editors. The mouse in biomedical research, Vol. I: history, genetics, and wild mice. Academic Press; NY: 1981. pp. 1–16. [Google Scholar]
- 2.Bedell MA, Largaespada DA, Jenkins NA, Copeland NG. Mouse models of human disease. Part II: recent progress and future directions. Genes Dev. 1997 Jan 1;11:11–43. doi: 10.1101/gad.11.1.11. [DOI] [PubMed] [Google Scholar]
- 3.Bedell MA, Jenkins NA, Copeland NG. Mouse models of human disease. Part I: techniques and resources for genetic analysis in mice. Genes Dev. 1997 Jan 1;11:1–10. doi: 10.1101/gad.11.1.1. [DOI] [PubMed] [Google Scholar]
- 4.Massoud TF, Gambhir SS. Molecular imaging in living subjects: seeing fundamental biological processes in a new light. Genes Dev. 2003 Mar 1;17:545–580. doi: 10.1101/gad.1047403. [DOI] [PubMed] [Google Scholar]
- 5.Cherry SR, Gambhir SS. Use of positron emission tomography in animal research. ILAR.J. 2001;42:219–232. doi: 10.1093/ilar.42.3.219. [DOI] [PubMed] [Google Scholar]
- 6.Chatziioannou AF. Molecular imaging of small animals with dedicated PET tomographs. Eur.J.Nucl.Med.Mol.Imaging. 2002 Jan;29:98–114. doi: 10.1007/s00259-001-0683-3. [DOI] [PubMed] [Google Scholar]
- 7.Weissleder R, Mahmood U. Molecular imaging. Radiology. 2001 May;219:316–333. doi: 10.1148/radiology.219.2.r01ma19316. [DOI] [PubMed] [Google Scholar]
- 8.Weissleder R. Scaling down imaging: molecular mapping of cancer in mice. Nat.Rev.Cancer. 2002 Jan;2:11–18. doi: 10.1038/nrc701. [DOI] [PubMed] [Google Scholar]
- 9.Weissleder R, Mahmood U. Molecular imaging,”. Radiology. 2001 May;219:316–333. doi: 10.1148/radiology.219.2.r01ma19316. [DOI] [PubMed] [Google Scholar]
- 10.Roy D, Breen M, Salvado O, Heinzel M, McKinley E, Wilson D. Imaging system for creating 3D block-face cryo-images of whole mice,”. 2006;6143:61431E–8. doi: 10.1117/12.655617. [DOI] [PMC free article] [PubMed] [Google Scholar]
- 11.Salvado O, Roy D, Heinzel M, McKinley E, Wilson D. 3D cryo-section/imaging of blood vessel lesions for validation of MRI data,”. 2006;6142:614214–10. doi: 10.1117/12.649093. [DOI] [PMC free article] [PubMed] [Google Scholar]
- 12.Ackerman MJ. The Visible Human Project: a resource for education. Acad.Med. 1999 Jun;74:667–670. doi: 10.1097/00001888-199906000-00012. [DOI] [PubMed] [Google Scholar]
- 13.Spitzer V, Ackerman MJ, Scherzinger AL, Whitlock D. The visible human male: a technical report. J.Am.Med.Inform.Assoc. 1996 Mar;3:118–130. doi: 10.1136/jamia.1996.96236280. [DOI] [PMC free article] [PubMed] [Google Scholar]
- 14.Ackerman MJ. The Visible Human Project. J.Biocommun. 1991;18:14. [PubMed] [Google Scholar]
- 15.Spitzer VM, Whitlock DG. The Visible Human Dataset: the anatomical platform for human simulation. Anat.Rec. 1998 Apr;253:49–57. doi: 10.1002/(SICI)1097-0185(199804)253:2<49::AID-AR8>3.0.CO;2-9. [DOI] [PubMed] [Google Scholar]
- 16.Zhang SX, Heng PA, Liu ZJ, Tan LW, Qiu MG, Li QY, Liao RX, Li K, Cui GY, Guo YL, Yang XP, Liu GJ, Shan JL, Liu JJ, Zhang WG, Chen XH, Chen JH, Wang J, Chen W, Lu M, You J, Pang XL, Xiao H, Xie YM. Creation of the Chinese visible human data set. Anat.Rec.B New Anat. 2003 Dec;275:190–195. doi: 10.1002/ar.b.10035. [DOI] [PubMed] [Google Scholar]
- 17.Park JS, Chung MS, Hwang SB, Lee YS, Har DH, Park HS. Visible Korean Human: Improved Serially Sectioned Images of the Entire Body. Medical Imaging, IEEE Transactions. 2005;24:352–360. doi: 10.1109/tmi.2004.842454. [DOI] [PubMed] [Google Scholar]
- 18.Rosenthal J, Mangal V, Walker D, Bennett M, Mohun TJ, Lo CW. Rapid high resolution three dimensional reconstruction of embryos with episcopic fluorescence image capture. Birth Defects Res.C.Embryo.Today. 2004 Sep;72:213–223. doi: 10.1002/bdrc.20023. [DOI] [PubMed] [Google Scholar]
- 19.Ruijter JM, Soufan AT, Hagoort J, Moorman AF. Molecular imaging of the embryonic heart: Fables and facts on 3D imaging of gene expression patterns. Birth Defects Res.C.Embryo.Today. 2004 Sep;72:224–240. doi: 10.1002/bdrc.20018. [DOI] [PubMed] [Google Scholar]
- 20.Weninger WJ, Mohun T. Phenotyping transgenic embryos: a rapid 3-D screening method based on episcopic fluorescence image capturing. Nat.Genet. 2002 Jan;30:59–65. doi: 10.1038/ng785. [DOI] [PubMed] [Google Scholar]
- 21.Ewald AJ, McBride H, Reddington M, Fraser SE, Kerschmann R. Surface imaging microscopy, an automated method for visualizing whole embryo samples in three dimensions at high resolution. Dev.Dyn. 2002 Nov;225:369–375. doi: 10.1002/dvdy.10169. [DOI] [PubMed] [Google Scholar]
- 22.Weninger WJ, Meng S, Streicher J, Muller GB. A new episcopic method for rapid 3-D reconstruction: applications in anatomy and embryology. Anat.Embryol.(Berl) 1998 May;197:341–348. doi: 10.1007/s004290050144. [DOI] [PubMed] [Google Scholar]
- 23.Kenzie-Graham A, Lee EF, Dinov ID, Bota M, Shattuck DW, Ruffins S, Yuan H, Konstantinidis F, Pitiot A, Ding Y, Hu G, Jacobs RE, Toga AW. A multimodal, multidimensional atlas of the C57BL/6J mouse brain. J.Anat. 2004 Feb;204:93–102. doi: 10.1111/j.1469-7580.2004.00264.x. [DOI] [PMC free article] [PubMed] [Google Scholar]
- 24.Toga AW, Ambach KL, Schluender S. High-resolution anatomy from in situ human brain. Neuroimage. 1994 Nov;1:334–344. doi: 10.1006/nimg.1994.1018. [DOI] [PubMed] [Google Scholar]
- 25.Cannestra AF, Santori EM, Holmes CJ, Toga AW. A three-dimensional multimodality brain map of the nemestrina monkey. Brain Res.Bull. 1997;43:141–148. doi: 10.1016/s0361-9230(96)00429-7. [DOI] [PubMed] [Google Scholar]
- 26.Toga AW, Ambach K, Quinn B, Hutchin M, Burton JS. Postmortem anatomy from cryosectioned whole human brain. J.Neurosci.Methods. 1994 Oct;54:239–252. doi: 10.1016/0165-0270(94)90196-1. [DOI] [PubMed] [Google Scholar]
- 27.Ware RW. Three-dimensional reconstruction from serial sections. Int.Rev.Cytol. 1975;40:325–440. doi: 10.1016/s0074-7696(08)60956-0. [DOI] [PubMed] [Google Scholar]
- 28.Odgaard A, Andersen K, Melsen F, Gundersen HJ. A direct method for fast three-dimensional serial reconstruction. J.Microsc. 1990 Sep;159(Pt 3):335–342. doi: 10.1111/j.1365-2818.1990.tb03038.x. [DOI] [PubMed] [Google Scholar]
- 29.Manconi F, Markham R, Cox G, Kable E, Fraser IS. Computer-generated, three-dimensional reconstruction of histological parallel serial sections displaying microvascular and glandular structures in human endometrium. Micron. 2001 Jun;32:449–453. doi: 10.1016/s0968-4328(00)00012-3. [DOI] [PubMed] [Google Scholar]
- 30.Brey EM, King TW, Johnston C, McIntire LV, Reece GP, Patrick CW., Jr. A technique for quantitative three-dimensional analysis of microvascular structure. Microvasc.Res. 2002 May;63:279–294. doi: 10.1006/mvre.2002.2395. [DOI] [PubMed] [Google Scholar]
- 31.Kaufman MH, Brune RM, Baldock RA, Bard JB, Davidson D. Computer-aided 3-D reconstruction of serially sectioned mouse embryos: its use in integrating anatomical organization. Int.J.Dev.Biol. 1997 Apr;41:223–233. [PubMed] [Google Scholar]
- 32.Kaufman MH, Richardson L. 3D reconstruction of the vessels that enter the right atrium of the mouse heart at Theiler Stage 20. Clin.Anat. 2005 Jan;18:27–38. doi: 10.1002/ca.10242. [DOI] [PubMed] [Google Scholar]
- 33.Griffini P, Smorenburg SM, Verbeek FJ, van Noorden CJ. Three-dimensional reconstruction of colon carcinoma metastases in liver. J.Microsc. 1997 Jul;187(Pt 1):12–21. doi: 10.1046/j.1365-2818.1997.2140770.x. [DOI] [PubMed] [Google Scholar]
- 34.Akahane T, Yaegashi H, Kurokawa Y, Satomi S, Takahashi T. Systemic-to-pulmonary vascular malformation of lung visualized by computer-assisted 3-D reconstruction. Histopathology. 1997 Sep;31:252–257. doi: 10.1046/j.1365-2559.1997.2470857.x. [DOI] [PubMed] [Google Scholar]
- 35.Tsai PS, Friedman B, Ifarraguerri AI, Thompson BD, Lev-Ram V, Schaffer CB, Xiong Q, Tsien RY, Squier JA, Kleinfeld D. All-optical histology using ultrashort laser pulses. Neuron. 2003 Jul 3;39:27–41. doi: 10.1016/s0896-6273(03)00370-2. [DOI] [PubMed] [Google Scholar]


