

Abstract
Ion-abrasion scanning electron microscopy (IASEM) takes advantage of focused ion beams to abrade thin sections from the surface of bulk specimens, coupled with SEM to image the surface of each section, enabling 3D reconstructions of subcellular architecture at ~ 30 nm resolution. Here, we report the first application of IASEM for imaging a biomineralizing organism, the marine diatom Thalassiosira pseudonana. Diatoms have highly patterned silica-based cell wall structures that are unique models for the study and application of directed nanomaterials synthesis by biological systems. Our study provides new insights into the architecture and assembly principles of both the “hard” (siliceous) and “soft” (organic) components of the cell. From 3D reconstructions of developmentally synchronized diatoms captured at different stages, we show that both micro- and nanoscale siliceous structures can be visualized at specific stages in their formation. We show that not only are structures visualized in a whole-cell context, but demonstrate that fragile, early-stage structures are visible, and that this can be combined with elemental mapping in the exposed slice. We demonstrate that the 3D architectures of silica structures, and the cellular components that mediate their creation and positioning can be visualized simultaneously, providing new opportunities to study and manipulate mineral nanostructures in a genetically tractable system.
Keywords: Diatom, Ion-abrasion SEM, Biomineral structure formation, Biosilicification, 3D tomography
Introduction
The unicellular eukaryotic algae known as diatoms make cell walls out of silica with an amazing diversity of structures on the nanoscale (Round F.E. et al., 1990). Because the complexity of diatom silica structures can exceed that possible using synthetic material production approaches, and diatoms reproduce these structures faithfully, in enormous numbers, and inexpensively, diatoms are being developed as a source of nanostructured materials (Sandhage et al., 2005). Facilitating this are techniques that either use diatoms as templates for functionalized coatings (Payne et al., 2005; Rosi et al., 2004; Weatherspoon et al., 2007), or convert their silica entirely to other chemistries while maintaining nanoscale features (Bao et al., 2007; Kusari et al., 2007; Sandhage K.H. et al., 2002; Sandhage et al., 2005; Unocic R.R. et al., 2004; Weatherspoon et al., 2006; Zhao J.P. et al., 2005). To further the development of diatoms as a source of nanostructured materials, it would be beneficial to develop approaches whereby structure could be genetically tailored to suit particular applications (Hildebrand, 2005; Sandhage et al., 2005). This requires better understanding of the silicification process.
Understanding the process of diatom silica cell wall synthesis requires elucidation of the underlying cellular and molecular biology. Especially important is to know how genes and organic molecules (proteins, polyamines, carbohydrates, and lipids) are involved in formation of specific mineral substructures. Molecular genetic (Hildebrand et al., 1993; Hildebrand et al., 1997; Poulsen N. and Kröger N., 2004), biochemical (Kröger N. et al., 1999; Kröger N. et al., 2001; Kröger N. et al., 2002; Poulsen N. and Kröger N., 2004; Wenzl et al., 2008), proteomic (Frigeri L.G. et al., 2006), and genomic (Armbrust et al., 2004; Mock et al., 2008) approaches have been applied to identify genes and organic molecules involved in diatom silicification. Because of the lack of known homologs, characterization of the organics must involve direct demonstration of their properties and functions. Understanding the timing of appearance and cellular positioning of an organic molecule in relation to formation of particular silica structures can be an important aspect of this characterization, since correlation would suggest some involvement. Three scales of structure formation have been identified in diatoms (Davis and Hildebrand, 2007; Hildebrand et al., 2006; Pickett-Heaps J. et al., 1990), 1) the nanoscale, which involves the initial polymerization products of silica apparently mediated by the interaction between proteins called silaffins (Kröger N. et al., 1999; Kröger N. et al., 2002; Poulsen N. and Kröger N., 2004), long chain polyamines (Kröger N. et al., 2000), and acidic phosphoproteins (Wenzl et al., 2008), 2) the mesoscale, which involves organization of nanoscale polymerization determinants into higher order structures, and 3) the microscale, in which the overall outline of the structure is determined by shaping of the silica deposition vesicle (SDV) – the membrane-bound intracellular compartment where silicification occurs (Drum R.W. and Pankratz H.S., 1964; Pickett-Heaps J. et al., 1990).
We have focused recently on examining silicification in Thalassiosira pseudonana, the first diatom with a complete genome sequence (Armbrust et al., 2004), and one that forms a relatively simple silica structure. A highly valuable experimental tool for studying silica cell wall formation in diatoms is to enrich for cells undergoing cell wall synthesis in a population by inducing synchronized progression through the cell cycle (Darley and Volcani, 1971). We have developed a silicon starvation/replenishment synchrony technique for T. pseudonana (Hildebrand et al., 2007) that enables enrichment of proteins and genes (Frigeri L.G. et al., 2006), and structural intermediates (Hildebrand et al., 2006) during cell wall formation. The latter is especially valuable for imaging approaches – instead of searching through large numbers of images to identify rare events; numerous cells undergoing the process at slightly different stages can be readily examined.
Previously, we used synchronized cultures of T. pseudonana to examine the process of cell wall formation using SEM, TEM and AFM (Hildebrand et al., 2006). T. pseudonana has a cylindrical shape, on average 4 μm in diameter, and varying between 4–7 μm in height (Hildebrand et al., 2006). The circular structures capping the top and bottom of the cylinder are called valves (Fig. 1a), and the sides are comprised of a series of thin silica strips called girdle bands, which encircle the cell in hooplike fashion and overlap each other from nearest the valve to more distant (Fig. 1). The overall structure of the cell is similar to a petri dish, where one valve and associated girdle bands form a combined structure called the epitheca, which overlaps a similar but narrower structure called the hypotheca (Fig. 1b). Diatoms preferentially reproduce vegetatively, and after mitosis, new valves are formed in the SDV intracellularly in two daughter cell protoplasts contained within the mother cell, as in Fig. 1b. After valve formation is complete, the valves are exocytosed, and the two daughter cells separate. Girdle band synthesis then commences on the hypotheca to enable cell expansion. It should be noted that the numbers of girdle bands on each theca prior to division can vary, but the newly synthesized valves are always found near the thecae overlap, thus the new valves are not always formed at the longitudinal center of the cell (Hildebrand et al., 2006, 2007). Valve formation in T. pseudonana proceeds in two general stages (Hildebrand et al., 2006); the first is deposition of the “base layer” which consists of flattened ribs of silica that radiate out from the center of the valve forming the entire circumference, and initiation of relatively large pores around the valve rim called rimoportulae (see Fig. 2a and b). There are a large number of small 20 nm pores (nanopores) between the ribs of the valve. Silica in the base layer has a smooth appearance. After base layer formation, deposition of additional silica occurs only on the distal valve surface in the form of 50 nm diameter silica particles that decorate the ribs (Hildebrand et al., 2006), and generate raised ridges (Fig. 2a and b). The portulae also become more highly formed.
Figure 1.

Organization of T. pseudonana cell features and views resulting from sectioning in different planes. (a) Schematic diagram of the exterior of a T. pseudonana cell. The valves are labeled at the top and bottom, and girdle bands are located by arrowheads at left. Views of sections through the cell in different planes are indicated. (b) Cross-sectional diagram of a T. pseudonana cell containing two daughter cell protoplasts. The epi- and hypo-theca are denoted by overlapping brackets. Inside each daughter cell protoplast, new valves have been formed (located by arrows), but these have not yet exocytosed to form the new cell wall.
Figure 2.

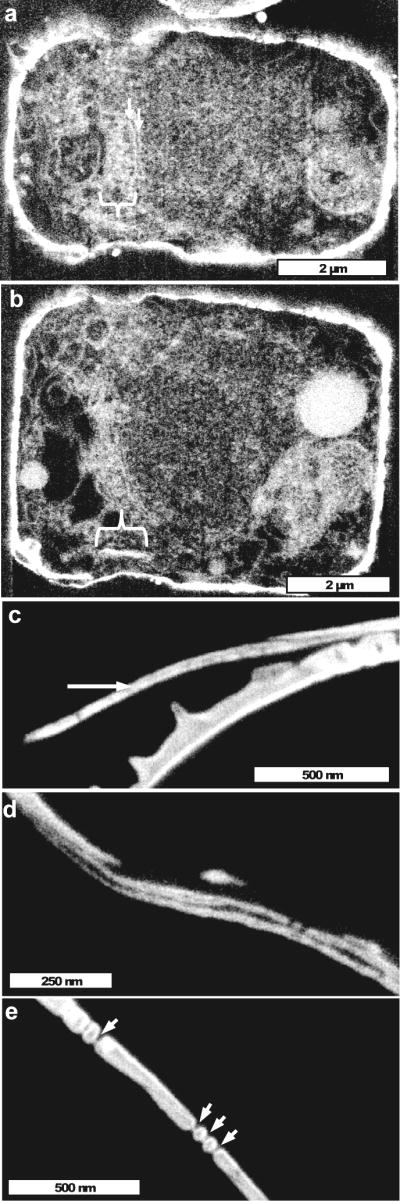
Comparison of conventional SEM and ion-abrasion SEM imaging of T. pseudonana. (a and b) Surface imaging of T. pseudonana emphasizing (a) the entire cell structure, and (b) a close-up of the valve surface. (c and d) Cross-sectional images of T. pseudonana generated by ion-abrasion SEM. In both images silica surrounding the cell is highly electron bright and intracellular membranes are less bright. Numerous vacuoles are visible, and in (d), thylakoid membranes of the plastid are predominant. (e) Surface image of the proximal valve surface of T. pseudonana. Note the smooth but ribbed internal structure and inner projections of the rimoportulae. (f) 3D reconstruction of a series of images of the proximal valve surface of T. pseudonana generated by ion-abrasion SEM. Similar features are visible as in the surface image in (e).
The previous study (Hildebrand et al., 2006) clarified the processes involved in valve formation in T. pseudonana, but was limited by the need to isolate silica structural intermediates from the cell prior to examination. Fragile structures were likely to be destroyed by the harsh acid and centrifugation conditions required for isolation; for example no intermediates in girdle band formation were identified in this study (Hildebrand et al., 2006). Also lacking was an analysis of organics involved in valve and girdle band formation. Because formation of diatom cell walls is exquisitely orchestrated in three dimensions (Pickett-Heaps J. et al., 1990), examination of structure formation at high resolution in a whole cell context would be highly valuable. Especially useful would be the ability to simultaneously image the organics and mineral in 3D. We previously applied Ion-abrasion SEM (IASEM) to examine subcellular architecture in yeast cells (Heymann et al., 2006) and melanoma cells (Heymann et al., 2008). This technique enables high resolution imaging of serial sections of fixed cell material, and reconstruction in 3D. The 3D images obtained in these studies demonstrate the striking spatial relationships between specific organelles such as mitochondria and membranes of the endoplasmic reticulum, and the distribution of unique cellular components (Heymann et al., 2006; Heymann et al., 2008). Resolution as high as ~ 6 nm and ~ 20 nm in the directions parallel and perpendicular, respectively, to the direction of ion beam milling were obtained (Heymann et al., 2008). In the current contribution, we report the first application of IASEM to a biomineralizing organism to study diatom silicification. It has enabled an unprecedented look into silica structure formation in T. pseudonana, resulting in several novel insights, and generating a new model for structure formation on the mesoscale.
2. Materials and methods
2.1. Diatom culturing and fixation
Thalassiosira pseudonana Hasle et Heimdale strain CCMP1335 was obtained from the Provasoli-Guillard National Center for Culture of Marine Phytoplankton, Bigelow Laboratory for Ocean Sciences, and maintained in artificial sea water (ASW) medium (Darley and Volcani, 1969), supplemented with biotin and vitamin B12, each at 1 ng · L−1. Growth was at 18°C in continuous light at an intensity of 150 μmol · m−2 · sec−1. Synchronous growth was done as described (Hildebrand et al., 2007); briefly, cells were harvested from a culture at the late exponential phase (c.a. 3 × 10⁶ cells · mL−1) and placed at a density of 1 × 10⁶ cells · mL−1 in silicon-free ASW for 24 h. Rhodamine 123 (R123) dye was added to the culture to monitor silica incorporation by fluorescence microscopy, and sodium silicate was added to 200 μmol · L−1 to initiate cell cycle progression. During silicon starvation, cells arrest in the G1 phase of the cell cycle, and after silicate replenishment, cells synthesize girdle bands for 3 h, and then enter S phase followed by cytokinesis (Hildebrand et al., 2007). Between 4–6 h after silicate replenishment, valve formation commences, followed by cell separation and synthesis of girdle bands in the daughter cells (Hildebrand et al., 2007). Cells used for imaging were harvested in this experiment when approximately 20% exhibited valve formation by R123 staining. Aliquots (5 mL) were mixed with an equal volume of 0.2 M Na cacodylate, 5% glutaraldehyde in 3.5% NaCl, and incubated 15 min at room temperature. Cells were centrifuged at 2,500 × g for 5 min, and resuspended in 5 mL 1 M Na cacodylate, 2.5% glutaraldehyde in 3.5% NaCl, and stored in the dark at 4°C.
2.2. Ion-abrasion SEM Methods
Resin blocks were prepared and processed as described previously (Heymann et al., 2006). Prior to milling and imaging, block surfaces were coated with platinum-palladium, and mounted on the stage of a Nova 200 Nanolab (FEI Eindhoven, NL). Typically, a ~1 μm layer of platinum-palladium was deposited using a gas injector system in the main specimen chamber to provide a conducting surface. Focused ion beam milling was carried out at a voltage of 30 kV and with beam currents ranging between 3 nA and 7 nA. Secondary electron scanning images were recorded at accelerating voltages of 2 kV in the immersion lens mode, using an Everhardt-Thornley detector. 2D image stacks were acquired at nominal inter-image distances ranging from 10 nm to 20 nm for most data sets. 2D SEM image stacks were registered using ImageJ (http://rsb.info.nih.gov/ij/), bandpass-filtered to sharpen membrane contours and imported into Amira (Mercury Computer Systems, Inc., Chelmsford, MA) for segmentation and rendering.
2.3. Elemental mapping
Spectrum imaging of the diatom was performed on a Nova 600 NanoLab DualBeam system (FEI, Hillsboro, OR) equipped with an Oxford INCAx-sight EDS detector (Oxford, Oxfordshire, UK). Imaging was performed over a 10 μm × 8.2 μm region (256 pixels × 256 pixels) using 5 keV electron beam energy. About 120 frames were summed to generate a single spectrum image (30 minutes in clock time). For each pixel of the image, an x-ray spectrum over 0 keV to 5 keV energy range was collected into 512 bins. Background-subtracted silicon, phosphorous, and oxygen maps were extracted from the spectrum images using Lispix (Bright, 2007; Gillen and Bright, 2003). Silicon, phosphorous, and oxygen maps were based on the sum image of energy channels between 1.74 keV and 1.84 keV, 2.00 keV and 2.11 keV, 480 eV and 640 eV respectively.
3. Results
3.1. Principles of sectioning using ion-abrasion SEM
T. pseudonana cells from a synchronized culture during the period of valve synthesis (Hildebrand et al., 2007) were fixed and then embedded in a resin block that was coated once to provide a conductive surface. Additional coating was not needed during the sectioning steps. Iteration of ion-beam milling with electron imaging resulted in the generation of a series of sequential images through the specimen, which could be combined to generate 3D images of the cell. 3D views of diatoms were obtained including delineation of the valve plane, girdle band plane, and oblique plane, as diagramed in Fig. 1a.
3.2. The ability of ion-abrasion SEM to image cellular features
Figure 2a and b show surface features of T. pseudonana cell wall silica. The valve in T. pseudonana consists of a ridged outer surface, with ridges radiating from the center, but also having cross-connections (Fig. 2b). Not visible between the ridges in these images are large numbers of 20 nm diameter circular pores (Hildebrand et al., 2006). Larger pores are found in projecting tube-like structures called rimoportula that are positioned around the valve rim (Fig. 2a and b). Commonly there is also a single portula (called the fultoportula) present slightly offset from the valve center. The portulae have a complicated chamber structure inferred from SEM and TEM observations (Herth 1979a; Hildebrand et al., 2006). The portulae are sites of extrusion of long, linear polymer strands of chitin, and the chitin-synthesizing machinery is positioned precisely adjacent to the portula on the inside of the cell (Herth W., 1979a and b). A series of overlapping siliceous girdle bands form the sides of the cell, and provide the overlap between the two thecae (Fig. 2a).
Figures 2c and d show cross-sectional views from the girdle band plane (2c) and at an angle from the valve plane (2d). Visible in both sections is the electron-bright silica surrounding the cell, and less bright but still visible organic material within the cell, highlighting organellar membranes and intracellular compartments. In Fig. 2d the plastid thylakoid membranes are readily visible. These images demonstrate the ability of ion-abrasion SEM to image both hard (mineral) and soft (organic) material at high resolution simultaneously in the same cell. Processing of a series of sections derived from the ion-abrasion SEM approach enables reconstruction of structure in 3D. This is demonstrated in Fig. 2e and f, where a standard SEM image of the inner valve surface (Fig. 2e) is compared with a 3D reconstruction generated from a series of sections through a similar object (Fig. 2f). In addition to the comparable resolution of standard SEM, the 3D image can be rotated to enable examination from a variety of angles. One caveat is that at certain angles the sectioning is emphasized (due to a finite amount of material being removed during sectioning), but, at other angles or with small section depth, this is minimized.
3.3. Elemental map analysis of sections of T. pseudonana
Figures 3a, b, and c show the P, O, and Si elemental maps of an ion milled cross-sectional view of T. pseudonana and Figure 3d is the overlay of the elemental maps and the SEM image of the same region. In the SEM image, both the siliceous components and the lipid containing bodies exhibit somewhat similar contrast. On the other hand, the atomic mass (Z) contrast is much enhanced in the elemental map and can clearly distinguish the high Si concentration regions from the phosphorous rich regions.
Figure 3.

Elemental map analysis of a section of T. pseudonana.
Cross-sectional girdle band view of T. pseudonana with the corresponding (a) phosphorous, (b) oxygen, and (c) silicon elemental maps, overlaid on an SEM image (d). Differences in the field of view between the x-ray maps and the SEM image are due to the difference in the detector positions relative to the sample. As expected, silicon is concentrated within the cell walls. Phosphorous signals coincide with lipid-enriched portion of the cell. Oxygen signals are relatively high over the entire field of view but there are areas of enrichment, mainly along the cell wall
3.4. Imaging of valves in intact cells
A major goal of this investigation was to identify cell wall structural intermediates in the context of the entire cell. Fig. 4 shows a series of sections oblique to the valve planes through a cell where the two daughter cell valves have been completed, but the daughter cells have not yet separated. Visualization of the 3D spatial arrangement of nascent valves within an intact cell is achieved. These images highlight the spatial separation between the two valves, the arrangement of ribs and nanopores, and the ability to cross-section structures such as portulae without distorting structural features. Also evident is the relative positioning of features on adjacent daughter cell valves, for example it is apparent that the rimoportulae are alternately positioned in the adjacent valves in these cells.
Figure 4.

Imaging of newly formed valves in T. pseudonana just prior to cell separation. Left are images from a series of successive (left to right, up to down) sections (20 nm average depth) through a T. pseudonana cell that has completed both daughter cell valves but has not separated. The view is slightly offset from the true valve plane. The valves are seen in succession predominantly on the left initially, then on the right. Substructures such as the rimoportulae and the 20 nm pores and ribs on the valve surface are visible, indicating that images produced by ion-abrasion SEM have high fidelity. Right is a 3D reconstruction of the series, emphasizing the two interior valves, colored red and yellow.
A cell at an extremely early stage of valve formation was imaged in Fig. 5. There was a close association of the nascent valve on one side of the cell with the girdle band region. A similar arrangement was seen in a number of cells, see also Fig. 3 and 7. This arrangement is in contrast with previously documented initiation of valve synthesis adjacent to the cleavage furrow near the center of the cell (Pickett-Heaps J. et al., 1990). In Fig. 5, ribs of silica in the base layer of the valve were highly flexible at the initial stage of deposition, and in some cases were folded over on themselves. Closer examination of individual sections (average 20 nm in depth) through the same cell revealed additional features (Fig. 6). At section 34 the overlap between the epi- and hypo-theca is visible (Fig. 6). By section 40, an additional silica structure was visible in the position where the new valve will form, and at the ends the structure was apparently fused with the hypotheca girdle band (Fig. 6). Based on previous analysis, only valves and not girdle bands should be forming at this stage in the cell cycle (Hildebrand et al., 2007). At section 44 (approximately 80 nm from section 40), additional structures and features were visible, including another layer fused to the hypotheca girdle band, and a discontinuity in the original additional structure. In section 63, valve ribs from the side view were visible, and in section 68, the spaces between the ribs were observed to be filling in. These data indicated that at least a portion of the newly forming valve is aligned with the long axis of the cell, and not in the valve plane. Circular structures that appear to be forming rimoportulae were also visible (Fig. 6, section 75).
Figure 5.

Extremely early stage in T. pseudonana valve formation. Images are in valve plane. Left are images from successive (left to right, up to down) sections (20 nm average depth) indicating convoluted rib structure initially associated with the girdle band region in the lower left corner of the cell. Right is a 3D reconstruction confirming the association of the newly forming valve with the girdle band region, and the extended ribs.
Figure 7.

Visualization of valve formation and the SDV, and cross-sectional structure of a completed valve. (a–f) are different sections from the same cell, imaged at an oblique angle from the girdle band plane. For all sections of this figure, more detail can be seen by zooming in. (a) Cross section of a cell just prior to initial visualization of silica. The dark band located by the white arrowhead is the SDV, and the dark arrow locates an adjacent filament with the width of actin (7 nm). (b) The next section towards the cell center from (a), which shows the first deposition of silica as ribs of the base layer. The dark opening characteristic of the SDV is missing in the location of the ribs, but is still present at the edges where rib silica is not visible (white arrowhead). (c and d) Successive cross-sections of the SDV prior to the appearance of silica. Arrows locate dark “holes” that are aligned in the successive sections, in reality, because the sectioning depth is 20 nm the dark areas are actually tubes oriented in the plane of the valve. (e and f) Another set of successive sections of the SDV, corresponding to those seen in (a and b). Arrows locate the dark holes in (e), which become filled with silica in (f). (g) Imaging of the SDV in an oblique cross-section of a cell. Association of the SDV predominantly with one side of the cell near the girdle bands is evident, as are circular outlines of fusing vesicles. (h) Cross-section of mature valve silica from the girdle band plane. The relatively flat proximal valve surface (towards the lower right) and ridged distal surface (towards the upper left) are evident, as are thin occlusions at the junction of the base and upper layer in the 20 nm pores (arrows) perforating the valve surface.
Figure 6.

Association of the forming valve with the girdle band region. Higher magnification images of sections from the same cell in Fig. 5. Section number of each image is denoted, individual sections were separated by 20 nm. Section 34 shows the epitheca (e), and hypotheca (h) girdle bands encircling the cell. Section 40 show an additional structure (as) associated with the hypotheca girdle band. Section 44 shows more complicated additional structures (as) and a discontinuity (dc) in structure. In section 63 valve ribs are visible (arrows) and in section 68 connections between the ribs are present (brackets). Circular structures in section 75 may be freshly forming rimoportulae.
3.5. Cross-sectional structure of valves
In Fig. 7a we imaged a cell at an oblique angle from girdle band plane view with a transverse dark opening (white arrowhead) in the location of valve synthesis. Because of its location, and the presence of silica in subsequent sections (Fig. 7b), we interpreted this as the SDV. A microfilamentous structure with the thickness of actin was seen on one edge of the dark opening (Fig. 7a, dark arrow). The opening was visible near the cell surface through successive sections spanning 280 nm, and then the first indication of silica was visible in the form of ribs making up the base layer (Fig. 7b). This indicated that the SDV was pre-formed at its final diameter by the time of initial silica deposition. Wherever silica was visible, the dark opening was absent, indicating that the SDV membrane and silica were closely appressed. Closer examination of the interior of the SDV prior to silicification revealed a series of regularly-spaced dark “holes” approximately 22 nm in diameter (Fig. 7c–e, arrows). Although difficult to visualize, these features were present in corresponding locations in successive sections, indicating a coherent tube-like structure that propagates through the x/y plane of the SDV. Figures 7c and d represent successive sections, and 7e and f another set of successive sections. The average spacing between the holes corresponded to the spacing of initial ribs [holes = 81.2±6.1 nm (n=8), ribs = 83.8±6.3 nm (n=4)], and in the successive sections presented in Figs. 7e and f, the location of the holes corresponded to the position of the ribs, suggesting that silica is filling in the holes. In Fig. 7g, the SDV is imaged in a cell at an oblique cross-section as a circular object, and is more electron-dense that other membranous intracellular material. Serial sections of this cell also revealed that the SDV was fully expanded prior to silicification (as in Figs. 7a and b), and a large number of smaller vesicles were observed fusing to the SDV, consistent with previous observations (Li C-W and Volcani B.E., 1985; Schmid A-M. and Schulz D., 1979). Close examination revealed that electron-dense material was present on the internal face of the vesicle membrane. In some sections of the SDV, the outlines of defined structures (e.g. rimoportulae) were visible. There also was an association of the SDV with the girdle band region on one side of the cell, as was seen in Figs. 3, 5, and 6. In Fig. 7h, a cross-section of mature valve silica indicated an average thickness of 60 nm. Also visible were interconnections through the center of the nanopores at the junction of the base layer and distal layer. Measurements of these connections ranged from 6–19 nm (ave. 15) in thickness; however, considering the possibility of imaging a portion of the pore wall (depending on the angle of sectioning), the width of these structures probably tends towards the lower value. It is not clear whether the occluding material is composed of organic or mineral; the electron brightness suggests that it is silica, but imaging of similar pores in girdle bands (see below) suggest the possibility of organic material or an organic/silica composite.
3.6. Visualization of the SDV and associated filaments during girdle band formation
Forming girdle bands were also imaged, revealing that the girdle band SDV had a dark appearance similar to the valve SDV, and encircled the entire periphery of the cell (Figs. 8a and b). Similar to the valve SDV, areas with no silica deposition were present (Fig. 8a), consistent with initial formation of the SDV, followed by silicification. Girdle bands in cross-section were tapered at the ends where they overlapped each other (Fig. 8c) and a girdle band plane view showing the forming girdle band and SDV (Fig. 8d), revealed that the tapered shape was formed without the girdle band being closely appressed to the adjacent girdle band. At the leading edge of a forming girdle band, a tangled microfilamentous structure (c.a. 7 nm filaments) was visible (Fig. 8e), and in a subsequent section, initial silica deposition was observed (Fig. 8f) in this region.
Figure 8.

Visualization of the SDV and associated filaments during girdle band formation. (a) Valve plane section through a cell showing the dark area characteristic of the girdle band SDV (bracket) with some silica visible at left. (b) Another section of the same cell showing the presence of more silica in the girdle band SDV. (c) Cross-sectional image of a three overlapping girdle bands showing their tapered overlapping structure. (d) Girdle band plane view of a newly forming girdle band and associated SDV. Arrow at left denotes the dark area of the SDV, and arrowhead at right locates the forming girdle band on the other side of the cell. (e and f) Successive sections through a cell showing 7 nm filaments associated with a forming girdle band. In (f), the initial polymerization of silica (more highly electron dense material) can be seen.
3.7. Girdle bands have a laminate structure
Imaging of one cell in girdle band plane view near the cell wall periphery revealed an apparent organic matrix with the width of a girdle band in the expected location of girdle band synthesis (Fig. 9a, bracket). This was flanked on one side by filamentous structures (Fig. 9a arrows) corresponding to the same relative location as the microfilaments in Figs. 8e and f. A different section at a higher level of the same cell showed the organic matrix in side view (Fig. 9b, bracket), and in particular sections, both sides could be seen. Close examination of the mature silica in girdle bands indicated an electron-transparent strip in the center flanked by more electron-dense silica (Fig. 9c), suggestive of an organic center. This was supported by a disruption of girdle band structure in some cells (Fig. 9d), consistent with a laminated structure of organic material flanked on both sides by silica. Pores in girdle bands were occluded by a thin strip of material (Fig. 9e) similar to that seen in valves; the occlusion corresponded in position with the presumed organic center of the laminate, suggesting that organic material occludes the pores, although we cannot eliminate the possibility of the presence of silica.
Figure 9.
Laminate structure of girdle bands. (a) Section in the girdle band plane near the cell wall showing an enrichment of organic material (bracket) of the correct width and at the correct location of a forming girdle band. Arrows denote filamentous material in a similar location as identified in Fig. 8. (b) Another section of the same cell as in (a), showing the precursor material of the girdle band in side view (bracket). (c) Cross-section of a girdle band showing the electron transparent central section (arrow) we interpret as being organic material. (d) Girdle band laminate structure in the process of separation. (e) Cross-sectional view of nanopores in girdle bands, which have a similar thin occlusion as was seen in the valve (Fig. 7h). The occlusion corresponds in position to the organic center of the girdle bands.
3.8. Structure of the rimoportula
A model for the complex structure of the rimoportula was previously presented based on observation of external features and intermediates seen during the process of formation (Hildebrand et al., 2006), but ion-abrasion SEM offered the possibility of a serial visualization of the complete internal and external structure. This was achieved as documented in Fig. 10. Details of the internal structure were readily visible, such as internal pores associated with the larger external chamber. A complete 3D reconstruction of the rimoportula was generated revealing that the inner and outer central pores openings were not precisely aligned (Fig. 10 and Supplemental Material).
Figure 10.

Structure of the rimoportula. Left is a series of image sections through a rimoportula (left to right, up to down), sectioning depth was 10 nm. Arrows in some of the images denote the location of accessory pores in the rimoportula chamber. Right is a 3D reconstruction of the portula highlighting the surface (red) or interior (pale pink) structure viewed from the outside (upper) and inside (lower) of the valve.
4. Discussion
An important consideration in evaluating the ion-abrasion SEM approach is whether artifacts are generated by the ion-beam milling process. Our observations suggest that artifacts are not generated at the limit of resolution for either the organic or mineral material because features observed in the slice and view series are closely comparable to those seen in previous TEM images of microtomed sections (Pickett-Heaps J. et al., 1990). Regarding silica, as an example, the numerous 20 nm circular pores in the valve of T. pseudonana (Hildebrand et al., 2006) are imaged faithfully in valve plane images in this study (Fig. 7h), and views in the girdle band plane provide the first images of cross-sections of the pores in these structures (Fig. 9e). When the angle of sectioning is in the same plane as the center of the pore (Figs. 7h and 9d), the observed width of the pore (corresponding to the diameter when viewed from top) is exactly as measured previously (Hildebrand et al., 2006). In addition, the depth of imaging is precisely defined because the center of the pore can be imaged without the “back” wall being visible (Figs. 7h and 9d), indicating a depth resolution in the range of ~10 nm. When assembling a series of sections, resolution can suffer in the plane of sectioning, due to the depth of material removed, which in this study varied from 10–20 nm. As the depth of sectioning decreases to become close to the depth resolution, as in sectioning of the rimoportula in Fig. 10, highly faithful reproduction in three dimensions is achieved.
We were also able to generate elemental maps using the ion-abrasion technique and energy dispersive x-ray spectroscopy (EDS). The spatial resolution of an elemental map depends on many factors including the beam energy used to generate x-rays, sample orientation, and the elemental composition and homogeneity of the sample. In general, the spatial resolution of an elemental map depends on the size of the x-ray generation volume which is much larger than the size of the incident electron beam (Goldstein et al., 2003). In the ion-abrasion SEM setup used in this study, the spatial resolution is further compromised by several factors related to the instrument geometry. However, the use of EDS in combination with higher resolution SEM imaging can be useful for studying the subcellular localization of specific elements, provided that the concentration of the elements are above trace level. Subcellular elemental analysis can be extended to 3D elemental mapping of an entire cell by introducing the EDS spectrum imaging step to the existing sequential ion-abrasion SEM technique. However, the throughput of the 3D elemental mapping technique is limited by the x-ray generation and detection efficiency. Because biological specimens are beam sensitive, relatively low beam energy (< 5 keV) must be used to generate x-rays. Generating enough x-rays to achieve usable count statistics at these low beam energies requires long mapping time (20 to 30 minutes), although this time is likely to be shortened in the future with the newer generation of EDS detectors such as silicon drift detectors.
One major advantage of the ion-abrasion SEM technique is the ability to image structures within intact cells at high resolution. There are two levels of resolution for the IASEM technique. The first is the resolution resulting from abrasion, which is relevant to the depth of sectioning. This typically was c.a. 20 nm, but in some cases was 10 nm. The second is in-plane image resolution, which is ~6 nm (Heymann et al. 2009). Previous characterization of forming diatom silica structures by electron microscopy required extraction of material from cells (Hildebrand et al., 2006; Li C-W and Volcani B.E., 1985; Pickett-Heaps J. et al., 1990; Schmid A-M.M. and Volcani B.E., 1983), which could bias observations towards structures that were sturdy enough to withstand the harsh extraction procedures required, or involved TEM imaging of microtomed sections (Pickett-Heaps J. et al., 1990; Pickett-Heaps J.D., 1983; Pickett-Heaps J.D. and Kowalski S.E., 1981; Pickett-Heaps J.D. et al., 1979; Schmid A-M. and Schulz D., 1979; Schmid A.M. et al., 1981), which provided useful “snapshots” of objects in one or a few sections, but did not enable a full 3D reconstruction due to difficulty in alignment. The latter point is extremely critical in visualizing structure formation in a whole cell context – examination of a limited number of sections from one viewpoint can prevent correct interpretation, whereas a large number of sections that can be examined at a variety of angles enable more careful evaluation.
A prime example of the advantage of 3D imaging using the ion-abrasion SEM approach is seen in Fig. 5. The objects observed correspond in dimension with those in the completed valve structure. This indicates an early stage in valve formation; however the structures are extremely flexible and out of plane with the final structure. This is consistent with early stages of valve formation being dominated by organics that either template or confine (see below) the polymerizing silica. This is reminiscent of in vitro silicification experiments showing the initial formation of a “plastic” stage of an organized silica/organic matrix prior to silica polymerization (Kröger N. et al., 2002). Also seen in Figs. 3, 5, and 7 is the association of the forming valve with the girdle band region on one side of the cell. Previous TEM-based studies on valve formation in a variety of diatom species indicated that valve formation initiated at a “primary silicification site” (PSS) that was located close to the center of the final valve structure, and that the forming valve was centrally located adjacent to the cleavage furrow in the daughter cell (for review see (Pickett-Heaps J. et al., 1990). Our observations do not contradict the idea of a PSS; the initial deposition of silica is seen to be enriched near the center of the forming valves (Figs. 5 and 7). The distinction comes in the location of the initially forming valve, which in T. pseudonana was commonly seen to be adjacent to, and associated with, the girdle bands (Fig. 5–7). Images for sections 63 and 68 in Fig. 6 also indicate that a significant portion of the center of the forming valve is oriented along the long axis of the cell, and not in the final valve plane. Previous work on Cyclotella cryptica indicated that when cytokinesis was inhibited, valves were also formed along the side of the cell (Badour, 1968).
One possible explanation for the lack of positioning of initially forming valves near the center of the cleavage furrow in T. pseudonana is the small size of this species compared with most of the larger diatoms previously examined. Ongoing work in our lab, and observations in this study, indicate that the majority of cell volume is occupied by the plastid, and that the cytoplasm represents a minority fraction, with a rough estimate of 15–25% of the total volume. In whole-cell cross-sections we observed newly forming valves in thin cytoplasmic strands only slightly wider than the forming valves they contained (data not shown) highlighting the lack of space available for valve formation. In other species, the nucleus and microtubule center (MC) are located near the center of the forming valve (Pickett-Heaps J. et al., 1990), and although we have not determined this directly, the sparseness of intracellular space in T. pseudonana could inhibit or affect similar positioning of these entities. To compensate, perhaps T. pseudonana initiates valve formation in an area where other silica structures form, near the girdle bands.
How would a valve that was initiated out of position eventually occupy the correct position? Perhaps the process of silica polymerization forces the SDV to expand like the inflation of fingers in a rubber glove. As long as the valve is anchored in one place, and has a defined outline dictated by the bounds of the silicalemma, then expansion to its full circumference could eventually result in correct placement.
Our observations may be consistent with mesoscale silica deposition of the ribs in the valves occurring within a defined space, rather than around a central template. This is supported by the observation of the internal structure of the SDV in the form of tubes in which silica is apparently deposited (Fig. 7). This data, coupled with previous TEM observations of the initial form of silica, suggest a “confinement” model for silicification of the valve ribs in T. pseudonana (Fig. 11). Several conceptual models for mesoscale structure formation are found in the literature. The earliest involves a templating protein around which silica is deposited (Robinson and Sullivan, 1987), which is depicted schematically in Fig. 11b. A later one (Sumper et al. 2002) proposes phase separation events by long-chain polyamines (LCPAs) which form droplets by hydrophobic association (Fig. 11c). In both cases, deposition of silica is proposed to occur on the surface of the organic molecule involved. In these models, the form of silica should take the shape of the template, and be concentrated around it, generating either a linear (template protein) or circular (polyamine droplet) structure with an organic or hollow (if the organic is removed) center (Fig. 11b and c). An alternative model for mesoscale structure formation involves nucleation at defined points coupled with limitation of growth by the confines of the SDV (Gordon R. and Drum R.W., 1994). Our TEM imaging reveals that initially deposited silica is homogenous, branched, and not concentrated in one area (Fig. 11a), which is inconsistent with a central organic core (Fig. 11b and c), but is consistent with confinement. Branched structures are ideal for filling in a space. In the confinement model (Fig. 11d), at the initial stage, prior to silica polymerization and corresponding to Figs. 7 c–e, the tubular structure is located between the pores (Fig. 11d, left). Silica polymerization begins, and a thin, relatively flat sheet of branched silica is formed (Fig. 11d center), as in Fig. 11a. Eventually the space between the pores becomes filled with silica, as seen in Fig. 7f, and the rib and pore arrangement characteristic of the valve is formed (Fig. 11d, right). Less polymerized silica would occur in the pore regions, because they effectively exclude silica polymerization within their confines, as is seen even at the earliest stages (Fig. 11a). In this model, silica is initially not concentrated in one area, but becomes so over time. We do not propose that the confinement model is exclusive for mesoscale silica structure formation in all diatoms; there are numerous examples of structures that appear to involve centralized templates (both linear and circular), and in fact it appears that the T. pseudonana girdle bands have this feature (Fig. 9). However, the structures observed in valve formation of T. pseudonana are more consistent with a confinement model than a central templating model for mesoscale structure formation.
Figure 11.

Central templating vs. confinement model for mesoscale structure formation. (a) TEM image of the silicification front during valve formation in T. pseudonana. Note the branched silica structure, and the location of regions where pores are forming, which lack silica. Image is in the same region as Fig. 3c in (Hildebrand et al., 2006), but is a distinct image. (b) Central templating model involving a linear protein (green) around which silica (gray) is deposited to form a rod structure. (c) Central templating model involving droplets of polyamines (blue) around which silica (gray) is deposited. In both models, the initial deposition of silica is concentrated around the template. (d) Confinement model of silicification. On left are depicted organic complexes comprising pores (in red) which flank a tubular structure (light blue) made of organics in the SDV lumen. Center depicts the initial stage of deposition, where silica is not yet confined, but forms a flat sheet within the tubule and between the pores. On the right, silica becomes concentrated in the tubule, and is less dense in the pore region. In this model, silica is initially not concentrated in one area, but becomes so over time.
Previous imaging of the SDV relied on TEM, which emphasized the inorganic silica and membranes appressed closely around it (Pickett-Heaps J. et al., 1990; Pickett-Heaps J.D., 1983; Pickett-Heaps J.D. and Kowalski S.E., 1981). Using the ion-abrasion SEM approach, for the first time, the entire SDV can be visualized in a whole-cell context. With TEM, precise alignment of serial sections is challenging, hence features spanning several sections are difficult to reconstruct. Serial sections obtained by ion-abrasion indicate that the SDV is fully formed prior to complete silica deposition (Figs. 7a and 8a and b). This implies that at least portions of the structure forming apparatus are assembled first, and silica polymerization is prevented until this has happened. It is not clear what a possible “trigger” would be to enable silica polymerization. In the absence of silica, the luminal space of the SDV is expanded (Figs. 7a and 8a and b); however in areas where silica is deposited, the silicalemma becomes tightly appressed to the silica (Fig. 7a and b). This suggests the possibility that SDV membrane components become integral parts of the silica structure.
Recent NMR analysis (Groger et al., 2008) of T. pseudonana indicated the presence of highly condensed silicon, possibly a silica sol, in addition to the weakly condensed silica in the cell wall. The intracellular location of highly-condensed silicon could not be determined, but a logical location (considering the amount required for NMR detection) would be in the SDV, where silica polymerization determinants could be involved in coordination (Groger et al., 2008). We observed, in the same plane as the deposited silica, that the SDV contained “open spaces” with a lack of electron density (Figs. 7 and 8). However when viewed perpendicular to the plane of silica deposition, material with higher electron density than other cellular membrane structures, but not as high as fully condensed silica, was visible (Fig. 7g). Since previous work has indicated a close association of silica with one intralumenal side of the SDV during formation of early stage structures (Hildebrand et al., 2006; Schmid A-M. and Schulz D., 1979; Schmid A-M.M. and Volcani B.E., 1983), these observations suggest an enrichment of possible silica sol material also associated with one intralumenal side of the SDV. The putative sol material is proposed to be a precursor to the fully polymerized silica (Groger et al., 2008), so this hypothesis is consistent with the eventual appearance of silica in that location. Flanking the SDV is a microfilament with dimensions similar to actin (Fig. 7a), consistent with fluorescence microscopy work locating actin at the periphery of the SDV, playing a role in defining its overall size and shape (van de Meene A.M.L. and Pickett-Heaps J.D., 2002).
In the past, girdle bands have been difficult to image because of their thinness, and little information has been available on the mechanism of their formation. Our results greatly clarify this process in T. pseudonana. Figures 8a and b show the girdle band SDV, which indicates that it is fully formed prior to complete silica deposition. In contrast to the valve, the silicalemma membranes are not both closely appressed to the silica (Fig. 8d), which is consistent with the organics involved in their formation being centrally located as in a laminate structure. Precursor material for a girdle band is seen in Figs. 9a and b, and the laminate structure observed in Figs. 9c and e indicate that the organic material forms a core, and silica is deposited on both sides of it. Girdle bands are tapered as they are formed (Fig. 8d), and apparently do not require close appression to an adjacent girdle band to generate the taper, which suggests intrinsic shaping by the organics responsible for their formation. At the leading edge of the girdle band SDV is a tangled microfilamentous material (Fig. 8e and f), with the dimensions of actin. This suggests a possible involvement of cytoskeletal elements in girdle band formation, which has not been previously documented.
It is not clear whether the thin layer observed occluding pores in both valves (Fig. 7h) and girdle bands (Fig. 9d) is organic material, silica, or a composite of both. The prevention of filling in of the valve pores (Fig. 11a) and apparent alignment between the organic in the laminate structure of girdle bands and the pore occlusions (Fig. 9c and e) suggest that the material is organic. However, thin coverings of silica over diatom pores have been observed in other species (Round F.E. et al., 1990). Unfortunately, the EDS analysis lacks sufficient resolution to resolve this issue.
The ability to generate a high resolution 3D image of the complicated rimoportula structure clarifies the relative arrangement of the central pores on the proximal and distal faces of the valve (Fig. 10 and supplemental material). One clear feature is that the proximal and distal central pores are offset from each other, which is in contrast to previous observations inferred by TEM and SEM (Herth W., 1979a; Hildebrand et al. 2006). This argues against newly synthesized chitin fibrils being rigid prior to extrusion through the outer pore. Diatom chitin fibrils are in the beta form, are exceptionally crystalline, and consist of individual microfibrils assembled to form a ribbon structure (Herth and Zugenmaier, 1977). TEM cross sections indicate that chitin fibrils are assembled prior to entering the inner tube of the portula (Herth W., 1979a). Application of ion-abrasion SEM to a cell which is actively extruding chitin through the portulae followed by 3D reconstruction should provide valuable information on the details of this process.
Two previous studies on diatoms related to 3D reconstruction and sectioning have been reported (Habchi et al., 2006; Massé et al., 2001). The first used scanning transmission ion microscopy tomography (STIM-T) to generate a 3D rendering of the silica cell wall of Ondontella sinensis (Habchi et al., 2006). In this study, intracellular components were removed, so it is not clear whether they could have been imaged by this approach. STIM-T did not generate high resolution images. The second approach relied on microtome sectioning followed by heat treatment to remove organics, then SEM (Massé et al., 2001). High resolution cross-sections of cell wall silica structures were obtained in this study, but their relationship to intracellular organics could also not be determined.
The application of ion-abrasion SEM to T. pseudonana cells in the process of silica structure formation enabled 1) simultaneous imaging of both inorganic and organic materials without the need of stains or coatings, 2) serial sectioning with minimal artifacts, 3) 3D reconstruction of intact cells, which enabled observation of extremely fragile structural intermediates and the spatial arrangement of forming structures, and 4) elemental analysis. It has provided an unprecedented view of a variety of cell wall formation processes, including 1) observation of the flexibility of initial-stage silica structures, which indicates a high organic content, 2) an association of forming valves with the girdle band region, 3) visualization of filaments that are likely cytoskeletal elements associated with valves and girdle bands, 4) the possibility of confinement rather than deposition around a template, and 5) laminate structures for the girdle bands. Not explored in this study, but certainly feasible, is the possibility of locating specific proteins by epitope tagging and immunolocalization as demonstrated recently by Heymann et al (2008). This would extend the IASEM approach to the molecular level, and allow finely detailed mapping of the 3D arrangement of organics involved in silicification in a whole cell context.
Supplementary Material
Acknowledgments
This work was supported by the Air Force Office of Scientific Research Multidisciplinary University Research Initiative Grant RF00965521 (to MH) and by the intramural program of the National Cancer Institute (to SS).
Footnotes
Publisher's Disclaimer: This is a PDF file of an unedited manuscript that has been accepted for publication. As a service to our customers we are providing this early version of the manuscript. The manuscript will undergo copyediting, typesetting, and review of the resulting proof before it is published in its final citable form. Please note that during the production process errors may be discovered which could affect the content, and all legal disclaimers that apply to the journal pertain.
References
- Armbrust E, Berges J, Bowler C, Green B, Martinez D, Putnam N, Zhou S, Allen A, Apt K, Bechner M, Brzezinski M, Chaal B, Chiovitti A, Davis A, Demarest M, Detter J, Glavina T, Goodstein D, Hadi M, Hellsten U, Hildebrand M, Jenkins B, Jurka J, Kapitonov V, Kröger N, Lau W, Lane T, Larimer F, Lippmeier J, Lucas S, Medina M, Montsant A, Obornik M, Parker M, Palenik B, Pazour G, Richardson P, Rynearson T, Saito M, Schwartz D, Thamatrakoln K, Valentin K, Vardi A, Wilkerson F, Rokhsar D. The genome of the diatom Thalassiosira pseudonana: Ecology, evolution, and metabolism. Science. 2004;306:79–86. doi: 10.1126/science.1101156. [DOI] [PubMed] [Google Scholar]
- Badour SS. Experimental separation of cell division and silica shell formation in Cyclotella cryptica. Archiv fur Mikrobiol. 1968;62:17–33. [Google Scholar]
- Bao ZH, Weatherspoon MR, Shian S, Cai Y, Graham PD, Allan SM, Ahmad G, Dickerson MB, Church BC, Kang ZT, Abernathy HW, Summers CJ, Liu ML, Sandhage KH. Chemical reduction of three-dimensional silica micro-assemblies into microporous silicon replicas. Nature. 2007;446:172–175. doi: 10.1038/nature05570. [DOI] [PubMed] [Google Scholar]
- Bright D. Lispix: An image processing and analysis tool for the PC. 2007 http://www.nist.gov/lispix/doc/contents.htm.
- Darley WM, Volcani BE. Role of silicon in diatom metabolism: A silicon requirement for deoxyribonucleic acid synthesis in the diatom Cylindrotheca fusiformis Reimann and Lewin. Exp Cell Res. 1969;58:334–342. doi: 10.1016/0014-4827(69)90514-x. [DOI] [PubMed] [Google Scholar]
- Darley WM, Volcani BE. Synchronized cultures: Diatoms. In: San Pietro A, editor. Methods in Enzymology. Academic Press; New York: 1971. pp. 85–96. [Google Scholar]
- Davis A, Hildebrand M. Molecular processes of biosilicification in diatoms. In: Sigel H, Sigel A, editors. Metal Ions in Life Sciences Volume 4 Biomineralization. From Nature to Application. Wiley; London: 2007. pp. 255–294. [Google Scholar]
- Drum RW, Pankratz HS. Post mitotic fine structure of Gomphonema parvulum. J Ultrastruc Res. 1964;10:217–223. doi: 10.1016/s0022-5320(64)80006-x. [DOI] [PubMed] [Google Scholar]
- Frigeri LG, Radabaugh TR, Haynes PA, Hildebrand M. Identification of proteins from a cell wall fraction of the diatom Thalassiosira pseudonana: Insights into silica structure formation. Mol Cell Proteomics. 2006;5:182–193. doi: 10.1074/mcp.M500174-MCP200. [DOI] [PubMed] [Google Scholar]
- Gillen G, Bright D. Tools and procedures for quantitative microbeam isotope ratio imaging by secondary ion mass spectrometry. Scanning. 2003;25:165–174. doi: 10.1002/sca.4950250402. [DOI] [PubMed] [Google Scholar]
- Goldstein J, Newbury D, Joy D, Lyman C, Echlin P, Lifshin E, Sawyer L, Michael J. Scanning Electron Microscopy and X-Ray Microanalysis. Plenum Press; New York: 2003. [Google Scholar]
- Gordon R, Drum RW. The chemical basis of diatom morphogenesis. Int Rev Cytol. 1994;150:243–372. [Google Scholar]
- Groger C, Sumper M, Brunner E. Silicon uptake and metabolism of the marine diatom Thalassiosira pseudonana: Solid-state Si-29 NMR and fluorescence microscopic studies. J Struct Biol. 2008;161:55–63. doi: 10.1016/j.jsb.2007.09.010. [DOI] [PubMed] [Google Scholar]
- Habchi C, Nguyen DT, Deves G, Incerti S, Lernelle L, Van Vang PL, Moretto P, Ortega R, Seznec H, Sakellariou A, Sergeant C, Simionovici A, Ynsa MD, Gontier E, Heiss M, Pouthier T, Boudou A, Rebillat F. Three-dimensional densitometry imaging of diatom cells using STIM tomography. Nucl Inst Meth Phys Res B - Interact Maters Atoms. 2006;249:653–659. [Google Scholar]
- Herth W, Zugenmaier P. Ultrastructure of chitin fibrils of centric diatom Cyclotella cryptica. J Ultrastruc Res. 1977;61:230–239. doi: 10.1016/s0022-5320(77)80090-7. [DOI] [PubMed] [Google Scholar]
- Herth W. A special chitin-fibril-synthesizing apparatus in the centric diatom Cyclotella. Naturwissen. 1979a;65:260–261. [Google Scholar]
- Herth W. The site of β-chitin fibril formation in centric diatoms. II. The chitin forming cytoplasmic structures. J Ultrastruc Res. 1979b;68:16–27. doi: 10.1016/s0022-5320(79)90138-2. [DOI] [PubMed] [Google Scholar]
- Heymann J, Hayles M, Gestmann I, Giannuzzi L, Lich L, Subramaniam S. Site-specific 3D imaging of cells and tissues with a dual beam microscope. J Struct Biol. 2006;155:63–73. doi: 10.1016/j.jsb.2006.03.006. [DOI] [PMC free article] [PubMed] [Google Scholar]
- Heymann J, Shi D, Kim S, Bliss D, Milne JLS, Subramaniam S. 3D imaging of melanoma cells using automated ion-abrasion scanning electron microscopy. Microsc Microanal. 2008;13(Suppl 2):360–361. [Google Scholar]
- Hildebrand M. Prospects of manipulating diatom silica nanostructure. J Nanosci Nanotech. 2005;5:146–157. doi: 10.1166/jnn.2005.013. [DOI] [PubMed] [Google Scholar]
- Hildebrand M, Frigeri L, Davis AK. Synchronized growth of Thalassiosira pseudonana (Bacillariophyceae) provides novel insights into cell wall synthesis processes in relation to the cell cycle. J Phycol. 2007;43:730–740. [Google Scholar]
- Hildebrand M, Higgins DR, Busser K, Volcani BE. Silicon-responsive cDNA clones isolated from the marine diatom Cylindrotheca fusiformis. Gene. 1993;132:213–218. doi: 10.1016/0378-1119(93)90198-c. [DOI] [PubMed] [Google Scholar]
- Hildebrand M, Volcani BE, Gassmann W, Schroeder JI. A gene family of silicon transporters. Nature. 1997;385:688–689. doi: 10.1038/385688b0. [DOI] [PubMed] [Google Scholar]
- Hildebrand M, York E, Kelz JI, Davis AK, Frigeri LG, Allison DP, Doktycz MJ. Nano-scale control of silica morphology and three-dimensional structure during diatom cell wall formation. J Materials Res. 2006;21:2689–2698. [Google Scholar]
- Kröger N, Deutzmann R, Sumper M. Polycationic peptides from diatom biosilica that direct silica nanosphere formation. Science. 1999;286:1129–1132. doi: 10.1126/science.286.5442.1129. [DOI] [PubMed] [Google Scholar]
- Kröger N, Deutzmann R, Bergsdorf C, Sumper M. Species-specific polyamines from diatoms control silica morphology. Proc Nat’l Acad Sci, USA. 2000;97:14133–14138. doi: 10.1073/pnas.260496497. [DOI] [PMC free article] [PubMed] [Google Scholar]
- Kröger N, Lorenz S, Brunner E, Sumper M. Self-assembly of highly phosphorylated silaffins and their function in biosilica morphogenesis. Science. 2002;298:584–586. doi: 10.1126/science.1076221. [DOI] [PubMed] [Google Scholar]
- Kusari U, Bao Z, Cai Y, Ahmad G, Sandhage KH, Sneddon LG. Formation of nanostructured, nanocrystalline boron nitride microparticles with diatom-derived 3-D shapes. Chem Comm. 2007;11:1177–1179. doi: 10.1039/b614494b. [DOI] [PubMed] [Google Scholar]
- Li C-W, Volcani BE. Studies on the biochemistry and fine structure of silica shell formation in diatoms. VIII. Morphogenesis of the cell wall in a centric diatom, Ditylum brightwellii. Protoplasma. 1985;124:10–29. [Google Scholar]
- Massé G, Poulin M, Belt ST, Robert JM, Barreau A, Rince Y, Rowland SJ. A simple method for SEM examination of sectioned diatom frustules. J Microsc Oxford. 2001;204:87–92. doi: 10.1046/j.1365-2818.2001.00942.x. [DOI] [PubMed] [Google Scholar]
- Mock T, Samanta MP, Iverson V, Berthiaume C, Robison M, Holtermann K, Durkin C, BonDurant SS, Richmond K, Rodesch M, Kallas T, Huttlin EL, Cerrina F, Sussmann MR, Armbrust EV. Whole-genome expression profiling of the marine diatom Thalassiosira pseudonana identifies genes involved in silicon bioprocesses. Proc Natl Acad Sci USA. 2008;105:1579–1584. doi: 10.1073/pnas.0707946105. [DOI] [PMC free article] [PubMed] [Google Scholar]
- Payne EK, Rosi NL, Xue C, Mirkin CA. Sacrificial biological templates for the formation of nanostructured metallic microshells. Angew Chemie. 2005;44:5064–5067. doi: 10.1002/anie.200500988. [DOI] [PubMed] [Google Scholar]
- Pickett-Heaps J, Schmid A-MM, Edgar LA. The cell biology of diatom valve formation. In: Round FE, Chapman DJ, editors. Progress in Phycological Research. Biopress Ltd.; Bristol: 1990. pp. 1–168. [Google Scholar]
- Pickett-Heaps JD. Valve morphogenesis and the microtubule center in three species of the diatom Nitzschia. J Phycol. 1983;19:269–281. [Google Scholar]
- Pickett-Heaps JD, Kowalski SE. Valve morphogensis and the microtubule center of the diatom Hantzschia amphioxysis. Eur J Cell Biol. 1981;25:150–170. [PubMed] [Google Scholar]
- Pickett-Heaps JD, Tippit DH, Andreozzi JA. Cell division in the pennate diatom Pinullaria IV. Valve morphogenesis Biolog Cell. 1979;35:199–206. [Google Scholar]
- Poulsen N, Kröger N. Silica morphogenesis by alternative processing of silaffins in the diatom Thalassiosira pseudonana. J Biol Chem. 2004;279:42993–42999. doi: 10.1074/jbc.M407734200. [DOI] [PubMed] [Google Scholar]
- Robinson DH, Sullivan CW. How do diatoms make silicon biominerals? TIBS. 1987;12:151–154. [Google Scholar]
- Rosi NL, Thaxton CS, Mirkin CA. Control of nanoparticle assembly by using DNA-modified diatom templates. Angew Chemie. 2004;43:5500–5503. doi: 10.1002/anie.200460905. [DOI] [PubMed] [Google Scholar]
- Round FE, Crawford RM, Mann DG. The diatoms: Biology and morphology of the genera. Cambridge University Press; Bath: 1990. p. 747. [Google Scholar]
- Sandhage KH, Dickerson MB, Huseman PM, Caranna MA, Clifton JD, Bull TA, Heibel TJ, Overton WR, Schoenwaelder MEA. Novel, bioclastic route to self-assembled, 3D, chemically tailored meso/nanostructures: Shape-preserving reactive conversion of biosilica (diatom) microshells. Adv Mater. 2002;14:429–433. [Google Scholar]
- Sandhage KH, Allan SM, Dickerson MB, Gaddis CS, Shian S, Weatherspoon MR, Cai Y, Ahmad G, Haluska MS, Snyder RL, Unocic RR, Zalar FM, Zhang Y, Rapp RA, Hildebrand M, Palenik BP. Merging biological self-assembly with synthetic chemical tailoring: The potential for 3-D genetically-engineered micro/nano-devices (3-D GEMS) Int J Appl Ceram Tech. 2005;2:317–326. [Google Scholar]
- Schmid AM, Schulz D. Wall morphogenesis in diatoms: deposition of silica by cytoplasmic vesicles. Protoplasma. 1979;100:267–288. [Google Scholar]
- Schmid AMM, Volcani BE. Wall morphogenesis in Coscinodiscus wailesii. I. Valve morphology and development of its architecture. J Phycol. 1983;19:387–402. [Google Scholar]
- Schmid AM, Borowitzka MA, Volcani BE. Morphogenesis and biochemistry of diatom cell walls. In: Kiermayer O, editor. Cytomorphogenesis in plants. Springer-Verlag; New York: 1981. pp. 63–97. [Google Scholar]
- Sumper M. A phase separation model for the nanopatterning of diatom biosilica. Science. 2002;295:2430–2433. doi: 10.1126/science.1070026. [DOI] [PubMed] [Google Scholar]
- Unocic RR, Zalar FM, Sarosi PM, Cai Y, Sandhage KH. Anatase assemblies from algae: coupling biological self-assembly of 3-D nanoparticle structures with synthetic reaction chemistry. Chem Comm. 2004;7:796–797. doi: 10.1039/b400599f. [DOI] [PubMed] [Google Scholar]
- van de Meene AML, Pickett-Heaps JD. Valve morphogenesis in the centric diatom Proboscia alata Sundstrom. J Phycol. 2002;38:351–363. [Google Scholar]
- Weatherspoon MR, Haluska MS, Cai Y, King JS, Summers CJ, Snyder RL, Sandhage KH. Phosphor microparticles of controlled three-dimensional shape from phytoplankton. J Electrochem Soc. 2006;153:H34–H37. [Google Scholar]
- Weatherspoon MR, Dickerson MB, Wang G, Cai Y, Shian S, Jones C, Marder SR, Sandhage KH. Thin, conformal, and continuous SnO2 coatings on three-dimensional biosilica templates through hydroxy-group amplification and layer-by-layer alkoxide deposition. Angew Chem, Int Ed. 2007;46:5724–5727. doi: 10.1002/anie.200701297. [DOI] [PubMed] [Google Scholar]
- Wenzl S, Hett R, Richthammer P, Sumper M. Silacidins: Highly acidic phosphopeptides from diatom shells assist in silica precipitation in vitro. Angew Chem. 2008;47:1729–1732. doi: 10.1002/anie.200704994. [DOI] [PubMed] [Google Scholar]
- Zhao JP, Gaddis CS, Cai Y, Sandhage KH. Free-standing microscale structures of nanocrystalline zirconia with biologically replicable three-dimensional shapes. J Mater Res. 2005;20:282–287. [Google Scholar]
Associated Data
This section collects any data citations, data availability statements, or supplementary materials included in this article.