

I. Introduction
A. Background and Significance
“High-end” CT systems allow acquisition of isotropic volumetric data sets that permit images less than 1 mm thick and high quality reformatted images. These capabilities have greatly expanded the utility of CT, and CT usage has correspondingly increased, replacing more and more radiographic examinations. In 1990, approximately 13 million CT scans were performed in the United States 1. In 2000, the number of CT scans more than tripled to approximately 46 million 1. The estimated number of CT scans for 2006 is 62 million 1. With high quality CT imaging being performed more frequently, patients can benefit from a quicker and more accurate diagnosis and precise anatomic information for planning therapeutic procedures. However, in spite of the tremendous contributions of CT to modern healthcare, some attention must also be given to the very small health risk associated with the ionizing radiation received during a CT exam.
CT scanners create cross-sectional images by measuring x-ray attenuation properties of the body from many different directions. Currently, the radiation dose associated with a typical CT scan (1–14 mSv depending on the exam) is comparable to the annual dose received from natural sources of radiation, such as radon and cosmic radiation (1–10 mSv), depending on where a person lives 2. Hence, the health risk to an individual from exposure to radiation from a typical CT scan is comparable to background levels of radiation. However, considering the growing population of people undergoing CT scans, the implications of CT radiation dose on public health effects may be significant, although considerable debate exists regarding this assumption. One study suggested that as much as 0.4% of all current cancers in the United States may be attributable to the radiation from CT studies based on CT usage data from 1991–1996 1. When organ specific cancer risk was adjusted for current levels of CT usage, it was determined that 1.5–2% of cancers may eventually be caused by the ionizing radiation used in CT 1. This study and a similar series of previous articles 3, 4 received considerable attention from the public media. One positive effect of the media attention was that the CT community was obliged to review the amount of radiation prescribed for CT scans, especially for pediatric patients. This ultimately resulted in an aggressive effort to minimize CT doses and optimize image quality. Concurrently, new technologies such as automatic exposure control (AEC) were in development and eventually made commercially available for all current CT systems. The use of AEC greatly enhances and simplifies efforts to decrease patient dose.
However, the media reporting on the risk of CT radiation doses has had a negative effect on the public’s perception of CT imaging and radiation, influenced by the sensationalist and alarmist tone of the news stories. Phrases such as “…dangerous radiation from ‘super X-rays’…” 5 and comparisons to atomic bomb survivors 6 exploit the public’s general apprehension of radiation. Although informing the public of potential health risks—even small risks—is not inappropriate, journalistic responsibility should ensure that the data be presented so as not to exaggerate or present the risk estimates in a manner that can be easily misinterpreted by a population that, in general, is not sufficiently knowledgeable in radiation or radiobiology to accurately assess the information. Such alarmist articles are a public disservice in that they cause unnecessary stress to patients, or in some cases, may persuade a patient to decline a CT scan that could have a positive impact on their health. The latter case cannot be overstated because low-level radiation risk estimates, which are derived primarily from atomic bomb survivors and have considerable uncertainties at low doses (<100 mSv), give no consideration to the medical benefit of a CT scan. There is no question that the benefit of an appropriately indicated CT scan far exceeds the associated estimated risk or that CT providers need to prescribe the minimal amount of radiation required to obtain images adequate for evaluating the patient’s condition. Additionally, the medical community needs to better educate the public to the risks and benefits associated with CT, such that they can make informed decisions regarding their healthcare.
B. Brief tutorial on the measurement of radiation output for CT
Scanner output
The Computed Tomography Dose Index (CTDI) is the primary metric used in CT to describe the radiation output from a scanner. It is a measure of the amount of radiation delivered from a series of contiguous irradiations to a pair of standardized acrylic phantoms. It is, however, measured from one axial CT scan (one rotation of the x-ray tube) 7–10. The CTDI was defined in the early days of CT, when dose assessments were made using thermoluminescent dosimeters (TLDs) and multiple axial scans, each one incremented from the previous scan by the nominal beam width. This procedure was not only time consuming and laborious, but also required many scans (exposures) for each beam width, phantom size, tube potential setting (kV), and position in the field of view (FOV, periphery or center). The resultant parameter was referred to as the multiple-scan average dose (MSAD), which was typically a factor of 2–3 times higher than the peak radiation dose from one axial scan. Shope and Gagne9 demonstrated the mathematical equivalence between the scan intensive MSAD and the CTDI, which is able to be measured using only one scan (one gantry rotation), when certain criteria are met with regard to the length of the ionization chamber and the length of the clinical scan being assessed.
The theoretically perfect equivalence of MSAD and CDTI is not achieved in many clinical scenarios, but due to the speed and ease of CTDI measurements, the use of MSAD declined. CTDI is now used internationally based on a standardized measurement technique. Several variants of CTDI exist that describe specific steps in the measurement and calculation processes. These include the CTDI100 and the weighted CTDI (CTDIw). These parameters are described in multiple publications 11–13.
Volume CTDI (CTDIvol)
The CTDI variant that is currently of most relevance is the Volume CTDI (CTDIvol). This parameter accounts for gaps or overlaps between the x-ray beams from consecutive rotations of the x-ray source and variations in dose across the FOV. The CTDIvol provides a single parameter, based on a directly and easily measured quantity, which describes the radiation delivered to the scan volume for a standardized (CTDI) phantom13. The SI units are milli-Gray (mGy). CTDIvol is a useful indicator of the radiation output for a specific exam protocol, because it takes into account protocol-specific information such as pitch. However, it is important to realize that CTDIvol is not a direct measurement of dose; it is a standardized measure of radiation output in the CT environment14.
Dose Length Product (DLP)
To better represent the overall energy delivered by a given scan protocol, the CTDIvol can be integrated along the scan length to compute the Dose-Length Product (DLP)7, where the DLP (in mGy-cm) is equal to CTDIvol (in mGy) times scan length (in cm). The DLP reflects the integrated radiation output (and thus the potential biological effect) attributable to the complete scan acquisition. Thus, an abdomen-only CT exam might have the same CTDIvol as an abdomen/pelvis CT exam, but the latter exam would have a greater DLP, proportional to the greater z-extent of the scan volume.
Effective Dose (E)
Effective dose, E, is not a measurement of dose, but rather a concept that reflects the stochastic risk (e.g. cancer induction) from an exposure to ionizing radiation15, 16. It is typically expressed in the units of milli-Sieverts. Effective dose reflects radiation detriment averaged over gender and age and its use has several limitations when applied to medical populations15–18. In particular, it uses a mathematical model for a “standard” body in its calculation19 and is hence not an appropriate risk indicator for any one individual. However, it does facilitate the comparison of biologic effect between diagnostic exams of different types or having different acquisition parameters15, 16. By comparing patient effective dose to background radiation dose from natural sources, which in the U.S. averages 3 mSv per year with a range across the U.S. from 1–10 mSv2, patients and their families are better able to put the risk associated with medical doses into perspective.
The European Working Group for Guidelines on Quality Criteria in CT has proposed a generic estimation method for effective dose7. A set of coefficients k, where the values of k are dependent only on the region of the body being scanned (Table 1), were determined in relation to the DLP. E (in mSv) can thus be estimated by multiplying the DLP value (in mGy-cm), which is reported on most CT systems, by the region-specific k coefficient (in mSv/(mGy-cm)).
Table 1.
Normalized effective dose per dose-length product (DLP) for adults (standard physique) and pediatric patients of various ages over various body regions. Conversion factor for adult head and neck and pediatric patients assume use of the head CT dose phantom (16 cm). All other conversion factors assume use of the 32-cm diameter CT body phantom 93, 94. These coefficients estimate effective dose as defined in ICRP report #6195 and do not reflect the newly recommended tissue weighting values of ICRP #10318.
| Region of body | k (mSv · mGy−1 ·cm−1) | ||||
|---|---|---|---|---|---|
| 0 year old | 1 year old | 5 year old | 10 year old | Adult | |
| Head and neck | 0.013 | 0.0085 | 0.0057 | 0.0042 | 0.0031 |
| Head | 0.011 | 0.0067 | 0.0040 | 0.0032 | 0.0021 |
| Neck | 0.017 | 0.012 | 0.011 | 0.0079 | 0.0059 |
| Chest | 0.039 | 0.026 | 0.018 | 0.013 | 0.014 |
| Abdomen and pelvis | 0.049 | 0.030 | 0.020 | 0.015 | 0.015 |
| Trunk | 0.044 | 0.028 | 0.019 | 0.014 | 0.015 |
The values of E predicted by DLP and the values of E estimated using more rigorous calculations methods are remarkably consistent, with a maximum deviation from the mean of approximately 10 to 15 %20. Hence, the use of DLP to estimate E appears to be a reasonably robust method for estimating effective dose. However, effective dose alone does not give a complete picture of estimated radiation risk to specific radiation sensitive organs or patients of a specific age or gender. For a complete picture, specific organ doses and age, gender, and organ specific risk estimates are needed.
Recently the International Commission on Radiation Protection (ICRP) altered their recommendations regarding the relative radiation sensitivities of various organs and tissues. Thus, for the same exact scan performed on the same exact equipment and resulting in the same predicted organ doses, the value for effective dose will differ depending on whether the recommendations from 1991 (ICRP 60) or 2007 (ICRP 103) are used15, 18. Hence, the version of E (e.g. ICRP 60 or ICRP 103) must be provided when a value of effective dose is given. The data presented in Table 1 make use of the organ weighting factors from ICRP 60; the new values from ICRP103 have not yet been widely adopted.
II. Justification and Optimization
General principles of ALARA
The guiding principles for radiation protection in medicine are:
Justification: The exam must be medically indicated.
Optimization: The exam must be performed using doses that are As Low As Reasonably Achievable (ALARA), consistent with the diagnostic task.
Limitation: While dose levels to occupationally exposed individuals (i.e. the radiologist or technologist) are limited to levels recommended by consensus organizations, limits are not typical for medically-necessary exams or procedures.
As the growth in CT utilization increased, particularly in pediatric patients, and concern over the population dose from CT was expressed in the scientific literature and lay press 3, 4, 21, 22, it became clear that the responsible use of CT required adjustment of technique factors based on patient size (attenuation characteristics) 3, 23, 24. In response, the radiology community (radiologists, physicists and manufacturers) has worked to implement ALARA principles in CT imaging 21, 25–31. The guiding principle for dose management in CT is that the right dose for a CT examination takes into account the specific patient attenuation and the specific diagnostic task. For large patients, this indeed means a dose increase is consistent with ALARA principles.
Additionally, each CT exam must be appropriate for the individual patient. Justification is a shared responsibility between requesting clinicians and radiologists. Hence, for medical exposures, the primary tasks of the imaging community are to work with ordering clinicians in order to direct patients to the most appropriate imaging modality for the required diagnostic task, and to ensure that all technical aspects of the examination are optimized, such that the required level of image quality can be obtained while keeping the doses as low as possible. The American College of Radiology Appropriateness Criteria provides evidence-based guidelines to help physicians in recommending an appropriate imaging test32. The European Commission guidelines and United Kingdom’s Royal College of Radiologists document titled “Referral guidelines for imaging” also provide a detailed overview of clinical indications for imaging examinations, including CT33. Thus, a CT exam should be performed only when the radiation dose is deemed to be justified by the potential clinical benefit to the patient.
III. Dose reduction strategies
General strategies
All dose reduction strategies are predicated on the assumption that the CT scanner’s radiation dose levels and image quality fall within manufacturer specifications and other general quality criteria. This can be accomplished through a quality control program that is designed and overseen by a qualified medical physicist.
Fixed tube current (technique charts)
Unlike traditional radiographic imaging, a CT image never looks “over-exposed” in the sense of being too dark or too light; the normalized nature of CT data (i.e., CT numbers represent a fixed amount of attenuation relative to water) ensures that the image always appears properly exposed. As a consequence, CT users are not technically compelled to decrease the tube-current-time product (mAs) for small patients, which may result in excess radiation dose for these patients. It is, however, a fundamental responsibility of the CT operator to take patient size into account when selecting the parameters that affect radiation dose, the most basic of which is the mAs 25, 34.
As with radiographic and fluoroscopic imaging, the operator should be provided with appropriate guidelines for mAs selection as a function of patient size. These are often referred to as technique charts. In CT, the tube current exposure time and tube potential can all be altered to give the appropriate exposure to the patient. However, users most commonly standardize the tube potential (kV) and gantry rotation time (s) for a given clinical application. The fastest rotation time should typically be used to minimize motion blurring and artifact, and the lowest kV consistent with the patient size should be selected to maximize image contrast 35–40. Hence tube current is the primary parameter that is adapted to patient size.
Numerous investigators have shown that the manner in which mA should be adjusted as a function of patient size should be related to the overall attenuation, or thickness, of the anatomy of interest as opposed to patient weight, which is correlated to patient girth, but not a perfect surrogate for attenuation as a function of anatomic region 23, 24, 41. The exception is for imaging of the head, where attenuation is relatively well defined by age, since the primary attenuation comes from the skull and the process of bone formation in the skull is age dependent.
Clinical evaluations of mA-adjusted images have demonstrated that radiologists do not find the same noise level acceptable in small patients as in larger patients 23. Because of the absence of adipose tissue between organs and tissue planes, and the smaller anatomic dimensions, radiologists tend to demand lower noise images in children and small adults relative to larger patients 23, 24, 41, 42. For CT imaging of the head, the mAs reduction from an adult to a newborn of approximately a factor of 2 to 2.5 is appropriate. For CT imaging of the body, typically a reduction in mAs of a factor of 4 to 5 from adult techniques is acceptable in infants 41, while for obese patients, an increase of a factor of 2 is appropriate 41. To achieve sufficient exposure levels for obese patients, either the rotation time or the tube potential may also need to be increased.
Tube current (mA) modulation
Extremely large variations in patient absorption occur both with projection angle and anatomic region, and are not considered when using a fixed tube current (Figure 1). The projection with the most noise primarily determines the noise of the final image. Hence, data acquired through body parts having less attenuation can be acquired with substantially less radiation without negatively affecting the final image noise 37, 43–45. In addition, it is also possible to reduce dose for projections of limited interest. For example, in cardiac CT, dropping mA during systole can significantly reduce dose to the patient. Tube current modulation may occur angularly about the patient, along the long axis of the patient, or incorporate both in order to adapt to attenuation differences within the patient.
Figure 1.
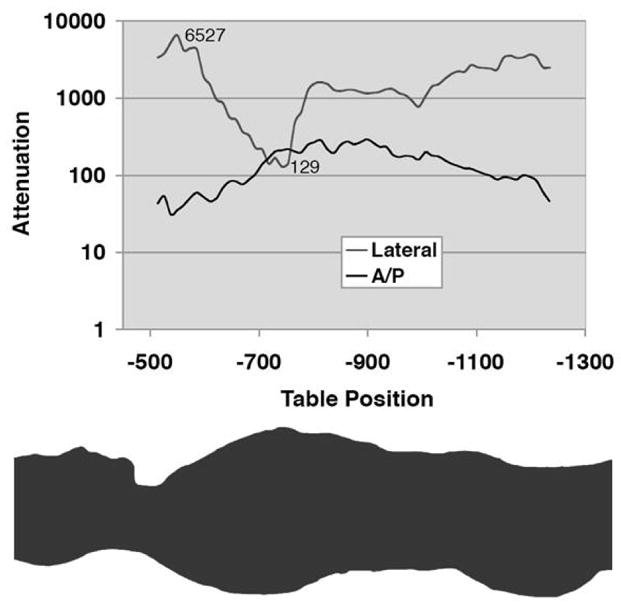
Graph (top) of relative attenuation values as a function of table position and associated body region (bottom) shows almost three orders of magnitude of variation in attenuation, according to body region and projection angle. [Reused with permission 37].
Angular (x,y) mA modulation
Angular (x,y) mA modulation addresses the variation in x-ray attenuation around the patient by varying the mA as the x-ray tube rotates about the patient (e.g. in the A.P. versus lateral direction). The operator chooses the initial mA value, and the mA is modulated upward or downward from the initial value with a period of one gantry rotation. As the x-ray tube rotates between the AP and lateral positions, the mA can be varied according to the attenuation information from the CT radiograph (i.e. Scout image), or in near real-time according to the measured attenuation from the 180° previous projection.
Longitudinal (z) mA modulation
Longitudinal (z) mA modulation addresses the varying attenuation of the patient among anatomic regions by varying the mA along the z axis of the patient (e.g. shoulders versus the abdomen), as shown in Figure 2. Thus, the operator must provide as input to the algorithm the desired level of image quality, the paradigms for which are at present relatively manufacturer-specific.
Figure 2.

Graph of relative tube current superimposed on a CT projection radiograph illustrates the concept of longitudinal dose modulation. The prescribed tube current curve is determined by using attenuation data from the CT projection radiograph and a manufacturer-specific algorithm. [Reused with permission 37].
Angular and Longitudinal (x,y,z) mA modulation
Angular and longitudinal (x,y,z) mA modulation combines the previous two methods to vary the mA both during rotation and along the z axis of the patient. The operator must still indicate the desired level of image quality by one of the following methods. This is the most comprehensive approach to CT dose reduction because the x-ray dose is adjusted according to the patient attenuation in all three dimensions.
Automatic exposure control (AEC)
Overview
It is technologically possible for CT systems to adjust the x-ray tube current in real-time in response to variations in x-ray intensity at the detector 35, 46–48, much as fluoroscopic x-ray systems adjust exposure automatically. The modulation may be fully preprogrammed, occur in near-real time by using a feedback mechanism, or incorporate pre-programming and a feedback loop. These methods of adapting the tube current to patient attenuation, known generically as automatic exposure control (AEC), are analogous to photo-timing in general radiography and have demonstrated reductions in dose of about 20–40% when image quality is appropriately specified. An exception to this trend occurs with obese patients. In large patients, the radiation dose is increased to ensure adequate image quality. However, much of the additional x-ray dose is absorbed by excess adipose tissue. Thus, doses to internal organs do not increase linearly with increases in tube current settings 49, 50. AEC is a broad term that encompasses not only tube current modulation (to adapt to changes in patient attenuation), but also determining and delivering the “right” dose for any patient (infant to obese) in order to achieve the diagnostic task.
Image quality selection paradigms for AEC systems
Each manufacturer of CT systems uses a different method of defining the image quality in the user interface. GE uses a concept known as the Noise Index. The noise index is referenced to the standard deviation of pixel values in a specific size water phantom and is compared to patient attenuation measured from the CT radiograph (Scout) in order to maintain image noise. Toshiba allows two ways to prescribe image quality in their Sure Exposure AEC algorithm: Standard Deviation and Image Quality Level. Like GE’s Noise Index, Sure Exposure also compares the patient’s CT radiograph (Scanogram) data to the standard deviation of a specific-attenuation water phantom. Philips uses a Reference Image from a satisfactory patient exam (Reference Case) stored in the system with which image quality for future exams is to be matched. Siemens uses a Quality Reference mAs to define the effective mAs (=mAs/pitch) required to produce a specific image quality in an 80 kg patient (20 kg for pediatric cases) for a given protocol. For specific patients, the tube current is based on the CT radiograph (Topogram) and fine-tuned by an online feedback system.
Future dose reduction strategies
Adjusting kV based on patient size
There have been several physics and clinical studies on the use of lower tube potential (kV) in CT imaging to improve image quality or reduce radiation dose. The principle behind the benefit of lower kV in some clinical applications is this: The attenuation coefficient of iodine increases as photon energy decreases toward the k-edge energy of 33 keV. In many CT exams involving the use of iodinated contrast media, the superior enhancement of iodine at lower tube potentials improves the conspicuity of hypervascular or hypovascular pathologies. However, the images obtained using lower tube potentials tend to be much noisier, mainly due to the higher absorption of low-energy photons by the patient. Therefore, a tradeoff between image noise and contrast enhancement must be made.
Figure 3a shows the change of iodine CT number with tube potential for three different phantom sizes. The CT numbers of the iodine solution are larger at lower kVs than at higher kVs. With an increase in phantom size, CT numbers decrease due to beam hardening effects. Figure 3b shows, for the same total radiation dose, image noise as the tube potential and phantom size change. For smaller phantom sizes, images acquired at different kVs have almost the same noise levels, with slightly higher noise for images acquired at 80 kV. However, with the increase of the phantom size, lower-kV scans yield images with higher noise levels compared to images attained at higher kVs. Figure 3c combines the information from Figures 3a and 3b to determine the change of contrast to noise ratio (CNR) as a function of tube potential and phantom size, where contrast is defined as the CT number of the iodine solution minus the CT number of background, which in this case was water (CT number ≈0 HU). The benefit of increased contrast enhancement at 80 kV is negated by increased noise for the large phantom size.
Figure 3.


Figure 3a: Graph of the CT number of a 2% iodine solution for small, medium, and large phantoms at various x-ray tube potentials.
Figure 3b: Graph of noise (standard deviation of CT numbers within the water background) in images of small, medium, and large phantoms at different tube potentials.
Figure 3c: Graph of the contrast to noise ratio (CT number of iodine solution divided by the background noise level) in small, medium, and large phantoms at different tube potentials.
Hence, when the patient size is below some threshold, the use of a lower tube potential can generate better image quality than the higher tube potential, for the same radiation dose. Alternatively, dose can be reduced while maintaining the same image quality of a high tube potential image. Consequently, for a given patient size, an optimal tube potential exists that yields the best image quality (in terms of, e.g., CNR, lesion detectability) or the lowest radiation dose. This optimal tube potential is highly dependent on the patient size and the specific diagnostic task. It should be noted that for non-contrast CT exams, the benefit of lower-kV has not been established since soft tissue contrast is not highly dependent on the tube potential.
Iterative reconstruction
Iterative reconstruction techniques have demonstrated the potential for improving image quality and reducing radiation dose in CT 51–55 relative to the currently used filtered back projection techniques. The most noticeable benefit of iterative reconstruction is that it is able to incorporate into the reconstruction process a physical model of the CT system that can accurately characterize the data acquisition process, including noise, beam hardening, scatter, etc. This allows for dramatic improvements in image quality, especially in the case of low-dose CT scans, where the propagation of non-ideal data during the image reconstruction becomes more significant than in routine CT scanning. This benefit has long been utilized by nuclear medicine imaging, where the photon numbers are much smaller than in CT.
Iterative reconstruction is also superior to filtered back projection in handling insufficient data. Recent advances in iterative reconstruction allow a significant reduction in the number of required projection views, while still producing acceptable image quality. Thus, the use of iterative reconstruction techniques has a large potential to substantially reduce the radiation dose in CT 56–58. With computational power growing quickly, the clinical implementation of iterative reconstruction algorithms is within reach 55.
Patient-specific dose reduction strategies
Pregnant patients
Imaging the pregnant patient presents a unique challenge to the radiologist due to the concern of radiation risk to the conceptus (embryo/fetus). Potential effects of radiation on the conceptus include prenatal death, intrauterine growth restriction, small head size, severe mental retardation, reduced intelligence quotient, organ malformation, and childhood cancer. The probability of any effects depend on the radiation dose to the conceptus (Table 2) 15, 17, 59–66.
Table 2.
Probability of birthing healthy children with no malformation or subsequent childhood cancer development for various radiation exposures during pregnancy (Adapted from Wagner, et. al. 1982 and 1997).
| Dose to Conceptus (mGy) | Child with No Malformation (Percentage) | Child Will NOT Develop Cancer (Percentage) | Child Will NOT Develop Cancer or Have a Malformation (Percentage) |
|---|---|---|---|
| 0 | 96 | 99.93 | 95.93 |
| 0.5 | 95.999 | 99.926 | 95.928 |
| 1.0 | 95.998 | 99.921 | 95.922 |
| 2.5 | 95.995 | 99.908 | 95.91 |
| 5.0 | 95.99 | 99.89 | 95.88 |
| 10.0 | 95.98 | 99.84 | 95.83 |
| 50.0 | 95.90 | 99.51 | 95.43 |
| 100.0 | 95.80 | 99.07 | 94.91 |
Common indications for CT scanning in a pregnant patient include suspected appendicitis, pulmonary embolism, and urinary tract calculi. To minimize radiation exposure to the fetus, it is important to determine if the necessary diagnostic information can be obtained from an alternative non-radiation based imaging modality. For non-acute symptoms, radiologists and physicians must also decide if immediate CT scanning is required or if CT scanning can be postponed until after the delivery.
For scanning body regions outside the abdomen and pelvis, such as chest CT for suspected pulmonary embolism, the dose to the fetus is very low (< 0.1 mGy) because the scattered radiation levels fall off quickly away from the scan volume. For CT in a pregnant patient with suspected appendicitis, the scan volume should be restricted to the necessary anatomy, and dual-pass (with and without contrast) studies should be avoided, if possible 67, 68. In CT for renal calculi in a pregnant patient, fetal dose can be reduced with use of low mAs, high pitch and a limited scan range without substantially compromising the study quality 69. For abdominal-pelvic CT, which directly irradiates the fetus, scan parameters (such as wider beam collimation, higher pitch, and lower mAs, kV and scan range) can be selected to reduce the fetal dose to approximately 23 mGy per scan phase. Thus, even for a routine dose-level, bi-phase CT exam of the abdomen and pelvis, the probability of birthing a healthy baby decreases by only 0.5% (see Table 2).
Pediatric patients
The risk of cancer in children due to radiation exposure is about two to three times higher than adults because pediatric patients have a longer life expectancy and their organs are more sensitive to radiation damage4. For newborns, the risk of cancer induction is essentially the same as in the second and third trimester of pregnancy (see Table 2).
The best way to reduce the radiation dose to pediatric patients is to avoid unnecessary CT exams and to look for alternative diagnostic imaging modalities with less or no exposure to ionizing radiation. Pediatric protocols with scanning parameters specifically designed for children must be used70, 71. These protocols usually include tube current modulation37, 46, a child-size bowtie filter and scanning field of view (FOV), or a weight or size-based technique chart that can determine the appropriate kV and/or mAs for each patient72, 73.
Automatic tube current modulation and manual technique charts are currently widely used. Additionally, lower kV values may be used, depending on patient size and clinical indication. For pediatric patients, due to less attenuation in the body, the noise level does not increase significantly with the decrease of kV for the same radiation dose. Therefore, for iodine contrast-enhanced exams, a lower kV can be used to improve the contrast enhancement without increasing the noise. Because of this, the benefit of image quality improvement or dose reduction is much more significant than in adult patients. Lower-kV techniques have been actively investigated and are beginning to be widely used in pediatric CT 24, 40, 72, 73.
There are several factors which should be taken into account when lower-kV techniques are used in practice. First, due to the less efficient x-ray production of the tube at low kV values, the mAs has to be increased to avoid excessive noise levels. Second, for certain sized patients, a lower kV may not be appropriate. To address these issues, a weight or size-based kV/mAs technique chart should be used. Third, in order to avoid motion artifacts and decrease scan times in pediatric patients, a fast rotation time and a high helical pitch are desirable, which often limit the maximum mAs that can be used because of tube current limitations. In this situation, a higher kV may be necessary to avoid compromising the exam quality. Finally, although lower kV increases the contrast of iodine, it may not increase the contrast of tissues, lesions, and other pathological structures without iodine uptake. Thus, the use of lower-kV has to be carefully evaluated by radiologists and physicists for every particular type of pediatric exam.
Other specific dose reduction strategies
Cardiac CT
Dose in cardiac CT is a considerably more complex issue compared to non-cardiac CT applications. There are two major reasons for this complexity. The first reason is that dose, noise, and pitch have different relationships in cardiac CT compared to non-cardiac spiral CT74. The second reason is that dose in cardiac CT can be dependent on the patient’s heart rate (HR), depending on the equipment used.
In non-cardiac multi–detector CT (MDCT), noise depends on pitch. However, in cardiac spiral CT, noise is independent of pitch and depends only on the tube current-time product (mAs)74. Additionally, because only a partial amount of the projection data from one gantry rotation is used for image reconstruction (to optimize the temporal resolution), relatively high mAs values are needed to provide an acceptable noise level for cardiac CT imaging, especially for cardiac CTA exams, which require the use of thin slices for better visualization of the coronary arteries.
A combination of relatively high mAs values with the low pitch values required in cardiac CT (dose is proportional to mAs/pitch) explains why cardiac CT exams are associated with a higher radiation dose. Effective doses up to 21 mSv have been reported in the literature75, and the recent review by Achenbach et al76 claims that maximum organ dose values (based on Monte-Carlo calculations) delivered during cardiac CT exams can be as high as 50–100 mGv when no dose reduction measures are taken.
ECG-based tube current modulation is an important dose reduction tool in cardiac CT37, 77. The principle of ECG-based mA modulation is illustrated by Figure 4. The percent dose reduction using ECG-based tube current modulation is higher for patients with slow heart rates compared to those with high heart rates, as the maximum mA time period is a smaller percentage of the R-R time interval at low heart rate.
Figure 4.

Depiction of ECG-based modulation of the tube current. The width of the temporal window having the maximum tube current (Max mA) can be selected by the user, while the temporal width of the image reconstruction window is fixed (Recon). For full quality images, the reconstruction window (darker grey time interval) should fall within the maximum mA window (lighter grey time interval). [Courtesy of Suhny Abbara, Massachusetts General Hospital]
Additionally, the width of the maximum mA window must be carefully chosen to make sure that the data for the best cardiac phase (the one with the least motion artifact) will be acquired with maximum tube current (hence, best image quality). Failure to properly set-up the ECG-based tube current modulation parameters may compromise the diagnostic quality of the cardiac exam. According to the dual-source coronary CTA study by Weustink et al, optimal windows for ECG-based tube current modulation for low (HR≤65 bpm), intermediate (65<HR<80 bpm), and high (HR≥80 bpm) heart rates were at 60–76 %, 30–77%, and 31–47% of the R-R interval, respectively78.
Finally, for patients with a very irregular heart rate, using ECG-based tube current modulation can compromise the diagnostic quality of the images if the optimal reconstruction window occurs during the reduced tube current interval. Some systems address this concern by automatically increasing the tube current to the maximum level when a statistical trend-analysis algorithm recognizes an R-R interval that is significantly different from the previous rhythm79.
One of the earliest studies of ECG-based tube current modulation reported dose savings of 30–50% for 4-slice CT77. A later study by Hausleiter et al80 reported an effective dose estimates for coronary CTA using 64-slice CT of approximately 9.4 mSv with ECG-based tube current modulation and 14.8 mSv without tube current modulation80. One study of dual-source coronary CTA reported mean effective dose values of 7.8–8.8 mSv81, while another reported effective doses of 6.8, 13.4, and 4.2 mSv for low, intermediate and high HR, respectively, when using the optimal windows for ECG-based tube current modulation78. The higher dose at intermediate HR is due to the need for a wider maximum tube current window.
ECG modulation cannot be combined with some other types of tube current modulation, such as angular modulation. While it is possible to use z-modulation in cardiac CT, this is not widely available. The role of AEC in cardiac mode is typically limited to automatically adjusting the mAs values based on patient size. Alternatively, technique charts may be used to manually choose the proper mAs settings based on patient size, the type of cardiac exam (e.g., coronary calcium scoring vs. coronary CTA), and the noise level accepted in the clinical practice. Appropriate use of lower kV values (80 or 100 kV) for coronary CTA exams of smaller patients can further reduce radiation dose without compromising the image quality. A recent study by Leschka et al82 showed that dual-source coronary CTA with 100 kV is feasible in patients of normal weight and can produce a higher contrast–to-noise ratio at estimated effective doses as low as 4.4 mSv. In a study by Achenbach et al76, a 74-year-old patient with 63 kg body weight was scanned using 80 kV tube current and ECG-based tube current modulation, resulting in fully diagnostic image quality at an estimated effective dose of 3.0 mSv.
Additional dose reductions can be achieved using prospective ECG-triggering (i.e. “step and shoot’ acquisitions). The lack of overlapping beams at low spiral pitch values makes this mode very dose efficient. However, this mode is not as reliable as the conventional spiral, retrospectively-gated mode and requires a careful selection of patients having stable, low heart rates. Since there are no data collected outside the narrow acquisition window predicted to correspond to the best phase of the cardiac cycle, any sudden change in cardiac rhythm (e.g., ectopic beat) can ruin image quality for the portion of the heart included in that axial scan. Nevertheless, a recent study by Scheffel et al83 concluded that prospectively triggered DSCT coronary angiography allows for the accurate diagnosis of significant coronary stenoses in patients with a regular heart rate at a very low radiation dose. For 120 selected patients having an average heart rate of 59 ± 6 bpm (range 44–69 bpm), the reported mean effective dose was 2.5 ± 0.8 mSv (range 1.2–4.4 mSv).
The susceptibility of prospectively triggered coronary CTA to artifacts caused by variations in cardiac cycle length or by the occurrence of ectopic beats can be reduced by using adaptively triggered sequential scans with dynamic temporal windows, where triggering for each cardiac cycle is adjusted according to the ECG trend and variability. In a study where cardiac CT scans were simulated on the basis of 60 ECGs recorded during actual coronary CTA exams, the adaptively triggered sequential scans provided 68% dose reduction, relative to spiral cardiac CT with constant tube current, without compromising the reliability of image quality84. The standard sequential mode without adaptive triggering provided improved dose reductions (75%), but suffered from inconsistent availability of the optimal cardiac phase, missing it in 18% of the cases.
Selective In-plane Shielding
Selective shielding of radiation sensitive tissues and organs during CT scanning has been proposed and products to implement this are commercially available. Their use is not generally recommended however because the dose reduction they provide can be readily achieved by decreasing x-ray tube current, which does not introduce noise or increase beam-hardening artifacts.
Shields made of thin sheets of flexible latex impregnated with bismuth and shaped to cover the eye lens, thyroid, or breasts can be used, respectively, during brain, cervical spine, or chest CT exams. Dose savings to the superficially located target organ when using such shields have been reported to be 40% to 67% for adults 85–89 and 30% to 40% for children 90, 91. The majority of these studies reported artifacts near the shields. Additionally, these studies overestimated organ dose reductions by assuming that organ doses are equivalent to the measured skin dose reductions.
A quantitative study by Geleijns et al.92 assessed the tradeoff between absorbed dose and image quality for the use of selective shields. Using commercially available shields and an anthropomorphic phantom, image noise was experimentally quantified by the standard deviation of CT numbers in the target organ. Absorbed organ doses were also computed using a validated Monte Carlo method. With use of the shields, organ dose reductions of 26, 27 and 30% were found for the thyroid, eye lens and breast, respectively, contrary to the larger savings reported elsewhere. For each organ, dose reduction was accompanied by increased noise and artifacts. This was most marked and most varied near the breast, where the noise increase ranged from a minimum of 50% (8 HU increased to 12 HU) near the shield center to a maximum of 100% (7.5 HU increased to 15 HU) near the shield edge. They additionally report that the same 30% dose reduction could be achieved by decreasing the x-ray tube current by 30%, yet with a smaller and more uniform noise increase of 20 to 30%. This is because while the dose shield attenuates the anterior x-ray beam and hence decreases anterior organ dose, it also attenuates x-rays coming from the posterior direction that have already contributed to organ dose and contain important image information.
IV. Conclusion
In recent years, the media has focused on the potential danger of radiation exposure from CT, even though the potential benefit of a medically indicated CT far outweighs the potential risks. Importantly, however, this attention has reminded the radiology community that doses must be “As Low As Reasonably Achievable” while maintaining diagnostic image quality. To satisfy the ALARA principle, the dose reduction strategies described in this paper must be well understood and properly used. The use of CT must also be justified for the specific diagnostic task.
Acknowledgments
The authors would like to express their gratitude to Kris Nunez and Megan Jacobsen for their help with the manuscript preparation and submission.
Contributor Information
Andrew N. Primak, Email: primak.andrew@mayo.edu.
Natalie Braun, Email: brau0291@umn.edu.
James Kofler, Email: kofler.james@mayo.edu.
Lifeng Yu, Email: yu.lifeng@mayo.edu.
Jodie Christner, Email: christner.jodie@mayo.edu.
References
- 1.Brenner DJ, Hall EJ. Computed tomography--an increasing source of radiation exposure. N Engl J Med. 2007 Nov 29;357(22):2277–2284. doi: 10.1056/NEJMra072149. [DOI] [PubMed] [Google Scholar]
- 2.National Council on Radiation Protection and Measurements. Ionizing radiation exposure of the population of the United States. Bethesda, MD: National Council on Radiation Protection and Measurements; 1987. Report No. 93. NCRP Report No. 93. [Google Scholar]
- 3.Donnelly LF, Emery KH, Brody AS, et al. Minimizing radiation dose for pediatric body applications of single-detector helical CT: Strategies at a large children’s hospital. AJR. 2001;176:303–306. doi: 10.2214/ajr.176.2.1760303. [DOI] [PubMed] [Google Scholar]
- 4.Brenner DJ, Elliston CD, Hall EJ, Berdon WE. Estimated risks of radiation-induced fatal cancer from pediatric CT. AJR. 2001;176:289–296. doi: 10.2214/ajr.176.2.1760289. [DOI] [PubMed] [Google Scholar]
- 5.The Associated Press. Report Links Increased Cancer Risk to CT Scans. New York Times. 2007 November 29; [Google Scholar]
- 6.Khamsi R. NewScientist.com News Service. May 11, 2007. CT scan radiation can equal nuclear bomb exposure. [Google Scholar]
- 7.Jessen KA, Panzer W, Shrimpton PC, et al. EUR 16262: European Guidelines on Quality Criteria for Computed Tomography. Paper presented at: Office for Official Publications of the European Communities; Luxembourg. 2000. [Google Scholar]
- 8.Nagel HD. Radiation exposure in computed tomography. 2. Frankfurt: COCIR; 2000. [Google Scholar]
- 9.Shope TB, Gagne RM, Johnson GC. A method for describing the doses delivered by transmission x-ray computed tomography. Med Phys. 1981;8(4):488–495. doi: 10.1118/1.594995. [DOI] [PubMed] [Google Scholar]
- 10.American Association of Physicists in Medicine. Standardized methods for measuring diagnostic x-ray exposures. New York: AAPM; Jul, 1990. Report no. 31. [Google Scholar]
- 11.McNitt-Gray MF. AAPM/RSNA Physics Tutorial for Residents: Topics in CT. Radiation dose in CT. Radiographics. 2002 Nov-Dec;22(6):1541–1553. doi: 10.1148/rg.226025128. [DOI] [PubMed] [Google Scholar]
- 12.American Association of Physicists in Medicine. The measurement, reporting and management of radiation dose in CT. College Park, MD: 2008. Report No 96. [Google Scholar]
- 13.International Electrotechnical Commission. Medical Electrical Equipment. Part 2–44: Particular requirements for the safety of x-ray equipment for computed tomography. 2.1. International Electrotechnical Commission (IEC) Central Office; Geneva, Switzerland: 2002. IEC publication No. 60601–2–44. [Google Scholar]
- 14.Boone JM. The trouble with CTDI 100. Med Phys. 2007 Apr;34(4):1364–1371. doi: 10.1118/1.2713240. [DOI] [PubMed] [Google Scholar]
- 15.International Commission on Radiological Protection. Recommendations of the International Commission on Radiological Protection (Report 60) Annals of the ICRP 1991. 1990;21:1–3. [PubMed] [Google Scholar]
- 16.McCollough CH, Schueler BA. Calculation of effective dose. Med Phys. 2000 May;27(5):828–837. doi: 10.1118/1.598948. [DOI] [PubMed] [Google Scholar]
- 17.International Commission on Radiological Protection. Recommendations of the International Commission on Radiological Protection (ICRP #26) Oxford: The International Commission on Radiological Protection; 1977. ICRP Publication 26. [Google Scholar]
- 18.International Commission on Radiological Protection. 2007 recommendations of the International Commission on Radiological Protection (ICRP Publication 103) Ann ICRP. 2007;37:1–332. doi: 10.1016/j.icrp.2007.10.003. [DOI] [PubMed] [Google Scholar]
- 19.Cristy M. Mathematical phantoms representing children of various ages for use in estimates of internal dose. Oak Ridge, TN: Oak Ridge National Laboratory; 1980. NUREG/CR-1159, ORNL/NUREG/TM-367. [Google Scholar]
- 20.McCollough CH. Patient dose in cardiac computed tomography. Herz. 2003 Feb;28(1):1–6. doi: 10.1007/s00059-003-2447-2. [DOI] [PubMed] [Google Scholar]
- 21.Haaga JR. Radiation dose management: weighing risk versus benefit. AJR Am J Roentgenol. 2001 Aug;177(2):289–291. doi: 10.2214/ajr.177.2.1770289. [DOI] [PubMed] [Google Scholar]
- 22.Nickoloff EL, Alderson PO. Radiation exposures to patients from CT: reality, public perception, and policy. AJR Am J Roentgenol. 2001 Aug;177(2):285–287. doi: 10.2214/ajr.177.2.1770285. [DOI] [PubMed] [Google Scholar]
- 23.Wilting JE, Zwartkruis A, van Leeuwen MS, Timmer J, Kamphuis AG, Feldberg M. A rational approach to dose reduction in CT: individualized scan protocols. Eur Radiol. 2001;11(12):2627–2632. doi: 10.1007/s003300101039. [DOI] [PubMed] [Google Scholar]
- 24.Boone JM, Geraghty EM, Seibert JA, Wootton-Gorges SL. Dose reduction in pediatric CT: a rational approach. Radiology. 2003 Aug;228(2):352–360. doi: 10.1148/radiol.2282020471. [DOI] [PubMed] [Google Scholar]
- 25.Linton OW, Mettler FA., Jr National conference on dose reduction in CT, with an emphasis on pediatric patients. Am J Roentgenol. 2003 Aug;181(2):321–329. doi: 10.2214/ajr.181.2.1810321. [DOI] [PubMed] [Google Scholar]
- 26.Frush DP, Donnelly LF, Rosen NS. Computed tomography and radiation risks: what pediatric health care providers should know. Pediatrics. 2003 Oct;112(4):951–957. doi: 10.1542/peds.112.4.951. [DOI] [PubMed] [Google Scholar]
- 27.Golding SJ, Shrimpton PC. Commentary. Radiation dose in CT: are we meeting the challenge? Br J Radiol. 2002 Jan;75(889):1–4. doi: 10.1259/bjr.75.889.750001. [DOI] [PubMed] [Google Scholar]
- 28.FDA public health notification: reducing radiation risk from computed tomography for pediatric and small adult patients. Pediatr Radiol. 2002 Apr;32(4):314–316. doi: 10.1007/s00247-002-0687-6. [DOI] [PubMed] [Google Scholar]
- 29.Kalra MK, Maher MM, Toth TL, et al. Strategies for CT radiation dose optimization. Radiology. 2004 Mar;230(3):619–628. doi: 10.1148/radiol.2303021726. [DOI] [PubMed] [Google Scholar]
- 30.Cody DD, Moxley DM, Krugh KT, O’Daniel JC, Wagner LK, Eftekhari F. Strategies for formulating appropriate MDCT techniques when imaging the chest, abdomen, and pelvis in pediatric patients. AJR Am J Roentgenol. 2004 Apr;182(4):849–859. doi: 10.2214/ajr.182.4.1820849. [DOI] [PubMed] [Google Scholar]
- 31.International Commission on Radiological Protection. Managing patient dose in computed tomography, ICRP Publication 87. Ann ICRP. 2000;30(4):7–45. doi: 10.1016/s0146-6453(01)00049-5. [DOI] [PubMed] [Google Scholar]
- 32.American College of Radiology. The American College of Radiology Appropriateness Criteria. 2008. [Google Scholar]
- 33.The Royal College of Radiologists. Making the best use of clinical radiology services: referral guidelines. 6. London: 2007. [DOI] [PubMed] [Google Scholar]
- 34.FDA. FDA public health notification: reducing radiation risk from computed tomography for pediatric and small adult patients. Pediatr Radiol. 2002;32:314–316. doi: 10.1007/s00247-002-0687-6. [DOI] [PubMed] [Google Scholar]
- 35.McCollough CH. Automatic exposure control in CT: are we done yet? Radiology. 2005 Dec;237(3):755–756. doi: 10.1148/radiol.2373051151. [DOI] [PubMed] [Google Scholar]
- 36.Funama Y, Awai K, Nakayama Y, et al. Radiation dose reduction without degradation of low-contrast detectability at abdominal multisection CT with a low-tube voltage technique: phantom study. Radiology. 2005 Dec;237(3):905–910. doi: 10.1148/radiol.2373041643. [DOI] [PubMed] [Google Scholar]
- 37.McCollough CH, Bruesewitz MR, Kofler JM., Jr CT dose reduction and dose management tools: overview of available options. Radiographics. 2006 Mar-Apr;26(2):503–512. doi: 10.1148/rg.262055138. [DOI] [PubMed] [Google Scholar]
- 38.Nakayama Y, Awai K, Funama Y, et al. Abdominal CT with low tube voltage: preliminary observations about radiation dose, contrast enhancement, image quality, and noise. Radiology. 2005 Dec;237(3):945–951. doi: 10.1148/radiol.2373041655. [DOI] [PubMed] [Google Scholar]
- 39.Huda W, Ravenel JG, Scalzetti EM. How do radiographic techniques affect image quality and patient doses in CT? Semin Ultrasound CT MR. 2002 Oct;23(5):411–422. doi: 10.1016/s0887-2171(02)90012-0. [DOI] [PubMed] [Google Scholar]
- 40.Siegel MJ, Schmidt B, Bradley D, Suess C, Hildebolt C. Radiation dose and image quality in pediatric CT: effect of technical factors and phantom size and shape. Radiology. 2004;233(2):515–522. doi: 10.1148/radiol.2332032107. [DOI] [PubMed] [Google Scholar]
- 41.McCollough CH, Zink FE, Kofler J, Matsumoto JS, Thomas KB, Hoffman AD. Dose optimization in CT: creation, implementation and clinical acceptance of size-based technique charts. Radiology. 2002;225:591. [Google Scholar]
- 42.Kalra MK, Maher MM, Toth TL, et al. Techniques and applications of automatic tube current modulation for CT. Radiology. 2004 Dec;233(3):649–657. doi: 10.1148/radiol.2333031150. [DOI] [PubMed] [Google Scholar]
- 43.Graser A, Wintersperger BJ, Suess C, Reiser MF, Becker CR. Dose reduction and image quality in MDCT colonography using tube current modulation. AJR Am J Roentgenol. 2006 Sep;187(3):695–701. doi: 10.2214/AJR.05.0662. [DOI] [PubMed] [Google Scholar]
- 44.Greess H, Wolf H, Baum U, et al. Dose reduction in computed tomography by attenuation-based, on-line modulation of tube current: Evaluation of six anatomical regions. Eur Radiol. 2000;10(2):391–394. doi: 10.1007/s003300050062. [DOI] [PubMed] [Google Scholar]
- 45.Mulkens T, Bellinck P, Baeyaert M, et al. Use of an automatic exposure control mechanism for dose optimization in multi-detector row CT examinations: Clinical evaluation. Radiology. 2005;237(1):213–223. doi: 10.1148/radiol.2363041220. [DOI] [PubMed] [Google Scholar]
- 46.Gies M, Kalender WA, Wolf H, Suess C, Madsen M. Dose reduction in CT by anatomically adapted tube current modulation: Simulation studies. Medical Physics. 1999;26(11):2235–2247. doi: 10.1118/1.598779. [DOI] [PubMed] [Google Scholar]
- 47.Kalender WA, Wolf H, Suess C. Dose reduction in CT by anatomically adapted tube current modulation: Phantom measurements. Med Phys. 1999;26(11):2248–2253. doi: 10.1118/1.598738. [DOI] [PubMed] [Google Scholar]
- 48.Haaga JR, Miraldi F, MacIntyre W, LiPuma JP, Bryan PJ, Wiesen E. The effect of mAs variation upon computed tomography image quality as evaluated by in vivo and in vitro studies. Radiology. 1981;138(2):449–454. doi: 10.1148/radiology.138.2.7455129. [DOI] [PubMed] [Google Scholar]
- 49.Schmidt B. Dose calculations for Computed Tomography. Reports from the Insitute of Medical Physiks. 2001:7. [Google Scholar]
- 50.Schmidt B, Kalender WA. A fast voxel-based Monte Carlo method for scanner- and patient-specific dose calculations in computed tomography. In: Guerra AD, editor. Physica Medica. Vol. 18. Erlangen, Germany: European Journal of Medical Physics; 2002. pp. 43–53. [Google Scholar]
- 51.Nuyts J, De Man B, Dupont P, Defrise M, Suetens P, Mortelmans L. Iterative reconstruction for helical CT: a simulation study. Phys Med Biol. 1998 Apr;43(4):729–737. doi: 10.1088/0031-9155/43/4/003. [DOI] [PubMed] [Google Scholar]
- 52.Fessler JA, Ficaro EP, Clinthorne NH, Lange K. Grouped-coordinate ascent algorithms for penalized-likelihood transmission image reconstruction. IEEE Trans Med Imaging. 1997 Apr;16(2):166–175. doi: 10.1109/42.563662. [DOI] [PubMed] [Google Scholar]
- 53.Elbakri IA, Fessler JA. Statistical image reconstruction for polyenergetic X-ray computed tomography. IEEE Trans Med Imaging. 2002 Feb;21(2):89–99. doi: 10.1109/42.993128. [DOI] [PubMed] [Google Scholar]
- 54.Lasio GM, Whiting BR, Williamson JF. Statistical reconstruction for x-ray computed tomography using energy-integrating detectors. Phys Med Biol. 2007 Apr 21;52(8):2247–2266. doi: 10.1088/0031-9155/52/8/014. [DOI] [PubMed] [Google Scholar]
- 55.Thibault JB, Sauer KD, Bouman CA, Hsieh J. A three-dimensional statistical approach to improved image quality for multislice helical CT. Med Phys. 2007 Nov;34(11):4526–4544. doi: 10.1118/1.2789499. [DOI] [PubMed] [Google Scholar]
- 56.Candes EJ, Romberg J, Tao T. Robust uncertainty principles: Exact signal reconstruction from highly incomplete frequency information. Ieee Transactions on Information Theory. 2006 FEB;52(2):489–509. [Google Scholar]
- 57.Sidky EY, Kao CM, Pan XH. Accurate image reconstruction from few-views and limited-angle data in divergent-beam CT. Journal of X-Ray Science and Technology. 2006;14(2):119–139. [Google Scholar]
- 58.Chen GH, Tang J, Leng S. Prior image constrained compressed sensing (PICCS): a method to accurately reconstruct dynamic CT images from highly undersampled projection data sets. Med Phys. 2008 Feb;35(2):660–663. doi: 10.1118/1.2836423. [DOI] [PMC free article] [PubMed] [Google Scholar]
- 59.Wagner LK, Lester RG, Saldana LR. Exposure of the Pregnant Patient to Diagnostic Radiations: A Guide to Medical Management. Madison: Medical Physics Publishing; 1997. [Google Scholar]
- 60.Wagner LK, Hayman LA. Pregnancy and women radiologists. Radiology. 1982 Nov;145(2):559–562. doi: 10.1148/radiology.145.2.7134471. [DOI] [PubMed] [Google Scholar]
- 61.International Commission on Radiological Protection. Developmental Effects of Irradiation on the Brain of the Embryo and Fetus. Ann ICRP. 1986;16(4) doi: 10.1016/0146-6453(86)90011-4. [DOI] [PubMed] [Google Scholar]
- 62.International Commission on Radiological Protection. Pregnancy and medical radiation. 1999 ICRP Publication No 84. [Google Scholar]
- 63.National Council on Radiation Protection and Measurements. Medical radiation exposure of pregnant and potentially pregnant women; Paper presented at: National Council on Radiation Protection and Measurements; 1977. NCRP Report No. 54. [Google Scholar]
- 64.National Council on Radiation Protection and Measurements. Recommendations on limits for exposure to ionizing radiation. Bethesda, MD: National Council on Radiation Protection and Measurements; 1987. NCRP Report No. 90. [Google Scholar]
- 65.National Council on Radiation Protection and Measurements. Risk estimates for radiation protection. Bethesda, MD: NCRP; 1993. NCRP Report No. 115. [Google Scholar]
- 66.American Association of Physicists in Medicine. A primer on low-level ionizing radiation and its biological effects. New York: AAPM; 1986. Report no. 18. [Google Scholar]
- 67.Wagner LK, Huda W. When a pregnant woman with suspected appendicitis is referred for a CT scan, what should a radiologist do to minimize potential radiation risks? Pediatric Radiology. 2004;34(7):589–590. doi: 10.1007/s00247-004-1206-8. [DOI] [PubMed] [Google Scholar]
- 68.Castro MA, Shipp TD, Castro EE, Ouzounian J, Rao P. The use of helical computed tomography in pregnancy for the diagnosis of acute appendicitis. American Journal of Obstetrics and Gynecology. 2001;184(5):954–957. doi: 10.1067/mob.2001.111721. [DOI] [PubMed] [Google Scholar]
- 69.Forsted DH. CT of pregnant women for urinary tract calculi, pulmonary thromboembolism, and acute appendicitis. Am J Roentgenol. 2002 May 1;178(5):1285. doi: 10.2214/ajr.178.5.1781285. [DOI] [PubMed] [Google Scholar]
- 70.Huda W, Bushong SC. In x-ray computed tomography, technique factors should be selected appropriate to patient size. Med Phys. 2001 Aug;28(8):1543–1545. doi: 10.1118/1.1388903. [DOI] [PubMed] [Google Scholar]
- 71.Frush DP, Donnelly LF. Helical CT in children: technical considerations and body applications. Radiology. 1998 Oct;209(1):37–48. doi: 10.1148/radiology.209.1.9769810. [DOI] [PubMed] [Google Scholar]
- 72.Hollingsworth C, Frush DP, Cross M, Lucaya J. Helical CT of the body: a survey of techniques used for pediatric patients. AJR Am J Roentgenol. 2003 Feb;180(2):401–406. doi: 10.2214/ajr.180.2.1800401. [DOI] [PubMed] [Google Scholar]
- 73.Paterson A, Frush DP. Dose reduction in paediatric MDCT: general principles. Clin Radiol. 2007 Jun;62(6):507–517. doi: 10.1016/j.crad.2006.12.004. [DOI] [PubMed] [Google Scholar]
- 74.Primak AN, McCollough CH, Bruesewitz MR, Zhang J, Fletcher JG. Relationship between noise, dose, and pitch in cardiac multi-detector row CT. Radiographics. 2006 Nov–Dec;26(6):1785–1794. doi: 10.1148/rg.266065063. [DOI] [PubMed] [Google Scholar]
- 75.Mollet NR, Cademartiri F, van Mieghem CA, et al. High-resolution spiral computed tomography coronary angiography in patients referred for diagnostic conventional coronary angiography. Circulation. 2005 Oct 11;112(15):2318–2323. doi: 10.1161/CIRCULATIONAHA.105.533471. [DOI] [PubMed] [Google Scholar]
- 76.Achenbach S, Anders K, Kalender WA. Dual-source cardiac computed tomography: image quality and dose considerations. Eur Radiol. 2008 Feb 26; doi: 10.1007/s00330-008-0883-3. [DOI] [PubMed] [Google Scholar]
- 77.Jakobs TF, Becker CR, Ohnesorge B, et al. Multislice helical CT of the heart with retrospective ECG gating: reduction of radiation exposure by ECG-controlled tube current modulation. Eur Radiol. 2002;12(5):1081–1086. doi: 10.1007/s00330-001-1278-x. [DOI] [PubMed] [Google Scholar]
- 78.Weustink AC, Mollet NR, Pugliese F, et al. Optimal electrocardiographic pulsing windows and heart rate: effect on image quality and radiation exposure at dual-source coronary CT angiography. Radiology. 2008 Sep;248(3):792–798. doi: 10.1148/radiol.2483072098. [DOI] [PubMed] [Google Scholar]
- 79.McCollough CH, Primak AN, Saba O, et al. Dose performance of a 64-channel dual-source CT scanner. Radiology. 2007 Jun;243(3):775–784. doi: 10.1148/radiol.2433061165. [DOI] [PubMed] [Google Scholar]
- 80.Hausleiter J, Meyer T, Hadamitzky M, et al. Radiation dose estimates from cardiac multislice computed tomography in daily practice: impact of different scanning protocols on effective dose estimates. Circulation. 2006 Mar 14;113(10):1305–1310. doi: 10.1161/CIRCULATIONAHA.105.602490. [DOI] [PubMed] [Google Scholar]
- 81.Stolzmann P, Scheffel H, Rentsch K, et al. Dual-energy computed tomography for the differentiation of uric acid stones: ex vivo performance evaluation. Urol Res. 2008 Jun 11; doi: 10.1007/s00240-008-0140-x. [DOI] [PubMed] [Google Scholar]
- 82.Leschka S, Stolzmann P, Schmid FT, et al. Low kilovoltage cardiac dual-source CT: attenuation, noise, and radiation dose. Eur Radiol. 2008 Apr 8; doi: 10.1007/s00330-008-0966-1. [DOI] [PubMed] [Google Scholar]
- 83.Scheffel H, Alkadhi H, Leschka S, et al. Low-Dose CT Coronary Angiography in the Step-and-Shoot Mode: Diagnostic Performance. Heart. 2008 Jun 2; doi: 10.1136/hrt.2008.149971. [DOI] [PubMed] [Google Scholar]
- 84.Raupach R, Bruder H, Primak AN, Liu X, McCollough CH, Flohr TG. ECR 2008 Book of Abstracts. Supplement 1. Vol. 18. Vienna: ECR; 2008. Dose reduction strategies for CT cardiac imaging (Abstr. B-654) p. 292. [Google Scholar]
- 85.Hein E, Rogalla P, Klingebiel R, Hamm B. Low-dose CT of the paranasal sinuses with eye lens protection: effect on image quality and radiation dose. Eur Radiol. 2002 Jul;12(7):1693–1696. doi: 10.1007/s00330-001-1279-9. [DOI] [PubMed] [Google Scholar]
- 86.Hopper KD, King SH, Lobell ME, TenHave TR, Weaver JS. The breast: in-plane x-ray protection during diagnostic thoracic CT--shielding with bismuth radioprotective garments. Radiology. 1997 Dec;205(3):853–858. doi: 10.1148/radiology.205.3.9393547. [DOI] [PubMed] [Google Scholar]
- 87.Hopper KD. Orbital, thyroid, and breast superficial radiation shielding for patients undergoing diagnostic CT. Semin Ultrasound CT MR. 2002 Oct;23(5):423–427. doi: 10.1016/s0887-2171(02)90013-2. [DOI] [PubMed] [Google Scholar]
- 88.Hopper KD, Neuman JD, King SH, Kunselman AR. Radioprotection to the eye during CT scanning. AJNR Am J Neuroradiol. 2001 Jun–Jul;22(6):1194–1198. [PMC free article] [PubMed] [Google Scholar]
- 89.McLaughlin DJ, Mooney RB. Dose reduction to radiosensitive tissues in CT. Do commercially available shields meet the users’ needs? Clin Radiol. 2004 May;59(5):446–450. doi: 10.1016/j.crad.2003.10.016. [DOI] [PubMed] [Google Scholar]
- 90.Fricke BL, Donnelly LF, Frush DP, et al. In-plane bismuth breast shields for pediatric CT: effects on radiation dose and image quality using experimental and clinical data. AJR Am J Roentgenol. 2003 Feb;180(2):407–411. doi: 10.2214/ajr.180.2.1800407. [DOI] [PubMed] [Google Scholar]
- 91.Perisinakis K, Raissaki M, Theocharopoulos N, Damilakis J, Gourtsoyiannis N. Reduction of eye lens radiation dose by orbital bismuth shielding in pediatric patients undergoing CT of the head: a Monte Carlo study. Med Phys. 2005 Apr;32(4):1024–1030. doi: 10.1118/1.1881852. [DOI] [PubMed] [Google Scholar]
- 92.Geleijns J, Salvado Artells M, Veldkamp WJ, Lopez Tortosa M, Calzado Cantera A. Quantitative assessment of selective in-plane shielding of tissues in computed tomography through evaluation of absorbed dose and image quality. Eur Radiol. 2006 Oct;16(10):2334–2340. doi: 10.1007/s00330-006-0217-2. [DOI] [PubMed] [Google Scholar]
- 93.Bongartz G, Golding S, Jurik A, et al. European Guidelines for Multislice Computed Tomography. Funded by the European Commission. Contract number FIGM-CT2000–20078-CT-TIP. 2004 March; [Google Scholar]
- 94.Shrimpton PC, Hillier MC, Lewis MA, Dunn M. National survey of doses from CT in the UK: 2003. Br J Radiol. 2006 Dec;79(948):968–980. doi: 10.1259/bjr/93277434. [DOI] [PubMed] [Google Scholar]
- 95.International Commission on Radiological Protection. ICRP Publication 61: Annual Limits on Intake of Radionuclides by Workers Based on the 1990 Recommendations. Annals of the ICRP. 1991;21(4) [PubMed] [Google Scholar]