

Abstract
Cortical networks in vivo and in vitro are spontaneously active in the absence of inputs, generating highly variable bursts of neuronal activity separated by up to seconds of quiescence. Previous measurements in adult rat cortex revealed an intriguing underlying organization of these dynamics, termed neuronal avalanches, which is indicative of a critical network state. Here we demonstrate that neuronal avalanches persist throughout development in cortical slice cultures from newborn rats. More specifically, we find that in spite of large variations of average rate in activity, spontaneous bursts occur with power-law distributed sizes (exponent -1.5) and a critical branching parameter close to 1. Our findings suggest that cortical networks homeostatically regulate a critical state during postnatal maturation.
Keywords: cortex, development, spontaneous activity, neuronal avalanches, organotypic culture, multielectrode array, self-organized criticality
INTRODUCTION
Neuronal networks are spontaneously active even when maintained isolated from external inputs. This intrinsic activity is crucial for numerous aspects of network development such as neuronal migration, differentiation, synaptogenesis, and synaptic plasticity (Penn, Riquelme et al., 1998;Ben-Ari, 2001;Spitzer, 2006) and typically emerges as synchronized bursts that last for hundreds of milliseconds separated by up to many seconds of quiescence (O’Donovan, 1999). In the cortex, this hallmark of spontaneous activity has been reported since the earliest culture success in vitro (Crain, 1966;Calvet, 1974) and naturally occurs in all isolated cortex preparations thus studied, e.g. in organotypic cultures (Plenz and Aertsen, 1996a;Plenz and Aertsen, 1996b;Gorba, Klostermann et al., 1999;Klostermann and Wahle, 1999;Baker, Corner et al., 2006), dissociated cultures (Maeda, Robinson et al., 1995;Gopal and Gross, 1996;Kamioka, Maeda et al., 1996;Canepari, Bove et al., 1997;Jimbo, Kawana et al., 2000;Segev, Shapira et al., 2001;van Pelt, Corner et al., 2004;Eytan and Marom, 2006), acute cortex slices (Sanchez-Vives and McCormick, 2000), and acutely isolated cortical slabs in vivo (Steriade, Nuñez et al., 1993;Timofeev, Grenier et al., 2000). Quantification of these dynamics, however, has been difficult. Widely varying burst rates, burst durations, and levels of synchronization have been reported even within one neuronal preparation (Corner, Baker et al., 2005). Rather than confounding classification, we hypothesized that the broad variability of the dynamics may be itself a quantifiable and defining feature intrinsic to these networks. In such a network state, neurons would spontaneously and transiently synchronize their activities with a large number of other neurons in ever changing constellations thereby exploring a wide variety of different neuronal associations within the network. Furthermore, such a quantitative description would be accompanied by robust and unambiguous quantitative measures.
Cortex slices taken into culture at early postnatal age develop the main features of cortical organization that includes all major classes of pyramidal neurons (Cäser, Bonhoeffer et al., 1989;Gutnick, Wolfson et al., 1989;Wolfson, Gutnick et al., 1989;Cäser and Schüz, 1992), interneurons (Götz and Bolz, 1989;Plenz and Aertsen, 1996a;Plenz and Aertsen, 1996b;Gorba, Klostermann et al., 1999;Klostermann and Wahle, 1999), and cortical layers (Götz and Bolz, 1992). Organotypic slice cultures therefore to date represent the most intact culture system for studying cortex function in isolation over the course of many weeks. The typical neuronal activity in this in vitro system has been characterized by brief periods of activity separated by many seconds of quiescence and has been given various labels that highlight different aspects such as the abrupt and brief nature of activity periods (‘bursts’ or ‘Spikes’), their non-oscillatory recurrence (‘irregular’), their overlap in time at different cortical sites (‘synchronous’), or their propagation, i.e. successive initiation at different sites (‘waves’) (Crain, 1966;Calvet, 1974;Dichter, 1978;Gutnick, Wolfson et al., 1989;Wolfson, Gutnick et al., 1989;Plenz and Aertsen, 1996a;Plenz and Aertsen, 1996b;Gorba, Klostermann et al., 1999;Klostermann and Wahle, 1999;Corner, van Pelt et al., 2002;Eytan and Marom, 2006). Using extracellular local field potentials (LFP), which are particularly well suited to study network states as they correlate with synchronized activity of local neuronal populations in vivo (Arieli, 1992;Lampl, Reichova et al., 1999), we demonstrated recently that the spontaneous LFPs in isolated cortical networks are ordered such that the probability P of a spatiotemporal LFP cluster of size s follows a power law
| (1) |
(Beggs and Plenz, 2003;Plenz and Thiagarajan, 2007). This power law quantifies the large diversity of spontaneous bursts with respect to their sizes, which can range from just a few μV to many thousands of μV. Importantly, the relative probability of bursts occurring with size s1 and s2 = n · s1 is independent of s,
| (2) |
In this sense, a power law reveals a particular relationship between different length scales. This organization of LFP activity has been demonstrated in the form of ‘neuronal avalanches’ in mature slice cultures and acute cortex slices taken from adult rats (Beggs and Plenz, 2003;Stewart and Plenz, 2006). A similar organization was demonstrated recently in spontaneous spike bursts of dissociated hippocampus cultures (Mazzoni, Broccard et al., 2007). The presence of power law organization across spatial scales is suggestive of systems in a critical state which optimizes numerous aspects of information processing (for review see: Plenz and Thiagarajan, 2007;Chialvo, 2007). The critical state fits our hypothesis; the high variability of neuronal synchronization encountered is an intrinsic system feature. Critical states have been reported in a wide range of physical systems with non-linear propagation characteristics (Bak, Tang et al., 1987;Drossel and Schwabl, 1992;Christensen, Flyvbjerg et al., 1993;Paczuski, Maslov et al., 1996;Bak, Chen et al., 2001) and have been demonstrated in neuronal network simulations (for review see Plenz and Thiagarajan, 2007).
In the present study, we tested for the robustness of the critical state or neuronal avalanche dynamics using organotypic cortex cultures as an experimental model. These cultures transition through different activity levels during postnatal maturation (Maeda, Robinson et al., 1995;Kamioka, Maeda et al., 1996;Corner, van Pelt et al., 2002;Johnson and Buonomano, 2007) and are well suited to identify a common network state that encompasses the variable features of the overall activity. We show that a power law with an exponent of α = −1.5, i.e. neuronal avalanches, describes the spatiotemporal dynamics of spontaneous bursts throughout postnatal development despite large changes in activity. These findings suggest that cortical networks homeostatically regulate neuronal avalanches, which are indicative of a critical state, during development.
MATERIAL AND METHODS
Preparation of organotypic cultures on the multielectrode arrays (MEA)
Organotypic cultures from slices of rat cortex were prepared in accordance with NIH guidelines (Plenz and Kitai, 1998;Karpiak and Plenz, 2002). In short, coronal sections from rat brains at postnatal day 0–2 (P0–2; Sprague Dawley, Taconic Farms, MD, USA) were cut at a thickness of 350 μm. A section of the coronal slice that contained dorsal or dorsolateral cortex (~1.5 mm deep and ~2–3 mm wide) was placed on a multielectrode array (MEA; Multichannelsystems, Reutlingen, Germany) with the bottom electrode row aligned to the white matter and the upper row of electrodes close to the dorsal border of the slice (Fig. 1A). The slices were attached to the sterile, poly-D-lysine coated MEA-surface by coagulation with 15 μl chicken plasma and 15 μl of bovine thrombin (1,000 NIH units/0.75 ml; Sigma St. Louis, MO, USA) after which they were cultivated at 35.5 °C in normal atmosphere in culture medium consisting of 50% Basal Medium Eagle, 25% Hanks Balanced Salt Solution and 25% horse serum, 0.5% glucose, and 0.5 mM L-glutamine (all Gibco, Grand Island, NY, USA). Photographs taken at 1–3 days in vitro (DIV) and after the recording sessions confirmed the location of recording electrodes (Fig. 1C).
Figure 1.
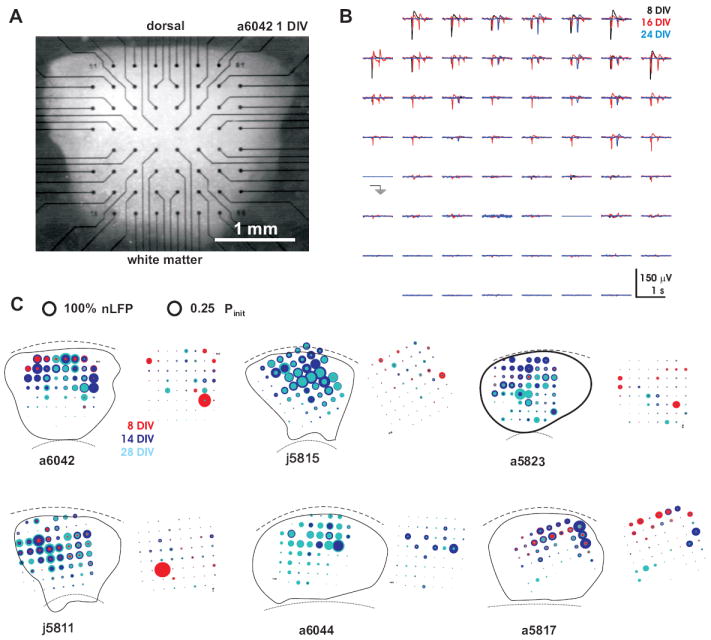
Anatomical reconstruction and basic features of spontaneous activity in organotypic cortex slice cultures grown on MEAs. A, Light microscopic image of a living culture grown on an MEA taken at 1 DIV. B, Two-dimensional plot of synchronized, spontaneous population activity over a period of 1 s. Each subplot displays the LFP time course at the corresponding electrode location. Three population events, each at a different developmental age, were over plotted for comparison. C, Reconstruction of MEA position and neuronal activity for 6 representative cultures. Each reconstruction shows the average summed LFP activity per hour (left) and corresponding distribution of avalanche initiation sites (Pinit; right) for three different developmental stages (8, 14, and 28 DIV). Neuronal activity is concentrated towards the upper half in most cultures. Note that Pinit sites are highly localized in some cultures early during development, but distributed widely throughout the culture during later developmental stages (e.g. a6042, j5811). Average activity levels at each electrode were normalized to the maximal local activity found in each network during development (see 100% nLFP circle diameter). In contrast, Pinit values in the networks were normalized for each developmental period (compare to 100% Pinit diameter). Values from different developmental ages were over plotted in decreasing order for better visualization. Only LFPrel and Pinit values > 5% are shown. Array location (8×8 dot matrix) and anatomical boundaries of cortex cultures were taken from pictures at 1 – 2 DIV. Broken, dotted lines: dorsal and ventral borders of the culture respectively after 21 – 28 DIV.
Incubation and recording conditions
A custom-built incubator allowed repetitive, sterile recordings under culture conditions from individual cultures throughout the period of postnatal cortex maturation (Pfeffer, et al., 2004). In short, MEAs were fixed to storage trays inside the incubator, which were rocked gently with ~6 min cycle time (±75° maximal rocking angle). Through this arrangement, the culture medium was in constant motion, which resulted in stable growth of cultures for up to 6 weeks. After 3 and 27 DIV, 10 μl of mitosis inhibitor was added for 24 hrs (4.4 mM cytosine-5-b-arabino-furanoside, 4.4 mM uridine and 4.4 mM 5-fluorodeoxyuridine; calculated to final concentration; all Sigma). Medium was changed every 3–5 days. No antibiotics were used throughout cultivation periods or during recording sessions. For recordings, a single MEA was placed into a head stage (MEA1060 w/o blanking circuit; ×1200 gain; bandwidth 1 – 3000 Hz; MultiChannelSystems, Inc.), which was affixed to a second tray within the incubator and had the same motion as the storage tray. The transition between storage and recording sessions for an MEA took only a few seconds and was done without interruption of the rocking cycle.
Each MEA consisted of a square glass plate (5×5 cm, 1 mm thickness) with a square array of 60 microelectrodes made of titanium nitride at its center (8×8 grid with the corners missing; inter-electrode distance of 200 μm; (Egert, Schlosshauer et al., 1998). The titanium nitride electrodes were flat, circular discs with a diameter of 30 μm and were connected to gold leads that served as contacts for the amplifier head stage. A circular glass well (~10 mm diameter), centered and cured to the glass plate by sylgard™ was sealed with a Teflon cap forming a sterile culture as well as recording chamber. Recordings were performed inside the incubator in culture medium with the Teflon cap sealed.
Data acquisition and analysis
Continuous extracellular signals ν(t) were recorded between 1 – 3000 Hz, low-pass filtered at 50 Hz to extract the local field potential (LFP; Butterworth-filter, 2nd order; MC_Rack V3.3; Multichannel Systems), digitized at a rate of 1 kHz (Δt = 1 ms), and stored on hard disk. The total duration of recording, Ttot, was 5 hrs for each network and each developmental stage. All subsequent data processing was performed off-line. For each electrode k (k = [1,nelec], nelec = 60), the electrode noise of ν(t) was estimated by calculating the mean and standard deviation (SD) of ν(t) from about 30 min of recording. Negative deflections in the LFP (nLFP) at electrode k were detected by negative threshold crossing at −3SD of the electrode noise, followed by negative peak detection within 25 ms of threshold crossing, and were characterized by the time and absolute amplitude of the nLFP, Ak (ti) (Beggs and Plenz, 2003). More precisely, at a given temporal resolution Δt, nLFPs at electrode k were represented by a vector of length nmax, where nmax is an integer value for which Ttot = nmax · Δt. This vector contained zeros, except for positions ti = i · Δt, i ∈[1,…,nmax] with values Ak (ti) in μV. A time course of population activity A(ti) was obtained by summing nLFP amplitudes on the array at time ti for k = [1,nelec] at Δt = 1ms
| (3) |
Likewise, the total activity Atot in a network was calculated by summing A(ti), i = [1,nmax] for a particular time period, usually 1 hr.
Definition of neuronal avalanches
A neuronal avalanche is technically defined as a sequence of consecutive time bins of width Δt with at least one nLFP each, which is preceded and terminated by at least one time bin with no activity (Beggs and Plenz, 2003;Stewart and Plenz, 2006). The absence of activity for a period of Δt thus indicates the end of an avalanche. If the decision of whether an avalanche has ended is made too early (Δt too short), avalanches will be terminated prematurely; if the Δt chosen is too long, avalanches will be falsely concatenated. If avalanches did simply propagate like a wave, an approximation for Δt (Δtavg) could be obtained by averaging the time between one nLFP at one electrode and the following nLFP at neighbouring electrodes only. Because nLFPs in avalanches occur in irregular patterns across electrodes on the array (Beggs and Plenz, 2004;Stewart and Plenz, 2006), we used a pair-wise approximation to assess the average time for successive nLFPs between electrodes.
In order to calculate Δtavg, we first obtained the distribution of time intervals T for successive nLFPs on the array. Starting with the first nLFP, e.g. Ak(ti) on electrode k at time ti, we searched for the next occurrence of an nLFP on the array, e.g. Al (tj) on electrode l at time tj, and calculated the time interval , where m = (tj − ti)/Δt. This process was repeated for all occurrences of nLFPs on electrode k and for all electrodes. The resulting values were combined into a single density distribution P(TmΔt), which captures how often successive nLFPs occurred with a particular delay m · Δt on the array irrespective of their spatial location. Consequently, the average value of T provides an approximation for Δtavg, the average time to wait before making a decision whether an nLFP propagated on the array. However, this interval distribution is highly skewed, particularly when one compares the last nLFP with the first nLFP in successive avalanches that are separated by long times. In order to exclude long time intervals from successive nLFPs that are barely correlated, a cut-off time τmax was calculated for which the average crosscorrelation function (ccf) for all pairwise electrode comparisons Rccf(τ) had decayed to negligible values using a temporal resolution of Δt = 1ms. For the cultures, we found Rccf(τ) < 10−4 for τmax > 200 ms. The average time between successive, correlated nLFPs on the array, i.e. Δtavg, was obtained by integrating P(TmΔt) up to τmax for each network. In general, Δtavg varied very little for τmax between 100 – 200 ms for single networks as well as for the population of networks. Because the maximal sampling rate of our recording was 1 kHz, the actual Δtavg to calculate avalanches was taken as the nearest multiple of 1 ms. The extracellular signals ν(t) were re-sampled offline at Δtavg and avalanches were determined at the new temporal resolution.
Avalanche sizes were calculated either by summing all nLFP peak amplitudes Aik (sLFP) or the number of active electrodes (sele) within an avalanche. The density distributions of sele and sLFP were obtained with linear binning and the exponent α of the power law was estimated by the slope on log-log transformed distributions using linear regression analysis. Estimates of α based on sLFP (αLFP) or (sele) (αele; see also Beggs and Plenz, 2003) were highly correlated.
Branching Parameter
The average branching parameter σ for the electrode array in the case of one ancestor was given by
| (4) |
where d was the number of electrode descendants, p(d) was the probability of observing d descendants, and nelec was given by the maximal number of electrodes. Because of refractoriness, σ was only calculated from the first and second time bin of an avalanche. When there was only a single electrode ancestor in the first time bin of an avalanche d was simply given by nd, the number of electrode descendants observed in the second time bin of an avalanche. Although strictly speaking, the branching parameter is only defined for one ancestor, we also included estimates of σ when there were multiple electrode ancestors. nder these conditions, d was given by , where na was the number of electrode ancestors observed in the first time bin of an avalanche and round is the rounding operation to the nearest integer. Note that the branching parameter is not defined for zero ancestors and thus does not provide information about the initiation of bursts.
Statistical Analysis
All analysis software was written in Matlab V6.0 (MathWorks, Inc., Natick, MA, USA). Data are presented as mean ± S.E.M., if not stated otherwise. Slope values were estimated using linear regression.
RESULTS
Coronal slices of dorsolateral cortex taken from newly born pups at P0–2 were placed on 8×8 multielectrode arrays (MEA) and cultured for up to 7 weeks in vitro to study postnatal maturation of the cortex in isolation (n = 9 cultures). Cortical recording locations were obtained and confirmed in three steps. First, during culture preparation, cortical slices were placed on the array with the white matter bordering the bottom row of the electrode grid. Second, pictures taken at 1 – 2 DIV allowed identifying the electrode locations during early stages of development (Fig. 1A). Finally, because organotypic cultures slightly expand during postnatal maturation due to the development of cortical layer 2/3 (Fig. 1A; Cäser, Bonhoeffer et al., 1989;Götz and Bolz, 1992), pictures were also taken later during development to confirm the electrode locations within the culture.
Spontaneous nLFPs emerge in layer 2/3 and increase progressively in rate during development
Daily screening during the first week in culture revealed that spontaneous extracellular local field potentials (LFPs) emerged at around 7 – 8 DIV after which the LFP activity was recorded continuously for 5 hrs from 1 – 2 cultures per day (Fig. 1B). The data were grouped into periods of 5 days each to compute a developmental time course of the network activity. LFPs emerged as population events on many electrodes almost simultaneously and their time course was complex, i.e. revealed bi- and triphasic waveforms often reminiscent of a negative population spike superimposed on a positive envelope (Fig. 1B, 3A).
Figure 3.
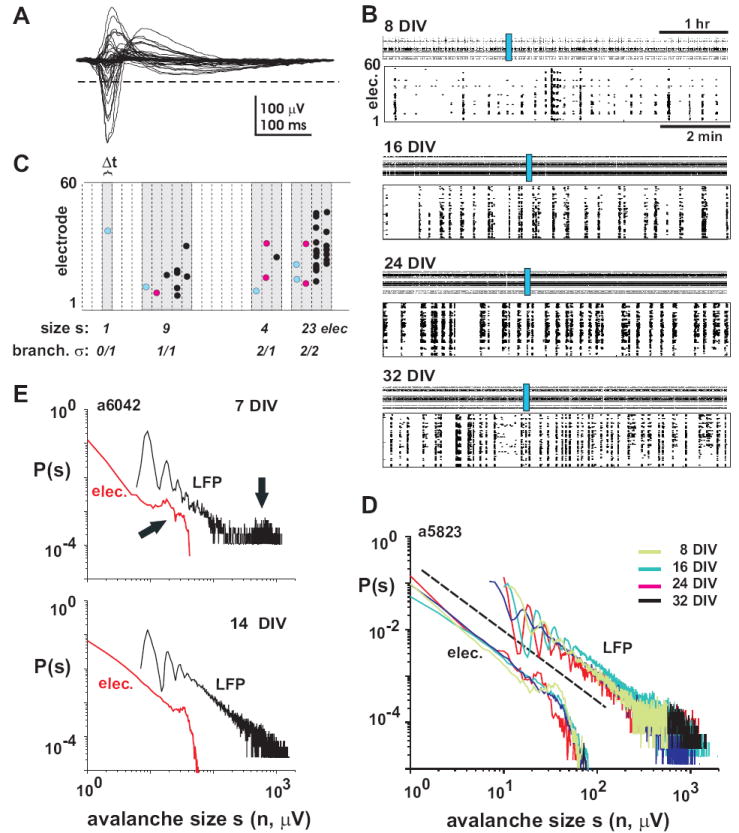
The size distribution of neuronal avalanches obeys a power law during development. A, Overplot of spontaneous LFP activity on all electrodes during one synchronous event. For each electrode, the time point and amplitude of negative LFP peaks (nLFP) below threshold (broken line) are extracted. Thresholds are calculated individually for each electrode at -3SD of the electrode noise. B, Organization of spontaneous nLFPs from one culture at 4 different developmental ages. 5 hrs (top) and 10 min of activity at higher temporal resolution (bottom; blue rectangle) are shown for each age. Synchronous population events, i.e. nLFP clusters, appear as ‘columns’ in the raster display at higher temporal resolution. The nLFP rate increases during postnatal maturation, while the basic pattern of synchronized population events separated by periods of quiescence is maintained. C, The nLFPs (filled circles) form spatiotemporal patterns when displayed in a raster plot. For a particular bin width Δt, the nLFPs are grouped into clusters, i.e. neuronal avalanches (gray areas), by grouping all time bins that contain at least one nLFP until a time bin with no nLFP is encountered. The size s of neuronal avalanches is shown in the number of active electrodes n. Similarly, the branching parameter σ is calculated from the beginning of an avalanche by dividing the number of descendants (red nLFPs) by the number of ancestors (blue nLFPs). For a critical branching process, on average the number of descendants equals the number of ancestors, i.e. σ = 1. D, Distribution of avalanche sizes for the raster plots shown in B. Note that throughout development, all distributions form a power law with a slope α close to −1.5 (broken line), whether expressed as number of active electrodes (elec.) or summed nLFP amplitudes (LFP). E, Example of a culture that showed a bimodal distribution in nLFP clusters early during development, that is, clusters were either small or large (arrow) encompassing most of the active network area (top). This distribution changed into a power law during the 2nd week (bottom).
In order to quantify the spatial organization of this activity, negative LFP peaks (nLFP) were identified using a negative threshold (−3SD) and the time and amplitude of the maximal negative excursion following threshold crossing were determined. Overall, nLFPs were most prominent within the dorsal half of the cortex culture, corresponding to the layers 2/3 (Fig. 1B, C). In line with culture maturation, the nLFP activity at individual electrodes increased during the first 3 weeks of development (Fig. 1C).
By integrating nLFP amplitudes from all electrodes for each network and age, we obtained a developmental time course of the activity level. This time course, expressed as summed nLFP activity per hr (Fig. 2A), revealed that the activity occurred earliest between 5 – 10 DIV, reached a peak between 25 – 30 DIV, after which it declined slightly. The increase in activity level was linked to an increase in nLFP rate (Fig. 2B, C) and occurred in the absence of a significant change in active network area (Fig. 1C). On average, an increase of 100,000 μV in nLFP activity per hr correlated with an increase of 10,000 nLFP events per hr (Fig. 2C; R = 0.93, n = 46, P <0.0001, linear regression). Conversely, the number of active electrodes (>10 nLFP/hr) did not change significantly during maturation (8 DIV: 34 ± 16; 14 DIV: 43 ± 16; 21 DIV: 38 ± 15; DF2,24 = 0.82; P=0.45; One-way ANOVA; n = 9 cultures).
Figure 2.
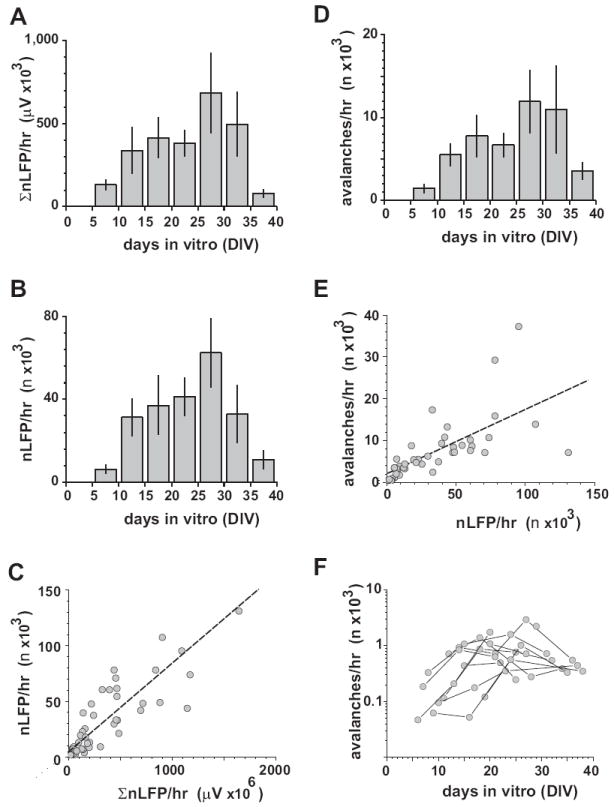
The developmental time course of neuronal activity levels, nLFP rate, and neuronal avalanche rate in organotypic cultures during postnatal maturation. A, Activity levels are detectable earliest between 5 – 10 DIV, reach a peak during 25 – 30 DIV, after which they decline (n = 9 cultures). Average integrated nLFP amplitudes on the array per hr from all cultures grouped into successive developmental periods of 5 days. B, Corresponding change in nLFP rate. C, Correlation between activity level and nLFP rate for individual cultures plotted for all development ages. Broken line: linear regression. D, Developmental time course of neuronal avalanche rate. E, Neuronal avalanche rate correlates with nLFP rate (broken line). Scatter plot of avalanche rate and nLFP rate for each network across all developmental ages. F, Developmental time course of neuronal avalanche rate for individual cultures (semi-logarithmic scale). Note that most cultures increase in avalanche activity by about one order of magnitude during the first week of cultivation. During periods of maximal activity, about 12,000 neuronal avalanches with sizes > 5 μV arise spontaneously per hr in a culture.
These results demonstrate that single cortex cultures show earliest signs of LFP activity towards the end of the first week of cultivation, which corresponds to the beginning of the 2nd week postnatal in vivo. The activity emerges in layer 2/3 of the cortex and increases in rate by up to two orders of magnitude without an enlargement in network area.
Cluster sizes of nLFPs distribute according to a power law throughout development
Subsequent to the emergence of nLFPs during the 2nd week in vitro, spontaneous activity in the cultures was always characterized by brief periods of LFP activity that occurred on many electrodes almost simultaneously and which was separated by quiescent times ranging from dozens of milliseconds to many seconds. This hallmark of spontaneous activity in isolated cortices was readily visualized in the nLFP raster, in which nLFPs from all electrodes were plotted over time (Fig. 3A, B). In these plots, spatiotemporal LFP clusters appeared as ‘column’-like patterns readily visible at all developmental ages (Fig. 3B). We previously found in mature slice cultures and acute slices from rat cortex (Beggs and Plenz, 2003;Stewart and Plenz, 2006) that the probability P of finding a spatiotemporal nLFP cluster of size s follows a power law according to formula 1. Because the power law captures the relative organization of clusters, which might be independent of nLFP rate or amplitudes, we tested for the robustness of this finding throughout the changes in activity seen during development.
The basic idea behind the identification of nLFP clusters is sketched in figure 3C (Beggs and Plenz, 2003). In a first step, we identified those nLFPs on the array that were correlated in time by calculating the average nLFP crosscorrelation function from all possible electrode pairs on the array. For all developmental ages, this function peaked at around zero and quickly decayed towards negligible values within 100 – 200 ms, which was taken as the correlated maximal time range τmax (see also Jimbo and Robinson, 2000;Beggs and Plenz, 2003). In a second step, we then calculated the average inter-event interval for successive nLFPs within τmax on the array, which was taken as the temporal resolution Δtavg (Fig. 3C). This value Δtavg in relation to the spatial sampling resolution of the array, i.e. the interelectrode distance, estimates the average propagation velocity of nLFPs in the network. For example, given our inter-electrode distance of 200 μm, a value of Δtavg = 4 ms suggests a propagation velocity of at least 50 mm/s, if nLFPs would propagate only to their four nearest neighbor electrodes. Although the exact spatial path of propagation as well as the real propagation velocity is not known, Δtavg provides a robust estimation of the average time delay for successive nLFPs in the network, which is independent of any presumed organization of nLFP clusters and solely depends on the average crosscorrelation function and observed nLFP dynamics. Finally, nLFPs in successive time bins Δtavg were grouped into a cluster until a time bin with no nLFPs was encountered (Fig. 3C). The sizes s of an nLFP cluster were defined as the number of electrodes or, alternatively, the absolute sum of nLFP amplitudes within a cluster. In the present study, cluster sizes ranged from 1 to about 40 electrodes and from ≈ 5 μV (lowest detection level of an nLFP) up to ≈ 1000 μV. The corresponding densities P(s) were estimated using linear binning and were examined in double-logarithmic coordinates. The slope α of the power law P(s) was calculated using linear regression from 1 – 30 electrodes and 10 – 400 μV respectively.
During postnatal maturation, the number of nLFP clusters changed in accordance with the overall number of nLFPs, which was low during early development and peaked at 25 – 35 DIV (Fig. 2D). For the population of cultures, the cluster rate changed in accordance with the rate of nLFPs by up to two orders of magnitudes (Fig. 2E; R = 0.726, n = 46; P<0.0001). For single cultures, this change covered at least one order of magnitude (Fig. 2F). Despite these changes in cluster rate, the distributions of cluster sizes formed robust power laws throughout development (Fig. 3D, 4A; R = 0.98 ±0.03 from 1 – 30 electrodes; R = 0.93±0.06; from 10 – 400 μV LFP; n = 9 cultures). These power laws had a typical cut off point at the maximal number of active electrodes for each culture (Fig. 3D), whereas this cutoff was less prominent when cluster sizes were expressed in absolute nLFP amplitudes. In general, networks with power law distribution of nLFP clusters also displayed a large number of initiation sites (Fig. 1C; middle and right column). Only 2 cultures showed bimodal cluster size distributions early during development with predominantly small and large clusters that eventually changed into power law distributions later on (Fig. 3E). This transition correlated with a small number of cluster initiation sites that changed into a more distributed and homogenous initiation of nLFP clusters later during development (Fig. 1C; left column; a6042, j5811).
Figure 4.
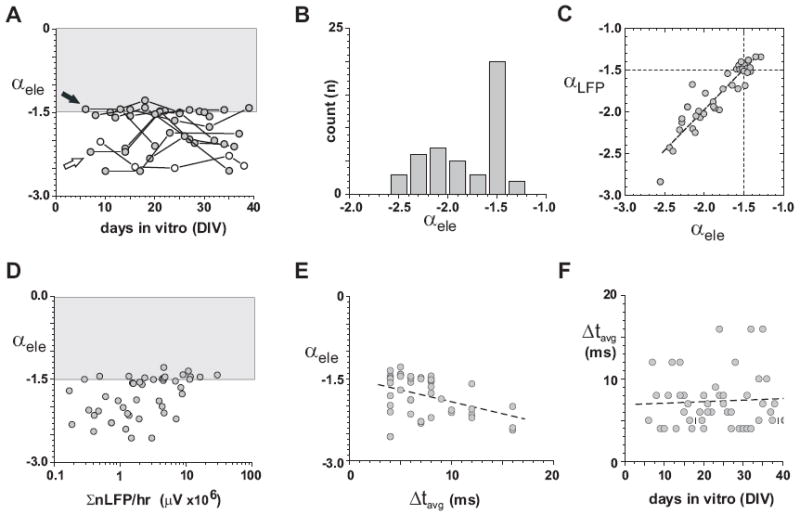
The power law exponent in avalanche size distributions has an upper limit of α = −1.5. A, Developmental time course of the exponent α during postnatal maturation. The exponent α does not extend beyond −1.5 (from size distributions based on number of electrodes). Note that some cultures demonstrated α = −1.5 during early development and maintained this value for several weeks, whereas other cultures reached α = −1.5 during the second week of maturation where they remained. Only one culture maintained a slope value more negative than α = −1.5 throughout development (open circle). B, The preferred value of α = −1.5 is readily visible in the bimodal distribution of slope values taken from all cultures and developmental ages. C, A strong correlation exists between the estimate of the exponent α from avalanche size distributions based on total number of electrodes (αele) or summed nLFP (αLFP). Scatter plot of both estimates for each network and developmental state. D, A slope value of α = −1.5 is established at activity levels that differ by more than two orders of magnitude. Scatter plot of α as a function of absolute summed nLFP amplitudes per hr (note semi-logarithmic coordinates). E, Cultures that reach α = −1.5 show a tendency for a shorter Δtavg, i.e. increased propagation velocity of nLFPs. F, The preference of α = −1.5 during maturation is independent from Δtavg, which does not depend on developmental age.
A power law slope of −3/2 is the upper boundary for avalanche size distributions during development
As shown previously for mature cortical networks, the density P(s) of neuronal avalanche sizes s forms a power law with exponent α = −1.5 at the temporal resolution Δtavg (Beggs and Plenz, 2003;Stewart and Plenz, 2006). When evaluating the spontaneous nLFPs at their respective Δtavg, indeed α = −1.5 was found to be an upper boundary for each developmental age of the cultures (Fig. 4A). The scatter plot of α versus age revealed that slope estimates of α were either close to α = −1.5 or more negative as further demonstrated by the bimodal distribution of slope values (Fig. 4B). This result was robust to estimating the slope using electrode count or summed LFP. Both estimates of α were highly correlated for each network and developmental stage (Fig. 4C; R = 0.93; n = 46; P<0.0001). A closer examination of the time course for individual cultures revealed two prominent patterns. In the first pattern, cultures established α = −1.5 at the earliest recorded time during development and stayed at this boundary for several weeks before eventually decreasing in their exponent (Fig. 4A; filled arrow). In the second pattern, cultures initially had an exponent more negative than −1.5 and reached α = −1.5 during the second or third week of cultivation (Fig. 4A; open arrow). Only one network started and stayed more negative than −1.5 throughout the recording period (Fig. 4A; open circles). Plotting the value of α as a function of activity for all cultures and developmental age, further demonstrated this ability of cultured networks to establish a power law with α = −1.5 over at least two orders of magnitudes in activity levels (Fig. 4D). Correspondingly, α was not correlated with developmental age (R = 0.05273; p = 0.7278; n = 46). Networks with very high activity levels were slightly more likely to show an exponent of α = −1.5 (Fig. 4D; R = 0.46, P = 0.001; n = 46) and to have a slightly smaller value of Δtavg (Fig. 4E; R = -0.34, P = 0.007; n = 46), which is indicative of a faster propagation of activity. Finally, there was also no systematic change in Δtavg, i.e. propagation velocity with age (Fig. 4F; R = -0.04, P = 0.79; n = 46). To summarize, cortical networks obtained a power law and α = −1.5 at any postnatal age and once reached, they demonstrated a tendency to maintain this value of the exponent for several weeks.
We previously reported, that an exponent of α = −1.5 for the event size distribution is linked to a critical value of the branching parameter σ with σ = 1(Beggs and Plenz, 2003). This branching parameter is calculated by dividing the number of nLFPs in the second time bin of an avalanche, i.e. the descendants, by the number of nLFPs in the first time bin, i.e. the ancestors. For avalanches that last only for 1 time bin, the number of descendants is considered to be zero. It can be shown that the cluster size distribution exhibits a power law with slope α = −1.5 for a critical branching process with σ = 1 (Harris, 1989). Indeed, for the neuronal cultures, the branching parameter σ approached σ = 1 with α increasing towards α = −1.5 (Fig. 5; broken line). Conversely, σ was much smaller than 1, for α more negative than −1.5 (Fig. 5; open circles). These findings are in line with our previous finding that the organization of nLFPs into neuronal avalanches can be approximated by a critical branching process (Beggs and Plenz, 2003;Plenz and Thiagarajan, 2007).
Figure 5.
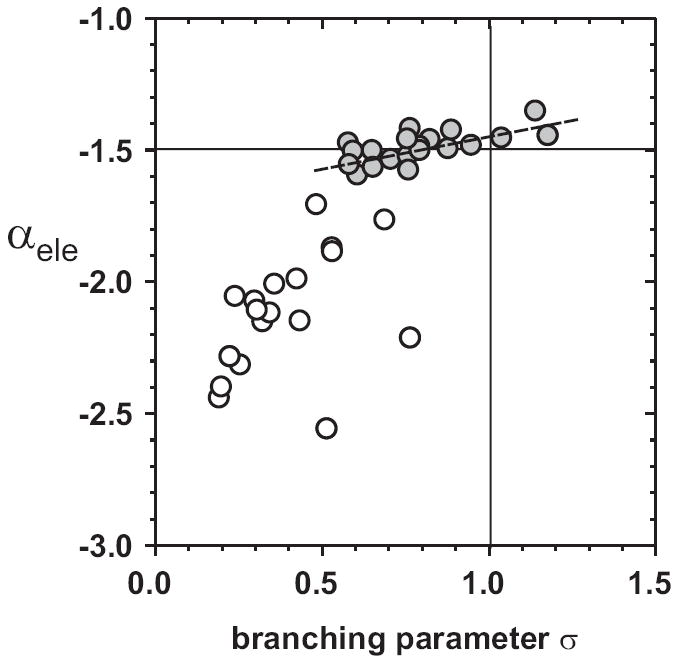
As the exponent α reaches α = −1.5, the branching parameter σ converges towards σ = 1. Scatter plot between the estimate of the exponent α from the avalanche size distributions and the branching parameter σ for each network and developmental state. For slopes much steeper than α = −1.5, the branching parameter σ is significantly smaller than 1 (open circles).
DISCUSSION
The present study demonstrates a homeostatically regulated organization of neuronal synchronization that is remarkably robust despite large variability in the rates of activity. This organization is identified by nLFP clusters, i.e. neuronal avalanches, that distribute according to a power law in sizes with slope less than or equal to −3/2 during postnatal maturation. The power law in size distribution, a critical branching parameter of σ ≅ 1, the robustness of the dynamics to large changes in activity rate, and the temporal organization of relatively brief nLFP clusters interrupted by up to several seconds of quiescence suggests that cortical networks establish and maintain a critical state during postnatal maturation.
nLFP clusters reflect precise spatiotemporal patterns of synchronized activity
Evidence shows that the LFP is well suited for investigating the activity of synchronized groups of neurons. In vivo, the LFP correlates with synchronized activity of local neuronal populations (Arieli, 1992;Lampl, Reichova et al., 1999). LFPs also contain more information than isolated spikes about a network state, e.g. position of a retinal wave (Butts and Rokhsar, 2001) and simultaneous single unit recordings and intrinsic imaging in cat visual cortex have revealed that bursts of spikes correlate more strongly than isolated spikes with cortical network states (Tsodyks, Kenet et al., 1999). In vivo and in vitro, the negative deflection in the LFP, i.e. nLFP, seems to track synchronized spike activity. In vivo, single unit activity is correlated with nLFPs (Gray and Singer, 1989;Chrobak and Buzsaki, 1998;Destexhe, Contreras et al., 1999;Hasenstaub, Shu et al., 2005). Similarly, current source density analysis of population spikes in the hippocampal slice demonstrated that the negative deflection in the LFP correlates with the location of synchronized spikes (Plenz and Aertsen, 1993). In line with these experimental findings, simulations of the electrode-neuronal junction for planar MEAs suggest that the nLFP is correlated with synchronized spike activity (Bove, Martinoia et al., 1998). These studies support the idea that the spatiotemporal organization of nLFPs might reflect the spatiotemporal organization of synchronized neuronal populations in the slice cultures.
In this context, the nLFP cluster reveals two aspects of synchronization. On the one hand, the spatial extent of the synchronized activity is indicated directly by the size of the nLFP cluster expressed in number of electrodes. On the other hand, the duration of the cluster reveals the nature of propagation. For instance, nLFPs linked through a long series of time bins spanning dozens of milliseconds might reflect local synchronized activity, which propagates either in the form of waves (Prechtl, Cohen et al., 1997;Ermentrout and Kleinfeld, 2001) or synfire chains (Abeles, 1992;Diesmann, Gewaltig et al., 1999;Vogels and Abbott, 2005). In contrast, short-lived, but spatially extended clusters might represent tightly synchronized population spikes that can arise from reciprocally coupled neuronal populations (Traub, Whittington et al., 1996). We previously showed that the neuronal avalanches form stably-recurring activity patterns (Beggs and Plenz, 2004), which in line with results from other groups (Ikegaya, Aaron et al., 2004;Segev, Baruchi et al., 2004;Eytan and Marom, 2006) suggests that cortical networks naturally generate precisely timed synchronous neuronal population activities when isolated from inputs.
The organization of spontaneous synchronized activity in organotypic cortex cultures in vitro is independent of activity rate
Previously, we demonstrated in mature cortex cultures that spontaneous activity is organized in the form of neuronal avalanches (Beggs and Plenz, 2003;Plenz and Thiagarajan, 2007). Using recordings from single networks over the course of 6 weeks, the present study extends these observations and demonstrates that neuronal avalanches are a robust form of neuronal synchronization that occurs throughout postnatal development. Large changes in activity levels have been reported previously for organotypic slice cultures during postnatal maturation (Maeda, Robinson et al., 1995;Kamioka, Maeda et al., 1996;Corner, van Pelt et al., 2002;Johnson and Buonomano, 2007) and are also found in our study. Importantly, we show that despite these changes in activity levels, the organization of synchronization in the form of neuronal avalanches remains constant for many weeks even in single cultures.
While the spatial resolution of the LFP recordings is too poor to clearly identify layer-specific activity, our analysis revealed that nLFPs were located towards the upper half of the cortex cultures, which corresponds to the developing superficial cortical layers (Cäser and Schüz, 1992;Götz and Bolz, 1992;Porter, Rizzo et al., 1999). Furthermore, cortical slice cultures have been demonstrated to maintain their cortical layers for many months in culture (Plenz and Kitai, 1996;Plenz and Aertsen, 1996a;Klostermann and Wahle, 1999). The occurrence of the earliest LFPs between 5–10 DIV also corresponds with the time of superficial layer maturation in vivo (Ignacio, Kimm et al., 1995;Larsen and Callaway, 2006) and is in line with our previous finding of neuronal avalanches in superficial layers of cortical slices from adult rats (Stewart and Plenz, 2006). Furthermore, our finding that nLFP clusters are initiated in superficial layers is in accordance with reports by Jimbo and Robinson for synchronized burst initiation in organotypic cortex cultures (Jimbo and Robinson, 2000) and separates this activity from slowly propagated spontaneous bursts in the ferret cortex slice which are initiated in layer 5 (Sanchez-Vives and McCormick, 2000).
We demonstrated that the spatial organization of activity initiation also undergoes large changes particularly during postnatal development. Relative few sites are responsible for the early emergence of activity, whereas many network sites contribute to activity initiation later during maturation when the power law is established. It is currently not clear, whether pacemaker neurons or isolated, highly interconnected neuronal populations form the early initiation sites that trigger activity at distant sites in the network. However, our finding supports the general idea that as cultures mature, nLFP clusters represent a large diversity in neuronal group synchronization that includes many different initiation sites.
In dissociated cultures, commonly prepared from embryonic tissue and grown for many weeks, numerous studies have reported that spontaneous activity occurs in bursts throughout the development with a tendency of the activity to become more irregular as cultures age (e.g. Gopal and Gross, 1996;Kamioka, Maeda et al., 1996;Tateno, Kawana et al., 2002). A direct comparison of findings in the current study with those reported in dissociated cultures, however, encounters a number of difficulties. The absence of a strong LFP, most likely due to the relative low neuronal density (e.g. Eytan and Marom, 2006), and the access to well isolated single units, allows most studies in dissociated cultures to be based on extracellular spikes. In contrast to an nLFP, however, a single spike can arise outside synchronized population events. Thus, the spatiotemporal organization of synchronized activity as reflected in nLFP clusters, might or might not be identifiable in the spatiotemporal organization of spike clusters. While there has been a recent finding on power laws in spike clusters for hippocampal dissociated cultures (Mazzoni, Broccard et al., 2007), a similar analysis in dissociated cortical cultures resulted in a bimodal distribution of spike cluster sizes (Eytan and Marom, 2006). In the latter study, the branching parameter was estimated using successive spikes and was slightly above 1, compared to the current study, which yielded for most cultures with a clear power law a branching parameter slightly below 1. While it has been hypothesized that a branching parameter larger than 1 could indicate epileptic activity as reflected in a bimodal size distribution of clusters (Beggs and Plenz, 2003), experimental estimates of the branching parameter in disinhibited slice cultures do not confirm this hypothesis (Plenz, 2005). It is currently not clear how such differences across different experimental models can be reconciled. In addition, dissociated cultures lack a superficial cortical layers, which are important for the neuronal avalanche dynamics as shown in the current study and reported previously in the acute slice (Stewart and Plenz, 2006).
Self-organized criticality as a homeostatic principle during development
Our study demonstrates a robust spatiotemporal organization of neuronal synchronization in cortical networks during maturation. The nLFPs clusters obeyed a power law in size distribution throughout the period of postnatal development despite large changes in overall activity that cover up to two orders of magnitude. Moreover, this regulation was achieved with a constant power law exponent α = −1.5 demonstrating that the nLFP cluster form neuronal avalanches. This finding suggests a form of homeostasis that does not feature the regulation of average activity, that is, average firing rate of neurons (e.g. Turrigiano and Nelson, 2004), but instead suggests a homeostatic regulation of the diversity in spontaneous neuronal synchronization in the form of neuronal avalanches.
The basic idea behind this kind of regulation is found in the theory of self-organized criticality (SOC; Bak, 1996). The most well known type of system displaying SOC, the paradigmatic example of which is the Bak-Tang-Wiesenfeld sandpile model (Bak, Tang et al., 1987), consists of a 2-dimensional grid of cells, each of which can contain up to four grains, after which a cell will ‘topple’ and distribute its contents to its neighbors. When grains are added randomly to the grid (‘driving’), this inevitably leads to some cells to topple, resulting them to distribute their contents to their neighbors (which may render them unstable), and the cascade of toppling continues until the entire system reaches a state of stability, i.e. all cells are subthreshold (only temporary, because the slow driving will inevitably make the system unstable again at some point in the future).
For this specific example of SOC, local synchronized neuronal groups as reflected in the nLFP would take on the role of a single cell on the grid. The distribution mechanism would be reflected in the ability of a local, synchronized group to trigger synchronization at distant sites in the network according to e.g. a synfire chain mechanism (Abeles, 1992;Diesmann, Gewaltig et al., 1999). Accordingly, an nLFP cluster would represent a cascade of topplings on the grid. Although the exact nature of the driving that results in spontaneous cascade generation in the absence of inputs is currently not known, it is well established that neurons possess numerous intrinsic mechanisms that increase their likelihood to fire action potentials after prolonged periods of subthreshold activity (Turrigiano, Leslie et al., 1998;Thiagarajan, Lindskog et al., 2007). For organotypic cortex cultures, suppression of activity has been demonstrated to trigger numerous physiological responses that upregulate network activity (Corner, Baker et al., 2005). These mechanisms could act equivalent to an external driving, which throughout periods of quiescence slowly increases the likelihood of cells to topple.
The critical state dynamics as laid out by Bak for SOC (Bak, 1996) is particular appealing by combining several aspects found in the spontaneous synchronization for cortical networks. First, SOC leads to long-range spatial correlations, which manifest in the power law distribution of cascade sizes s, P(s) ~ sα, similar to what is found for the neuronal avalanches during postnatal maturation and in mature cortical networks (Beggs and Plenz, 2003;Stewart and Plenz, 2006). Second, the dynamics in systems displaying SOC is far from equilibrium and the separation in time scales between the fast toppling (avalanches) and the slow process that drives the system (‘addition of grains’) results in sudden bursts of activity separated by long times of quiescence (Bak and Paczuski, 1995), again which is typical for the intrinsic spontaneous activity of isolated cortical networks. Finally, the separation of timescales in SOC provides a natural explanation for our observation that the power law is independent of the rate of activity during development. That is, if the external driving, i.e. addition of grains, is reduced, the rate of cascades will be reduced as well, i.e. cells that initiate cascades will on average take longer to reach their threshold. Nevertheless, the power law in cascade sizes, which represents the critical toppling dynamics, is maintained.
Many systems in which event sizes follow a power law distribution display unique or critical power law exponents (Paczuski, Maslov et al., 1996). For the neuronal networks, we previously found that the spontaneous activity in slice cultures naturally resulted in a power law exponent of α = −1.5 (Beggs and Plenz, 2003), and we demonstrated recently that the endogenous neuromodulator dopamine maximizes avalanche rate and pattern recurrence at α = −1.5 (Stewart and Plenz, 2006). Our finding of α = −1.5 throughout postnatal maturation of the cortex cultures further supports the robustness of this value for cortical networks. As networks increase their exponent, distant sites will become increasingly correlated through nLFP clusters relative to nearby sites. Consequently, α = −1.5 provides an upper limit in the relative number of spontaneous correlations that occurs over extended distances in cortical networks. Our finding of α = −1.5 throughout postnatal maturation suggests that cortical networks homeostatically regulate this particular organization of synchronization between distant network sites.
Acknowledgments
We thank Drs. W. Shew, T. Thiagarajan, T. Peterman, and E. D. Gireesh and T. Bellay for comments on an earlier version of the manuscript. This research was supported by the Intramural Research Program of the NIH/NIMH.
Footnotes
Publisher's Disclaimer: This is a PDF file of an unedited manuscript that has been accepted for publication. As a service to our customers we are providing this early version of the manuscript. The manuscript will undergo copyediting, typesetting, and review of the resulting proof before it is published in its final citable form. Please note that during the production process errors may be discovered which could affect the content, and all legal disclaimers that apply to the journal pertain.
Reference List
- Abeles M. Corticonics. 1. Cambridge University Press; New York Port Chester Melbourne Sydney: 1992. [Google Scholar]
- Arieli A. Novel strategies to unravel mechanisms of cortical function: From macro- to micro-electrophysiological recordings. In: Aertsen A, Braitenberg V, editors. Information Processing in the Cortex. Springer-Verlag; Berlin: 1992. pp. 123–37. [Google Scholar]
- Bak P. How Nature Works: The Science of Self-Organized Criticality. Copernicus Books; New York: 1996. [Google Scholar]
- Bak P, Chen K, Paczuski M. Solitons in the one-dimensional forest fire model. Phys Rev Lett. 2001;86:2475–7. doi: 10.1103/PhysRevLett.86.2475. [DOI] [PubMed] [Google Scholar]
- Bak P, Paczuski M. Complexity, contingency, and criticality. Proc Natl Acad Sci U S A. 1995;92:6689–96. doi: 10.1073/pnas.92.15.6689. [DOI] [PMC free article] [PubMed] [Google Scholar]
- Bak P, Tang C, Wiesenfeld K. Self-Organized Criticality: An Explanation of 1/f Noise. Phys Rev Lett. 1987;59:381–4. doi: 10.1103/PhysRevLett.59.381. [DOI] [PubMed] [Google Scholar]
- Baker RE, Corner MA, van Pelt J. Spontaneous neuronal discharge patterns in developing organotypic mega-co-cultures of neonatal rat cerebral cortex. Brain Res. 2006;1101:29–35. doi: 10.1016/j.brainres.2006.05.028. [DOI] [PubMed] [Google Scholar]
- Beggs JM, Plenz D. Neuronal avalanches in neocortical circuits. J Neurosci. 2003;23:11167–77. doi: 10.1523/JNEUROSCI.23-35-11167.2003. [DOI] [PMC free article] [PubMed] [Google Scholar]
- Beggs JM, Plenz D. Neuronal avalanches are diverse and precise activity patterns that are stable for many hours in cortical slice cultures. J Neurosci. 2004;24:5216–29. doi: 10.1523/JNEUROSCI.0540-04.2004. [DOI] [PMC free article] [PubMed] [Google Scholar]
- Ben-Ari Y. Developing networks play a similar melody. Trends Neurosci. 2001;24:353–60. doi: 10.1016/s0166-2236(00)01813-0. [DOI] [PubMed] [Google Scholar]
- Bove M, Martinoia S, Verreschi G, Giugliano M, Grattarola M. Analysis of the signals generated by networks of neurons coupled to planar arrays of microtransducers in simulated experiments. Biosens Bioelectron. 1998;13:601–12. doi: 10.1016/s0956-5663(98)00015-3. [DOI] [PubMed] [Google Scholar]
- Butts DA, Rokhsar DS. The information content of spontaneous retinal waves. J Neurosci. 2001;21:961–73. doi: 10.1523/JNEUROSCI.21-03-00961.2001. [DOI] [PMC free article] [PubMed] [Google Scholar]
- Calvet MC. Patterns of spontaneous electrical activity in tissue cultures of mammalian cerebral cortex vs. cerebellum. Brain Res. 1974;69:281–95. doi: 10.1016/0006-8993(74)90007-9. [DOI] [PubMed] [Google Scholar]
- Canepari M, Bove M, Maeda E, Cappello M, Kawana A. Experimental analysis of neuronal dynamics in cultured cortical networks and transitions between different patterns of activity. Biol Cybern. 1997;77:153–62. doi: 10.1007/s004220050376. [DOI] [PubMed] [Google Scholar]
- Cäser M, Bonhoeffer T, Bolz J. Cellular organization and development of slice cultures from rat visual cortex. Exp Brain Res. 1989;477:234–44. doi: 10.1007/BF00274981. [DOI] [PubMed] [Google Scholar]
- Cäser M, Schüz A. Maturation of neurons in neocortical slice cultures. A light and electron microscopic study on in situ and in vitro material. J Hirnforsch. 1992;33:429–43. [PubMed] [Google Scholar]
- Chialvo DR. The brain near the edge. In: Marro J, Garrido PL, Torres JJ, editors. Cooperative Behavior in Neural Systems: Ninth Granada Lectures. American Institute of Physics; 2007. [Google Scholar]
- Christensen K, Flyvbjerg H, Olami Z. Self-organized critical forest-fire model: Mean-field theory and simulation results in 1 to 6 dimensions. Phys Rev Lett. 1993;71:2737–40. doi: 10.1103/PhysRevLett.71.2737. [DOI] [PubMed] [Google Scholar]
- Chrobak JJ, Buzsaki G. Gamma oscillations in the entorhinal cortex of the freely behaving rat. J Neurosci. 1998;18:388–98. doi: 10.1523/JNEUROSCI.18-01-00388.1998. [DOI] [PMC free article] [PubMed] [Google Scholar]
- Corner MA, Baker RE, van Pelt J, Wolters PS. Compensatory physiological responses to chronic blockade of amino acid receptors during early development in spontaneously active organotypic cerebral cortex explants cultured in vitro. Prog Brain Res. 2005;147:231–48. doi: 10.1016/S0079-6123(04)47018-6. [DOI] [PubMed] [Google Scholar]
- Corner MA, van Pelt J, Wolters PS, Baker RE, Nuytinck RH. Physiological effects of sustained blockade of excitatory synaptic transmission on spontaneously active developing neuronal networks--an inquiry into the reciprocal linkage between intrinsic biorhythms and neuroplasticity in early ontogeny. Neurosci Biobehav Rev. 2002;26:127–85. doi: 10.1016/s0149-7634(01)00062-8. [DOI] [PubMed] [Google Scholar]
- Crain SM. Development of ‘organotypic’ bioelectric acitivity in central nervous tissues during maturation in culture. Int Rev Neurobiol. 1966;9:1–43. doi: 10.1016/s0074-7742(08)60135-x. [DOI] [PubMed] [Google Scholar]
- Destexhe A, Contreras D, Steriade M. Spatiotemporal analysis of local field potentials and unit discharges in cat cerebral cortex during natural wake and sleep states. J Neurosci. 1999;19:4595–608. doi: 10.1523/JNEUROSCI.19-11-04595.1999. [DOI] [PMC free article] [PubMed] [Google Scholar]
- Dichter MA. Rat cortical neurons in cell culture: culture methods, cell morphology, electrophysiology, and synapse formation. Brain Res. 1978;149:279–93. doi: 10.1016/0006-8993(78)90476-6. [DOI] [PubMed] [Google Scholar]
- Diesmann M, Gewaltig MO, Aertsen A. Stable propagation of synchronous spiking in cortical neural networks. Nature. 1999;402:529–33. doi: 10.1038/990101. [DOI] [PubMed] [Google Scholar]
- Drossel B, Schwabl F. Self-organized critical forest-fire model. Phys Rev Lett. 1992;69:1629–32. doi: 10.1103/PhysRevLett.69.1629. [DOI] [PubMed] [Google Scholar]
- Egert U, Schlosshauer B, Fennrich S, Nisch W, Fejtl M, Knott T, Muller T, Hammerle H. A novel organotypic long-term culture of the rat hippocampus on substrate-integrated multielectrode arrays. Brain Res Protoc. 1998;2:229–42. doi: 10.1016/s1385-299x(98)00013-0. [DOI] [PubMed] [Google Scholar]
- Ermentrout GB, Kleinfeld D. Traveling electrical waves in cortex: insights from phase dynamics and speculation on a computational role. Neuron. 2001;29:33–44. doi: 10.1016/s0896-6273(01)00178-7. [DOI] [PubMed] [Google Scholar]
- Eytan D, Marom S. Dynamics and effective topology underlying synchronization in networks of cortical neurons. J Neurosci. 2006;26:8465–76. doi: 10.1523/JNEUROSCI.1627-06.2006. [DOI] [PMC free article] [PubMed] [Google Scholar]
- Gopal KV, Gross GW. Auditory cortical neurons in vitro: cell culture and multichannel extracellular recording. Acta Otolaryngol. 1996;116:690–6. doi: 10.3109/00016489609137908. [DOI] [PubMed] [Google Scholar]
- Gorba T, Klostermann O, Wahle P. Development of neuronal activity and activity-dependent expression of brain-derived neurotrophic factor mRNA in organotypic cultures of rat visual cortex. Cereb Cortex. 1999;9:864–77. doi: 10.1093/cercor/9.8.864. [DOI] [PubMed] [Google Scholar]
- Götz M, Bolz J. Development of vasoactive intestinal polypeptide (VIP)-containing neurons in organotypic slice cultures from rat visual cortex. Neurosci Lett. 1989;107:6–11. doi: 10.1016/0304-3940(89)90782-9. [DOI] [PubMed] [Google Scholar]
- Götz M, Bolz J. Formation and Preservation of cortical layers in slice cultures. J Neurobiol. 1992;23:783–802. doi: 10.1002/neu.480230702. [DOI] [PubMed] [Google Scholar]
- Gray CM, Singer W. Stimulus-specific neuronal oscillations in orientation columns of cat visual cortex. Proc Natl Acad Sci USA. 1989;86:1698–702. doi: 10.1073/pnas.86.5.1698. [DOI] [PMC free article] [PubMed] [Google Scholar]
- Gutnick MJ, Wolfson B, Baldino F. Synchronized neuronal activities in neocortical explant cultures. Exp Brain Res. 1989;76:131–40. doi: 10.1007/BF00253630. [DOI] [PubMed] [Google Scholar]
- Harris TE. The theory of branching processes. Dover; New York: 1989. [Google Scholar]
- Hasenstaub A, Shu Y, Haider B, Kraushaar U, Duque A, McCormick DA. Inhibitory postsynaptic potentials carry synchronized frequency information in active cortical networks. Neuron. 2005;47:423–35. doi: 10.1016/j.neuron.2005.06.016. [DOI] [PubMed] [Google Scholar]
- Ignacio MP, Kimm EJ, Kageyama GH, Yu J, Robertson RT. Postnatal migration of neurons and formation of laminae in rat cerebral cortex. Anat Embryol (Berl) 1995;191:89–100. doi: 10.1007/BF00186782. [DOI] [PubMed] [Google Scholar]
- Ikegaya Y, Aaron G, Cossart R, Aronov D, Lampl I, Ferster D, Yuste R. Synfire chains and cortical songs: temporal modules of cortical activity. Science. 2004;304:559–64. doi: 10.1126/science.1093173. [DOI] [PubMed] [Google Scholar]
- Jimbo Y, Kawana A, Parodi P, Torre V. The dynamics of a neuronal culture of dissociated cortical neurons of neonatal rats. Biol Cybern. 2000;83:1–20. doi: 10.1007/PL00007970. [DOI] [PubMed] [Google Scholar]
- Jimbo Y, Robinson HP. Propagation of spontaneous synchronized activity in cortical slice cultures recorded by planar electrode arrays. Bioelectrochemistry. 2000;51:107–15. doi: 10.1016/s0302-4598(99)00083-5. [DOI] [PubMed] [Google Scholar]
- Johnson HA, Buonomano DV. Development and plasticity of spontaneous activity and Up states in cortical organotypic slices. J Neurosci. 2007;27:5915–25. doi: 10.1523/JNEUROSCI.0447-07.2007. [DOI] [PMC free article] [PubMed] [Google Scholar]
- Kamioka H, Maeda E, Jimbo Y, Robinson HP, Kawana A. Spontaneous periodic synchronized bursting during formation of mature patterns of connections in cortical cultures. Neurosci Lett. 1996;206:109–12. doi: 10.1016/s0304-3940(96)12448-4. [DOI] [PubMed] [Google Scholar]
- Karpiak V, Plenz D. Preparation and maintenance of organotypic cultures for multi-electrode array recordings. Current Protocols in Neuroscience. 2002;1:6. doi: 10.1002/0471142301.ns0615s19. [DOI] [PubMed] [Google Scholar]
- Klostermann O, Wahle P. Patterns of spontaneous activity and morphology of interneuron types in organotypic cortex and thalamus-cortex cultures. Neurosci. 1999;92:1243–59. doi: 10.1016/s0306-4522(99)00009-3. [DOI] [PubMed] [Google Scholar]
- Lampl I, Reichova I, Ferster D. Synchronous membrane potential fluctuations in neurons of the cat visual cortex. Neuron. 1999;22:361–74. doi: 10.1016/s0896-6273(00)81096-x. [DOI] [PubMed] [Google Scholar]
- Larsen DD, Callaway EM. Development of layer-specific axonal arborizations in mouse primary somatosensory cortex. J Comp Neurol. 2006;494:398–414. doi: 10.1002/cne.20754. [DOI] [PMC free article] [PubMed] [Google Scholar]
- Maeda E, Robinson HP, Kawana A. The mechanisms of generation and propagation of synchronized bursting in developing networks of cortical neurons. J Neurosci. 1995;15:6834–45. doi: 10.1523/JNEUROSCI.15-10-06834.1995. [DOI] [PMC free article] [PubMed] [Google Scholar]
- Mazzoni A, Broccard FD, Garcia-Perez E, Bonifazi P, Ruaro ME, Torre V. On the dynamics of the spontaneous activity in neuronal networks. PLoS ONE. 2007;2:e439. doi: 10.1371/journal.pone.0000439. [DOI] [PMC free article] [PubMed] [Google Scholar]
- O’Donovan MJ. The origin of spontaneous activity in developing networks of the vertebrate nervous system. Curr Opin Neurobiol. 1999;9:94–104. doi: 10.1016/s0959-4388(99)80012-9. [DOI] [PubMed] [Google Scholar]
- Paczuski M, Maslov S, Bak P. Avalanche dynamics in evolution, growth, and depinning models. Phys Rev E. 1996;53:414–43. doi: 10.1103/physreve.53.414. [DOI] [PubMed] [Google Scholar]
- Penn AA, Riquelme PA, Feller MB, Shatz CJ. Competition in retinogeniculate patterning driven by spontaneous activity. Science. 1998;279:2108–12. doi: 10.1126/science.279.5359.2108. [DOI] [PubMed] [Google Scholar]
- Pfeffer L, I D, S CV, P D. In: A life support systems for stimulation of and recording from rodent neuron networks grown on multi-electrode arrays. Long R, Atani S, editors. 2004. pp. 473–8. [Google Scholar]
- Plenz D. Comment on ‘Critical branching captures activity in living neural networks and maximizes the number of metastable states’. Phys Rev Lett. 2005;95:219801. doi: 10.1103/PhysRevLett.95.219801. [DOI] [PubMed] [Google Scholar]
- Plenz D, Aertsen A. Current Source Density profiles of optical recording maps: a new approach to the analysis of spatio-temporal neural activity patterns. Eur J Neurosci. 1993;5:437–48. doi: 10.1111/j.1460-9568.1993.tb00510.x. [DOI] [PubMed] [Google Scholar]
- Plenz D, Aertsen A. Neural dynamics in cortex-striatum co-cultures. I. Anatomy and electrophysiology of neuronal cell types. Neurosci. 1996a;70:861–91. doi: 10.1016/0306-4522(95)00406-8. [DOI] [PubMed] [Google Scholar]
- Plenz D, Aertsen A. Neuronal dynamics in cortex-striatum co-cultures. II. Spatio-temporal characteristics of neuronal activity. Neurosci. 1996b;70:893–924. doi: 10.1016/0306-4522(95)00405-x. [DOI] [PubMed] [Google Scholar]
- Plenz D, Kitai ST. Generation of high-frequency oscillations in local circuits of rat somatosensory cortex cultures. J Neurophysiol. 1996;76:4180–4. doi: 10.1152/jn.1996.76.6.4180. [DOI] [PubMed] [Google Scholar]
- Plenz D, Kitai ST. ‘Up’ and ‘down’ states in striatal medium spiny neurons simultaneously recorded with spontaneous activity in fast-spiking interneurons studied in cortex-striatum-substantia nigra organotypic cultures. J Neurosci. 1998;18:266–83. doi: 10.1523/JNEUROSCI.18-01-00266.1998. [DOI] [PMC free article] [PubMed] [Google Scholar]
- Plenz D, Thiagarajan TC. The organizing principles of neuronal avalanches: cell assemblies in the cortex? Trends Neurosci. 2007;30:101–10. doi: 10.1016/j.tins.2007.01.005. [DOI] [PubMed] [Google Scholar]
- Porter LL, Rizzo E, Hornung JP. Dopamine affects parvalbumin expression during cortical development in vitro. J Neurosci. 1999;19:8990–9003. doi: 10.1523/JNEUROSCI.19-20-08990.1999. [DOI] [PMC free article] [PubMed] [Google Scholar]
- Prechtl JC, Cohen LB, Pesaran B, Mitra PP, Kleinfeld D. Visual stimuli induce waves of electrical activity in turtle cortex. Proc Natl Acad Sci U S A. 1997;94:7621–6. doi: 10.1073/pnas.94.14.7621. [DOI] [PMC free article] [PubMed] [Google Scholar]
- Sanchez-Vives MV, McCormick DA. Cellular and network mechanisms of rhythmic recurrent activity in neocortex. Nat Neurosci. 2000;3:1027–34. doi: 10.1038/79848. [DOI] [PubMed] [Google Scholar]
- Segev R, Baruchi I, Hulata E, Ben Jacob E. Hidden neuronal correlations in cultured networks. Phys Rev Lett. 2004;92:118102. doi: 10.1103/PhysRevLett.92.118102. [DOI] [PubMed] [Google Scholar]
- Segev R, Shapira Y, Benveniste M, Ben Jacob E. Observations and modeling of synchronized bursting in two-dimensional neural networks. Phys Rev E Stat Phys Plasmas Fluids Relat Interdiscip Topics. 2001;64:011920. doi: 10.1103/PhysRevE.64.011920. [DOI] [PubMed] [Google Scholar]
- Spitzer NC. Electrical activity in early neuronal development. Nature. 2006;444:707–12. doi: 10.1038/nature05300. [DOI] [PubMed] [Google Scholar]
- Steriade M, Nuñez A, Amzica F. A novel slow (<1 Hz) oscillation of neocortical neurons in vivo: depolarizing and hyperpolarizing components. J Neurosci. 1993;13:3252–65. doi: 10.1523/JNEUROSCI.13-08-03252.1993. [DOI] [PMC free article] [PubMed] [Google Scholar]
- Stewart CV, Plenz D. Inverted-U profile of dopamine-NMDA-mediated spontaneous avalanche recurrence in superficial layers of rat prefrontal cortex. J Neurosci. 2006;26:8148–59. doi: 10.1523/JNEUROSCI.0723-06.2006. [DOI] [PMC free article] [PubMed] [Google Scholar]
- Tateno T, Kawana A, Jimbo Y. Analytical characterization of spontaneous firing in networks of developing rat cultured cortical neurons. Phys Rev E Stat Nonlin Soft Matter Phys. 2002;65:051924. doi: 10.1103/PhysRevE.65.051924. [DOI] [PubMed] [Google Scholar]
- Thiagarajan TC, Lindskog M, Malgaroli A, Tsien RW. LTP and adaptation to inactivity: overlapping mechanisms and implications for metaplasticity. Neuropharmacol. 2007;52:156–75. doi: 10.1016/j.neuropharm.2006.07.030. [DOI] [PubMed] [Google Scholar]
- Timofeev I, Grenier F, Bazhenov M, Sejnowski TJ, Steriade M. Origin of slow cortical oscillations in deafferented cortical slabs. Cereb Cortex. 2000;10:1185–99. doi: 10.1093/cercor/10.12.1185. [DOI] [PubMed] [Google Scholar]
- Traub RD, Whittington MA, Colling SB, Buzsaki G, Jefferys JG. Analysis of gamma rhythms in the rat hippocampus in vitro and in vivo. J Physiol. 1996;493(Pt 2):471–84. doi: 10.1113/jphysiol.1996.sp021397. [DOI] [PMC free article] [PubMed] [Google Scholar]
- Tsodyks M, Kenet T, Grinvald A, Arieli A. Linking spontaneous activity of single cortical neurons and the underlying functional architecture. Science. 1999;286:1943–6. doi: 10.1126/science.286.5446.1943. [DOI] [PubMed] [Google Scholar]
- Turrigiano GG, Leslie KR, Desai NS, Rutherford LC, Nelson SB. Activity-dependent scaling of quantal amplitude in neocortical neurons. Nature. 1998;391:892–6. doi: 10.1038/36103. see comments. [DOI] [PubMed] [Google Scholar]
- Turrigiano GG, Nelson SB. Homeostatic plasticity in the developing nervous system. Nat Rev Neurosci. 2004;5:97–107. doi: 10.1038/nrn1327. [DOI] [PubMed] [Google Scholar]
- van Pelt J, Corner MA, Wolters PS, Rutten WL, Ramakers GJ. Longterm stability and developmental changes in spontaneous network burst firing patterns in dissociated rat cerebral cortex cell cultures on multielectrode arrays. Neurosci Lett. 2004;361:86–9. doi: 10.1016/j.neulet.2003.12.062. [DOI] [PubMed] [Google Scholar]
- Vogels TP, Abbott LF. Signal propagation and logic gating in networks of integrate-and-fire neurons. J Neurosci. 2005;25:10786–95. doi: 10.1523/JNEUROSCI.3508-05.2005. [DOI] [PMC free article] [PubMed] [Google Scholar]
- Wolfson B, Gutnick MJ, Baldino F. Electrophysiological characteristics of neurons in neocortical explant cultures. Exp Brain Res. 1989;76:122–30. doi: 10.1007/BF00253629. [DOI] [PubMed] [Google Scholar]