

Abstract
Schizophrenia is associated with abnormal processing of salient stimuli, which may contribute to clinical symptoms. We used fMRI and a standard auditory 3-stimulus task to examine attention processing. Target stimuli and novel distractors were presented to 17 patients and 21 healthy controls and activation was correlated with negative and positive symptoms. To targets, patients overactivated multiple regions including premotor cortex, anterior cingulate, temporal cortex, insula, and hippocampus, and also showed attenuated deactivation within occipital cortex. To distractors, patients overactivated left ventrolateral prefrontal cortex. This overactivation may reflect hypersensitivity to salient stimuli in schizophrenia. Patients also exhibited an inverse correlation between negative symptom severity and activation to novel distractors in the dorsolateral prefrontal cortex, premotor area, and ventral striatum. Novelty-induced activity within prefrontal cortex and ventral striatum may represent a useful intermediate phenotype for studies of negative symptoms.
Keywords: Schizophrenia, Functional MRI, Auditory oddball, Deviance detection, Negative symptoms, Ventral striatum
Introduction
Patients with schizophrenia exhibit impairments in executive functions essential for controlled implementation of task demands, including the ability to sustain and focus attention (Braff 1993; Harris et al. 2007; Mathalon et al. 2004). Schizophrenia is also associated with exaggerated stimulus-induced responses, even when stimuli are task-irrelevant (Gray et al. 1995; Kapur 2003). Deficient control of attention and aberrant automatic responses to salience may impair function, by contributing to symptoms and detrimentally affecting cognition (Green 1996; McClure et al. 2007; Prouteau et al. 2004).
The three-stimulus variant of the classic auditory ‘oddball’ task probes these different aspects of attention. Against a background of frequent ‘standard’ tones, rare target tones require the subject to respond, while equally rare novel sounds must be ignored. Successful performance requires the ability to sustain focus on the task and react appropriately to salient stimuli by generating or inhibiting motor responses to targets and novel distractors, respectively. As used here, the term ‘salient’ refers to the ability of a stimulus to grab attention and/or guide actions (Kapur 2003). In this context, both target and novel stimuli are salient, but in distinct ways. Targets are salient because of their behavioral relevance to the task at hand, as well as their rarity. Novel stimuli are salient due to their rarity and also because each one has unique and complex perceptual features; they tend to capture attention despite being task-irrelevant. Several recent studies have also interpreted the three-stimulus oddball task within a similar conceptual framework of salience (Laurens et al. 2005; Liddle et al. 2006; Zink et al. 2003, 2006).
Electrophysiological event-related potentials (ERPs) have been used extensively to study neural responses during oddball tasks. Response to targets is associated with a prominent P3b component maximal over parietal regions, while novel distractors evoke a prominent fronto-central P3a component (Muller-Gass et al. 2007; Polich 2007; Squires et al. 1975). However, both P3a and P3b can occur in response to either targets or distractors (Katayama and Polich 1999; Sawaki and Katayama 2007; Turetsky et al. 1998a). Functional MRI (fMRI) studies have identified a network of regions normally activated by deviant stimuli, consistent with earlier electrophysiological findings but providing greater anatomical detail. In response to target stimuli, the strongest fMRI activations occur in bilateral temporo-parietal junction (TPJ), but other regions are also activated including: sensorimotor cortex, dorsolateral and ventrolateral prefrontal cortex (PFC), dorsomedial frontal cortex and anterior cingulate; medial temporal lobe (MTL), insula, striatum, thalamus, cerebellum, and midbrain (Gur et al. 2007a; Kiehl et al. 2001; Kiehl et al. 2005b; Liddle et al. 2006; Linden et al. 1999; McCarthy et al. 1997; Menon et al. 1997; Opitz et al. 1999a; Stevens et al. 2000). Novel distractors activate an overlapping set of regions, with shared activation prominent in TPJ, PFC, MTL, and ventral striatum (Gur et al. 2007a; Kiehl et al. 2001; Kiehl et al. 2005b; Laurens et al. 2005; Opitz et al. 1999b).
ERP studies assessing neural responses to deviance in schizophrenia have generally shown substantial reductions in both P3a and P3b (Grillon et al. 1990; Mathalon et al. 2000; Turetsky et al. 1998b). To date, only a few fMRI studies have examined responses to rare target stimuli in schizophrenia (Ford et al. 2005; Kiehl and Liddle, 2001; Kiehl et al. 2005a; Liddle et al. 2006), and evaluated novel distractors (Gur et al. 2007b; Laurens et al. 2005; Morey et al. 2005). Regional fMRI activation patterns in response to deviant stimuli are qualitatively similar in patients with schizophrenia and controls. While most studies report a fairly diffuse reduction in response magnitude (Kiehl and Liddle, 2001; Kiehl et al. 2005a; Laurens et al. 2005; Liddle et al. 2006), some of these same studies identified subthreshold overactivation in specific regions (Kiehl et al. 2005a; Laurens et al. 2005; see Discussion for further detail). In our study using a visual three-stimulus oddball paradigm, schizophrenia patients exhibited region- and stimulus-specific alterations. To targets, patients showed decreased activation in superior temporal gyrus, superior frontal gyrus, cingulate, thalamus, basal ganglia; and increased activation in insula, midfrontal gyrus, posterior cingulate, and inferior parietal lobule. To distractors, patients showed underactivation in occipital cortex and inferior parietal lobule, and overactivation in parieto-occipital cortex, midfrontal gyrus, and inferior frontal gyrus. (Gur et al. 2007b). This suggests heterogeneity both in terms of brain regions and possibly patient populations, and highlights the need for generalization across sensory modalities. Examining brain activation for an auditory oddball task will help further characterize regional responses to salience in schizophrenia.
The relationship between neural responses to salient stimuli and clinical symptoms is of particular interest. Our recent visual three-stimulus study found that positive and negative symptoms were associated with a distinct set of region-specific and condition-specific correlations (Gur et al. 2007b). Aside from a recent study relating positive symptoms to ‘default-mode’ function (Garrity et al. 2007), clinical correlations with fMRI activity in auditory oddball tasks have not been reported.
We applied the auditory three-stimulus task with fMRI to characterize neural responses to task-relevant or task-irrelevant deviant stimuli. We hypothesized that patients would exhibit abnormal activation in prefrontal regions mediating executive functions, and in temporo-limbic regions involved in elaborated auditory processing and automatic response to salience. We expected activation to all deviant stimuli to be increased in those with more positive symptoms, and decreased in those with more negative symptoms. Finally, we expected divergent responses within the striatum, a key region responding to salience in various contexts, including the auditory oddball task (Zink et al. 2006). Exaggerated striatal responses in schizophrenia have been related to positive symptoms, and may play a causal role in paranoia and disorganization (Epstein et al. 1999; Gray 1995; Kapur 2003; Laruelle and Abi-Dargham 1999). Conversely, reduced ventral striatum responsivity is associated with negative symptoms (Juckel et al. 2006a), possibly contributing to the etiology of anhedonia, apathy, and avolition.
Materials and methods
Participants
The sample included 17 patients and 21 healthy comparison subjects (See Table 1 for demographic and clinical details). All were volunteers at the Schizophrenia Research Center. After complete description of the study, written informed consent was obtained. Participants underwent standard assessment, including medical, neurological, psychiatric, neurocognitive, and laboratory tests. Psychiatric evaluation included a clinical interview, structured interview (SCID-P, First et al. 1996), and collateral history from family, caregivers and records. Symptom scales were administered by trained investigators (reliability criterion 0.90 intraclass correlation). Patients had a DSM-IV diagnosis of schizophrenia (N =16) or schizoaffective disorder depressed type (N =1), determined by consensus conference based on all available information. Antipsychotic regimens included 2nd generation (N =11), 1st generation (N =2), combined 1st and 2nd generation (N =3), and no antipsychotic (N =1). Patients had no history of other disorders or events affecting brain function (including current substance use or any history of substance disorder); controls additionally had no history of major psychiatric illness in first-degree relatives.
Table 1.
Demographic and Clinical Variables in Schizophrenia and Control Groups
| Patients (N =17)a | Controls (N =21) | ||
|---|---|---|---|
| Variable | Percentage | Percentage | p-Value b |
| Gender (% Female) | 47% | 48% | .62 |
| Handedness (% Right) | 82% | 100% | .08 |
| Mean±SD (Range) | Mean±SD (Range) | p-Valuec | |
| Age d | 31.9±7.1 (21–42) | 28.6±7.1 (20–45) | .16e |
| Education | 13.5±2.5 (9–18) | 15.5±2.6 (12–20) | .03 *f |
| Parental Education | 13.7±2.1 (10–17) | 15.5±2.0 (12–18) | .02 * |
| Age at Onset g | 22.1±5.2 (16–34) | ||
| Duration of Illness | 9.9±6.4 (0.2–22) | ||
| Hospitalizations | 2.4±3.8 (0–15) | ||
| Dose h | 359±306 (0–993) | ||
| SANS Global i | 1.24±0.99 (0–2.5) | ||
| SAPS Global | 0.79±0.95 (0–3.5) | ||
| SANS Total j | 18.5±14.9 (0–48) | ||
| SAPS Total | 11.0±13.6 (0–44) | ||
DSM-IV diagnosis of schizophrenia (n=16) and schizoaffective, depressed type (n=1).
Fisher’s exact test was used for comparing gender and handedness proportions.
Student’s t test used to compare group means, except for age at fMRI.
All time-related variables (e.g. age, education, duration of illness) are expressed in units of years.
Wilcoxon’s Rank Sum used to compare mean age at fMRI due to non-normal distribution.
Asterisks indicate statistically significant differences, two-tailed p < .05, uncorrected.
Onset defined by psychotic symptoms in the context of function decline.
Dose is in chlorpromazine-equivalent milligram units. 11 patients were taking 2nd generation antipsychotics, 2 were on 1st generation, and 3 were on both; 1 was unmedicated.
SANS and SAPS ‘Global’ scores are average of global subscale items (SANS attention subscale excluded).
SANS and SAPS ‘Total’ scores are sums of all scale item scores (SANS attention subscale included).
Patients were clinically stable, with mild symptoms at time of study, as assessed with the Scale for Assessment of Negative Symptoms (SANS, Andreasen 1984a) and Scale for the Assessment of Positive Symptoms (SAPS, Andreasen 1984b). This sample partly overlaps (7 patients, 7 controls) with that reported in Gur et al. (2007b). There were an additional 9 controls and 9 patients who were excluded from the analysis for the following reasons: inadequate performance (<=66% accuracy, 1 Control and 3 Patients), excessive motion (1 Control, 3 Patients), technical problems with data acquisition (7 Controls, 3 Patients). Excluded and included participants did not differ significantly in age, gender, handedness, education, or parental education.
Task
Three auditory stimulus types were presented binaurally via fMRI-compatible headphones: frequent standard tones (1000 Hz), infrequent target tones (2000 Hz), and novel stimuli consisting of unique environmental sounds (generally unrecognizable due to brevity). In total, 200 stimuli were presented: 140 standard, 30 target, 30 novel. Each stimulus lasted 150 milliseconds with a 1.85 second inter-stimulus interval, giving a total run time of 400 seconds. The average interval between deviant stimuli (novel or target) was 6.5 seconds. The order of stimuli classes was pseudorandomized. Stimulus intensity was 70 dB SPL; subjects reported no difficulties hearing the stimuli during scanning.
Subjects were placed in the scanner supine, and head fixation ensured by a foam-rubber device mounted on the head coil. Subjects responded to targets by pressing a single button of a response pad (FORP™, Current Design Inc., Philadelphia PA); the hand used was randomly assigned. Button presses and response latencies were recorded. No response was required for standard or novel stimuli (therefore, reaction time measures are available only for targets). Subjects visually fixated on a central crosshair throughout the run.
Image Acquisition
Functional blood-oxygen-level-dependent (BOLD) data were acquired on a 4T GE Signa Scanner (Milwaukee, WI), with a quadrature head coil. Axial slices were obtained starting at the inferior aspect of the temporal lobes extending superiorly to the hand-motor area of the primary motor cortex. A multislice gradient-echo echo planar sequence was used, with FOV 240mm (frequency) × 150 mm (phase), acquisition matrix 64×40 (22 slices, 4mm thickness, 0 slice gap, TR 2000 ms, TE 21 ms), providing nominal voxel resolution of 3.75 × 3.75 × 4.0 mm. Functional images were corrected for residual geometric distortion (Jezzard and Balaban 1995), based on a magnetic field map acquired with a one-minute reference scan. Whole-brain structural images were obtained with T1-weighted axial slices (FOV 240×240 mm, matrix 256 ×256, voxel size 0.94 × 0.94 × 4.0 mm).
Image Processing
The fMRI data were preprocessed and analyzed using FEAT (FMRI Expert Analysis Tool, v. 5.63), part of FSL (FMRIB’s Software Library, www.fMRIb.ox.ac.uk/fsl). Images were motion corrected to median time point reference using tri-linear interpolation, and corrected for slice-timing variations. Non-brain areas were removed using BET (Smith, 2002). Images were high-pass filtered (60 second cutoff), spatially smoothed (8mm FWHM gaussian isotropic kernel), and grand-mean scaled. The median functional image was transformed by trilinear interpolation into standard anatomical space (Jenkinson et al. 2002; Jenkinson and Smith 2001) using the T1 Montreal Neurological Institute (MNI) template; resultant transformation parameters were later applied to subject-level statistical images prior to group-level analyses. Preprocessed 4D timeseries were converted to percent-change from the mean and visually inspected to identify significant artifacts (Culham 2006); artifactual scans were smoothed by interpolation to adjacent timepoints (ArtRepair v.2, Paul Mazaika 2006).
Statistical Analysis
Subject-level general linear model timeseries analysis was performed using FILM (FMRIB’s Improved Linear Model) with local autocorrelation correction (Woolrich et al. 2001). Novel and target conditions were each modeled with a canonical (double-gamma) hemodynamic response function and its temporal derivative. The primary contrasts of interest were target vs. standard baseline and novel distractor vs. standard baseline. The design matrix also included 6 motion parameters derived from motion correction, to reduce residual motion effects. Groups did not differ significantly in head motion.
Subject-level statistical maps were transformed into MNI space and resampled to 2mm isotropic voxels. Group-level random effects analyses were also performed in FSL, using FMRIB Local Analysis of Mixed Effects (FLAME 1+2) (Beckmann et al. 2003; Woolrich et al. 2004) during estimation of statistical significance. Within-group analyses used one-sample t-tests on whole brain contrasts. Between-group analyses used two-sample t-tests. In order to limit type I and type II errors and improve interpretability of observed differences, between-group analyses were restricted to those voxels showing a significant (voxelwise two-tailed p <.05 uncorrected) within-group effect in either group for either condition. To assess the relationship of fMRI BOLD activation to clinical symptoms in patients, separate group-level covariate analyses were performed for each condition (target, novel) and each scale (total SANS, total SAPS). Covariate analyses were restricted to the same set of task-regulated regions used for between-group analyses. Total SANS scores used in the covariate analysis included items from the attention subscale; however, the across-subject correlation of total SANS scores with the attention items and the total SANS scores without these items is 0.99. Therefore, correlation results are not affected by the choice to include or exclude the attention items.
For all analyses, statistical significance was determined by requiring contiguous clusters of sufficient size to provide a p <0.05 family-wise error rate, thereby correcting for multiple comparisons across many voxels (Forman et al. 1995). The cluster-size cutoff was determined using Monte Carlo simulation (AlphaSim, D.B. Ward, http://afni.nimh.gov/pub/dist/doc/manual/AlphaSim.pdf) within the relevant mask. Voxelwise height thresholds for inclusion in a cluster varied by analysis, with values chosen to limit type II error while providing adequate protection against type I errors. For within-group comparisons, this voxel height threshold was p <.002, uncorrected. For between-group comparisons and covariate analysis of symptom scales, which have less statistical power, voxel height threshold was p <.05 uncorrected. For these analyses, p values used for voxel height thresholds were two-tailed, to conservatively account for the analysis of bidirectional effects (activations and deactivations; control vs. patient differences; positive and negative correlations).
Given the a priori hypotheses regarding the relationship of positive and negative symptoms to striatal activation, and the reduced sensitivity of whole-brain analysis for small subcortical structures, we performed a separate statistical analysis focused only on the striatum. The bilateral striatal region of interest (ROI, 4029 2mm isotropic voxels, 32,232 mm3 volume) mask was obtained in MNI space from the Automated Anatomical Labeling (AAL) atlas provided with WFU PickAtlas (Tzourio-Mazoyer et al. 2002). Because the a priori hypotheses in striatum were directional, we use a one-tailed voxelwise statistical test, with p <.05 uncorrected as a voxel height threshold, again using cluster correction for multiple comparisons, with cluster p < .05. A smaller (4mm) spatial smoothing kernel was used to increase sensitivity for effects anticipated to be of small spatial extent; otherwise, all procedures were as described above.
Results
Behavioral Performance
As expected, both patients and controls achieved high accuracy, without significant group differences (Table 2). Patients had longer response times to target stimuli, as is typically observed (Kiehl et al. 2005a; Liddle et al. 2006).
Table 2.
Task Performance in Schizophrenia and Control Groups
| Patients (N =17) | Controls (N =21) | ||
|---|---|---|---|
| Variable | Mean±SD (Range) | Mean±SD (Range) | p-Valuea |
| Target Accuracyb | 97.7±3.3 (90–100) | 98.6±3.9 (83–100) | .23 |
| Novel Accuracyc | 98.8±2.9(90–100) | 99.8±0.7 (97–100) | .15 |
| Total Accuracyd | 98.2±2.2 (95–100) | 99.2±2.0 (92–100) | .11 |
| Mean Reaction Timee | 642±102 (515–849) | 580±90 (392–746) | .05*f |
Student’s t test used to compare group means. Accuracy scores were arcsine transformed prior to comparison; mean reaction time was normally distributed.
Percent of targets with correct response (button press), out of 30 total.
Percent of distractors with response correctly withheld, out of 30 total.
Percent of target and novel stimuli with correct response, out of 60 total.
Within-subject mean reaction time (milliseconds) across target trials, averaged across group.
Asterisk indicates statistically significant difference, two-tailed p < .05, uncorrected.
Within-Group Activation Patterns
Target Compared to Standard Baseline
Functional maps for the target condition were qualitatively similar for controls and patients (Fig. 1 and Table 3), with activation patterns consistent with previously published reports (Kiehl et al. 2001, 2005a, 2005b; Kiehl and Liddle, 2001; Liddle et al. 2006; Linden et al. 1999; Menon et al. 1997; Opitz et al. 1999a; Stevens et al. 2000). Both groups showed activation involving cortical structures such as bilateral TPJ, insula, superior temporal pole, MTL, paracentral sensorimotor cortex, dorsal and ventral lateral PFC, and dorsal anterior cingulate/premotor cortex. Activated subcortical structures included thalamus, dorsal and ventral striatum, and midbrain. Significant deactivations (reflecting reduced BOLD signal following targets compared to the baseline response to standard stimuli) occurred in control subjects within the ventromedial frontal cortex, occipito-parietal regions (posterior cingulate) and left occipital cortex (cuneus, superior and middle occipital gyri). Patients did not exhibit significant deactivations.
Fig. 1. Within-group BOLD responses to target and novel stimuli.
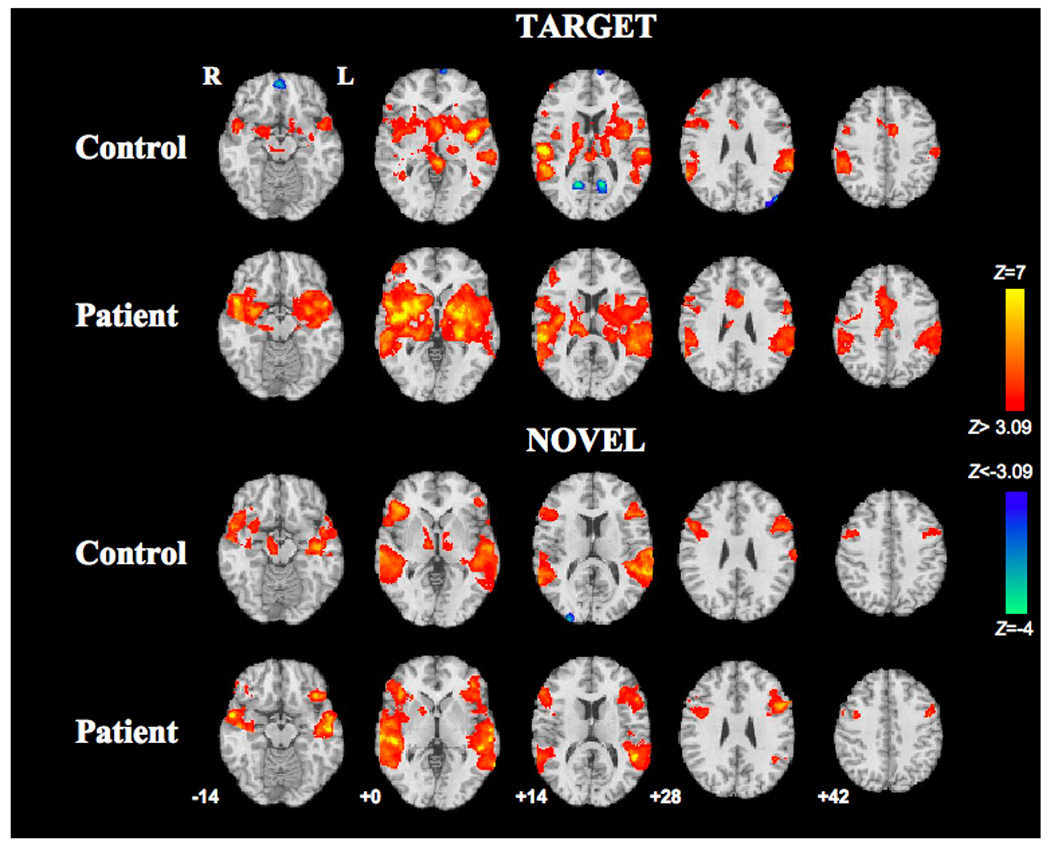
Target-induced (top) and novel-induced (bottom) activations (red) and deactivations (blue) in the control group and schizophrenia group. Z statistic maps are thresholded at Z>3.09 (two-tailed p <.002, uncorrected), and overlaid on the MNI template brain. Axial slices are labeled with corresponding MNI z-coordinates:−14, 0, +14, +28, +42. Right side of brain is displayed on left side of image.
Table 3.
Localization of Significant fMRI Responses to Target and Novel Stimuli in Controls and Patients.
| Target Controls | Target Patients | Target Patients>Controls | ||||||||||||||||
|---|---|---|---|---|---|---|---|---|---|---|---|---|---|---|---|---|---|---|
| Region (BA) | Hem | x | y | z | Zmax | Clst | Hem | x | y | z | Zmax | Clst | Hem | x | y | z | Zmax | Clst |
| Activation | ||||||||||||||||||
| Sup Frontal Gyr (10) | R | 38 | 48 | 22 | 4.25 | E | ||||||||||||
| Mid Frontal Gyr (9,46) | R | 54 | 10 | 26 | 4.53 | C | R | 48 | 42 | 8 | 4.82 | M | ||||||
| Precentral Gyr (6) | L | −60 | 2 | 26 | 5.07 | K | L | −58 | 0 | 24 | 3.89 | N | ||||||
| Precentral Gyr (6) | R | 50 | 0 | 38 | 4.41 | C | R | 48 | −10 | 46 | 4.15 | K | ||||||
| Frontal Operc (44,45) | L | 8 | 6 | 1 | 6.32 | A | L | −60 | 12 | 6 | 5.49 | K | ||||||
| Frontal Operc (44,45) | R | 54 | 10 | 10 | 6.59 | K | ||||||||||||
| Inf Frontal Gyr (47) | L | −38 | 22 | −8 | 4.69 | K | ||||||||||||
| Inf Frontal Gyr (47) | R | 34 | 24 | −8 | 3.94 | A | R | 38 | 22 | −8 | 6.45 | K | ||||||
| Ant Cingulate/SMA (24,32) | Mid | −6 | 2 | 40 | 5.02 | D | Mid | −4 | 16 | 30 | 6.32 | L | Mid | −6 | 34 | 18 | 3.24 | P |
| Sup Temporal Pole (38,22) | L | −50 | 10 | −10 | 5.78 | A | L | −50 | 8 | −14 | 7.20 | K | ||||||
| Sup Temporal Pole (38,22) | R | 52 | 8 | −16 | 5.05 | A | R | 52 | 12 | −12 | 7.71 | K | ||||||
| Insula/Claustrum (13) | L | −44 | 0 | 6 | 8.55 | A | L | −30 | 8 | 6 | 7.41 | K | L | −34 | −24 | 12 | 3.74 | N |
| Insula/Claustrum (13) | R | 38 | −2 | 8 | 5.63 | A | R | 38 | −2 | 2 | 9.56 | K | R | 36 | −6 | −2 | 3.80 | O |
| Hippocampus | L | −30 | −18 | −12 | 3.38 | A | L | −34 | −18 | −14 | 4.39 | K | L | −30 | −30 | −2 | 3.84 | N |
| Hippocampus | R | 28 | −22 | −12 | 3.41 | A | R | 32 | −20 | −10 | 5.30 | K | ||||||
| Amygdala | R | 24 | 0 | −14 | 4.01 | A | ||||||||||||
| Pos STG/MTG (22,21) | L | −58 | −26 | 14 | 7.00 | B | L | −60 | −30 | 16 | 5.50 | K | L | −60 | −4 | 0 | 2.33 | N |
| Pos STG/MTG (22,21) | R | 58 | −22 | 14 | 8.15 | A | R | 60 | −28 | 14 | 8.65 | K | R | 54 | −8 | −4 | 3.87 | O |
| SMG/IPL (40) | L | −60 | −40 | 30 | 6.51 | B | L | −66 | −44 | 28 | 5.59 | K | ||||||
| SMG/IPL (40) | R | 62 | −48 | 24 | 7.13 | A | R | 62 | −48 | 24 | 6.11 | K | ||||||
| Postcentral Gyr (2) | L | −64 | −22 | 20 | 5.35 | B | L | −62 | −28 | 18 | 6.08 | K | ||||||
| Postcentral Gyr (2) | R | 54 | −38 | 50 | 5.22 | A | R | 58 | −44 | 46 | 4.79 | K | ||||||
| Lateral Septum | Mid | −2 | 4 | 4 | 6.10 | A | ||||||||||||
| Striatum | L | −24 | 10 | 8 | 5.18 | A | L | −30 | 4 | 0 | 8.25 | K | ||||||
| Striatum | R | 28 | 14 | 0 | 4.42 | A | R | 36 | 2 | 0 | 8.45 | K | ||||||
| Ventral Striatum/Accumbens | L | −4 | 12 | −6 | 4.31 | A | L | −20 | 8 | −4 | 6.39 | K | ||||||
| Ventral Striatum/Accumbens | R | 22 | 10 | −6 | 4.01 | A | R | 24 | 6 | −4 | 7.24 | K | ||||||
| Globus Pallidus | L | L | −16 | 4 | −4 | 6.99 | K | |||||||||||
| Thalamus | L | −16 | −16 | 14 | 4.92 | A | L | −12 | −12 | 6 | 5.31 | K | ||||||
| Thalamus | R | 16 | −12 | 14 | 5.18 | A | R | 16 | −20 | 10 | 7.68 | K | ||||||
| Midbrain | R | 12 | −20 | −12 | 3.85 | A | R | 18 | −24 | −6 | 5.61 | K | ||||||
| Deactivation | ||||||||||||||||||
| Medial Frontal Gyr (10,11) | Mid | 0 | 54 | 12 | −3.91 | I | ||||||||||||
| Sup Frontal Gyrus (10) | Mid | −6 | 72 | 6 | −4.05 | G | ||||||||||||
| Sup/Mid Occip Gyr (18,19) | L | −40 | −84 | 34 | −3.80 | H | R | 36 | −96 | 10 | 3.3 | Q | ||||||
| Pos Cingulate (30) | L | −12 | 60 | 14 | −4.15 | F | ||||||||||||
| Pos Cingulate (30) | R | 16 | −62 | 14 | −4.10 | J | ||||||||||||
| Novel Controls | Novel Patients | Novel Patients>Controls | ||||||||||||||||
| Region (BA) | Hem | x | y | z | Zmaxv | Clst | Hem | x | y | z | Zmax | Clst | Hem | x | y | z | Zmax | Clst |
| Activation | ||||||||||||||||||
| Mid Frontal Gyr (46,9) | L | −40 | 14 | 22 | 5.28 | T | L | −48 | 12 | 30 | 6.93 | W | ||||||
| Mid Frontal Gy (9,46) | R | 52 | 14 | 28 | 5.19 | R | R | 56 | 30 | 14 | 5.39 | X | ||||||
| Precentral Gyr (6) | L | −40 | 4 | 8 | 3.78 | T | L | −40 | 6 | 34 | 5.58 | W | ||||||
| Precentral Gyr (6) | R | 52 | 4 | 42 | 4.17 | R | R | 40 | 4 | 32 | 5.56 | X | ||||||
| Inf Frontal Gyr (45,47) | L | −42 | 24 | 14 | 5.56 | T | L | −40 | 26 | −10 | 6.89 | W | L | −44 | 28 | −8 | 3.28 | Z |
| Inf Frontal Gyr (45,47) | R | 52 | 26 | 4 | 6.55 | R | R | 44 | 28 | −4 | 7.29 | X | ||||||
| Mid STG/MTG | L | −56 | −16 | 4 | 8.65 | S | L | −60 | −24 | 0 | 8.45 | W | ||||||
| Mid STG/MTG | R | 60 | −12 | −12 | 9.44 | R | R | 62 | −12 | −6 | 11.44 | X | ||||||
| Sup Temporal Pole (38,22) | L | −48 | 4 | −14 | 4.93 | S | L | −56 | 0 | −12 | 6.63 | W | ||||||
| Sup Temporal Pole (38,22) | R | 56 | 10 | −18 | 6.71 | R | R | 54 | 8 | −18 | 6.25 | X | ||||||
| Insula (13)/Claustrum | L | −46 | 8 | 4 | 4.84 | W | ||||||||||||
| Insula (13)/Claustrum | R | 38 | −2 | −2 | 4.48 | W | ||||||||||||
| Hippocampus | L | −23 | −22 | −10 | 5.17 | S | ||||||||||||
| Hippocampus | R | 38 | −12 | −14 | 3.57 | R | ||||||||||||
| Amygdala | R | 34 | 4 | −20 | 5.8 | R | ||||||||||||
| Pos STG/MTG (22,21) | L | −50 | −42 | 12 | 8.75 | S | L | −52 | −34 | 0 | 9.33 | W | ||||||
| Pos STG/MTG (22,21) | R | 62 | −44 | 16 | 6.15 | R | R | 58 | −42 | 2 | 7.76 | X | ||||||
| SMG/IPL (40) | L | −62 | −28 | 18 | 6.64 | S | ||||||||||||
| Ventral Striatum/Accumbens | R | 18 | 4 | −8 | 3.81 | R | R | 18 | 8 | 0 | 4.45 | Y | ||||||
| Globus Pallidus | L | −10 | 0 | 4 | 3.99 | U | ||||||||||||
| Globus Pallidus | R | 14 | 6 | 0 | 4.77 | R | ||||||||||||
| Thalamus | L | −12 | −14 | 2 | 4.4 | U | ||||||||||||
| Thalamus | R | 12 | −12 | 0 | 4.77 | R | ||||||||||||
| Midbrain/Substantia Nigra | R | 10 | −16 | −16 | 4.48 | R | ||||||||||||
| Deactivation | ||||||||||||||||||
| Mid Occip Gyr (18) | R | 28 | −96 | 10 | −4.08 | V | ||||||||||||
Abbreviations: BA, Brodmann Area, L, left; R, right; Hem, hemisphere; Clst, cluster; Gyr, gyrus; Mid, middle; Inf, inferior; Sup, superior; Pos, posterior; SMA, supplementary motor area; STG, superior temporal gyrus; MTG, middle temporal gyrus; IPL, inferior parietal lobule; SMG, supramarginal gyrus.
x,y, z coordinates are in millimeters, Montreal Neurological Institute (MNI) system.
Selected local maxima are shown, with voxel-level Z statistics; only maxima within statistically significant clusters (p < .05 corrected) are shown. Individual clusters are identified by capital letters.
Cluster sizes in voxels (8mm3/voxel): A 13477, B 2967, C 607, D 449, E 255, F 246, G 224, H 211, I 157, J 127, K 27515, L 2151, M 504, N 2554, O 1800, P 987, Q 852, R 6536, S 5624, T 1523, U 273, V 120, W 8344, X 6542, Y 85, Z 867.
Novel Compared to Standard Baseline
In the novel condition, again controls and patients exhibited a similar regional pattern of response (Fig. 1 and Table 3), consistent with the literature (Kiehl et al. 2001, 2005a, 2005b; Laurens et al. 2005; Opitz et al. 1999b). Both groups activated the superior and middle temporal gyri (extending from TPJ to temporal pole); dorsal and ventral lateral frontal cortex; and right ventral striatum. Controls, but not patients, had significant activation in bilateral MTL, thalamus, pallidum, and right midbrain. Patients, but not controls, had significant activation in bilateral insula. Controls exhibited significant deactivation in right occipital cortex; patients did not show any significant deactivations.
Between-Group Contrasts
Direct comparison of the two groups did not identify any regions where controls had significantly greater activation than patients to targets or novel stimuli. In contrast, a number of regions showed significantly higher activity in patients (Fig. 2 and Table 3). For the target condition, this included regions where both groups activated (but patients more so): bilateral posterior superior temporal gyrus, bilateral insula, left hippocampus, anterior cingulate, left premotor cortex. Significantly greater BOLD signal was also seen in patients in right occipital cortex due to less deactivation in patients than controls. For the novel condition, patients showed greater activation than controls in left ventrolateral prefrontal cortex (VLPFC). These results were not significantly affected by including reaction time, education, or parental education (the only demographic or performance which differed significantly between groups) as nuisance covariates.
Fig. 2. Between-group differences in BOLD response to target and novel stimuli.
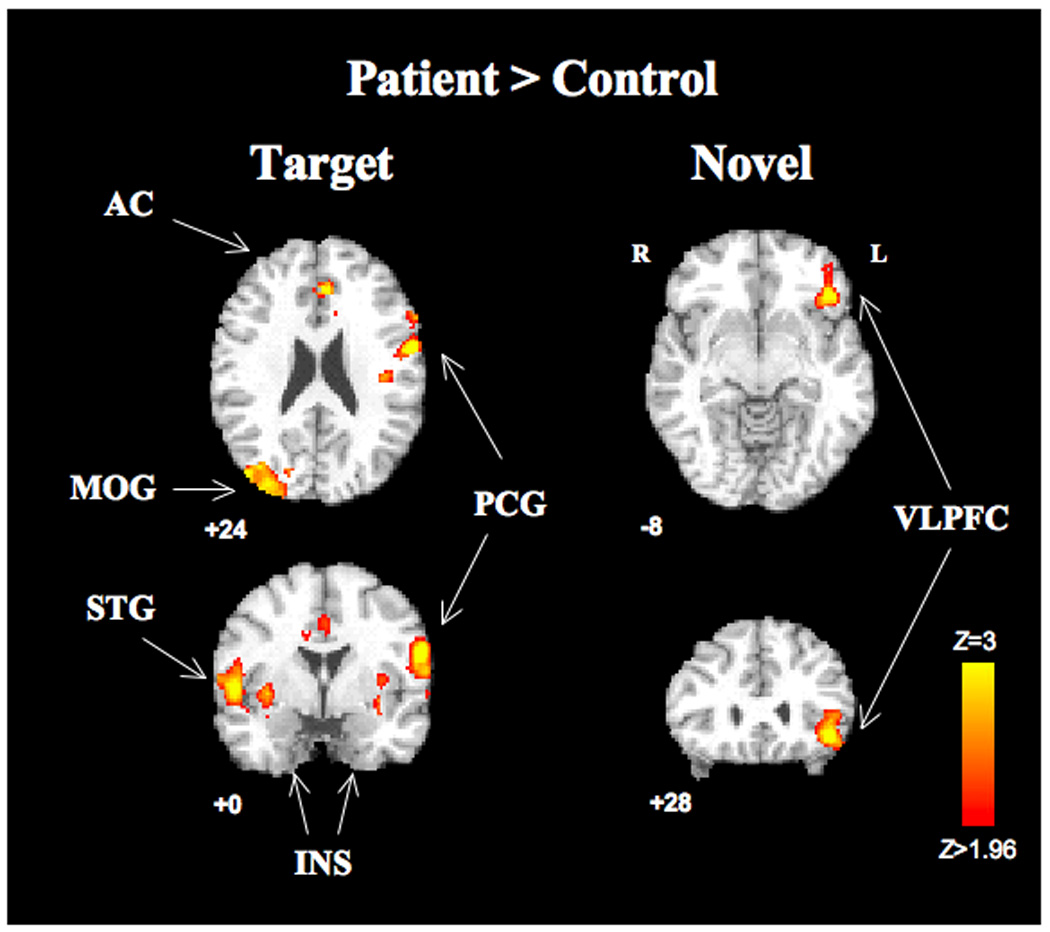
Clusters with significant between group differences in target (left) and novel (right) conditions (cluster-corrected p <.05, voxel height threshold p <.05 two-tailed uncorrected) are overlaid on the MNI template brain. For target condition, images are centered at MNI −58 0 24; for novel condition at MNI −44, 28 −8. There were no significant control>patient clusters. Right side of brain is displayed on left side of image. Abbreviations: AC, anterior cingulate; VLPFC, ventrolateral prefrontal cortex; MOG, middle occipital gyrus, INS, insula; PCG, precentral gyrus
Correlations with Clinical Symptoms
Additional analyses were performed in patients to identify brain regions whose activity during the target or novel conditions covaried with severity of negative or positive symptoms. A single significant cluster in the left frontal cortex exhibited a negative correlation of novel-induced BOLD signal with SANS scores (Fig. 3), indicating lower levels of activation in patients with more severe negative symptoms. This cluster (1233 voxels) comprised portions of left dorsolateral prefrontal cortex (DLPFC, BA9,46; peak Z 3.45, MNI −48 14 38 ) and left precentral gyrus (BA 4,6; peak Z 3.19 MNI −54 −12 40). For Novel-SANS, there were no significant regions of positive correlation. No significant regions of positive or negative correlation were identified for Target-SAPS, Target-SANS, or Novel-SAPS.
Fig. 3. Negative correlation between SANS and fMRI activation in novel condition.
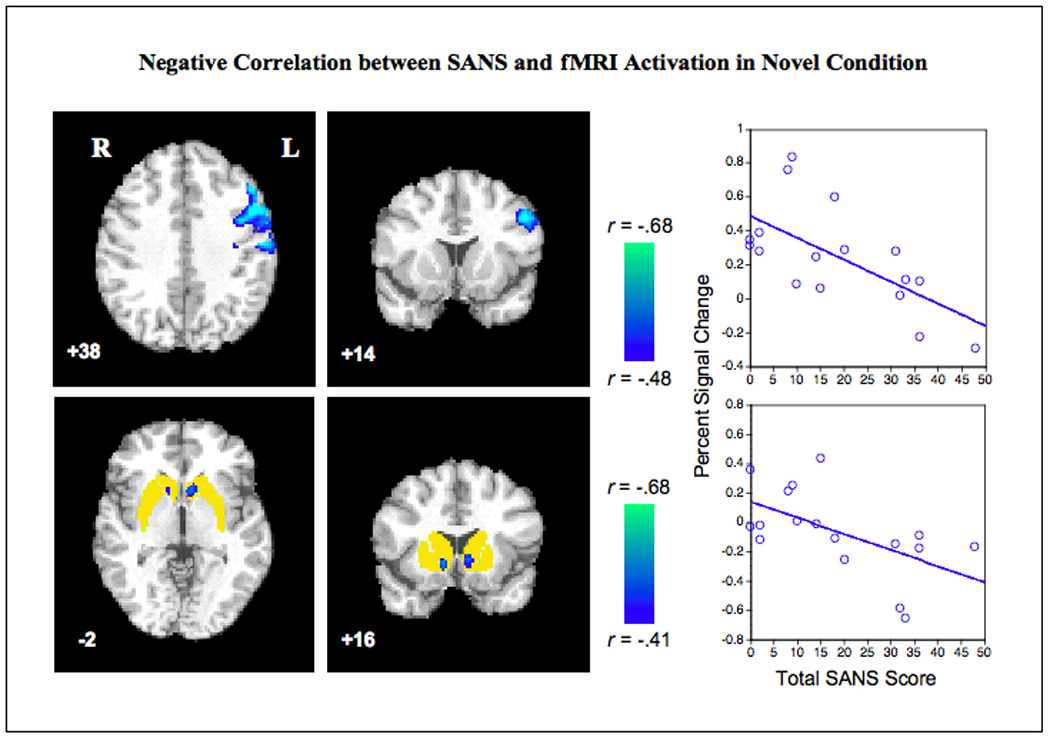
Patients with greater negative symptoms show lower activation by novel stimuli in left dorsolateral frontal cortex (upper panels) and bilateral ventral striatum/nucleus accumbens (lower panels). Only significant clusters are displayed (cluster-corrected p < .05). Voxel height thresholds for inclusion in clusters were p <.05 two-tailed uncorrected for bidirectional whole-brain analysis (upper panels), and p <.05 one-tailed uncorrected for the directional analysis restricted to the a priori striatal ROI (lower panels, ROI shown in yellow). Color bars show correlation coefficients (r values) corresponding to the regression Z statistics. Right side of brain is displayed on left side of image. Scatter plots show total SANS score on x-axis; y-axis shows percent signal change in the peak voxel in the left frontal cluster (top, MNI −48,14,38, Pearson’s r −.6476, p = .005, two tailed) and left ventral striatum cluster (bottom, MNI −6,16,−2, Pearson’s r −.573, p=.008, one-tailed). Abbreviations: MFG, middle frontal gyrus; VSTR, ventral striatum; SANS, Scale for the Assessment of Negative Symptoms.
Based on the a priori hypothesis that striatum would be less responsive to salient stimuli in patients with more severe negative symptoms, and more responsive in those with greater positive symptoms, we performed an additional analysis restricted to the striatum. Two significant clusters exhibiting the predicted inverse correlation between the novel BOLD response and negative symptoms were seen in bilateral ventral striatum within the nucleus accumbens (Fig. 3) (left: 63 voxels, peak Z 2.26, MNI −6 16 −2; right: 62 voxels, peak Z 2.51, MNI 12 16 −4). However, no significant negative correlations with SANS were found for the striatal BOLD response to target stimuli, nor were significant positive correlations with SAPS identified.
Of note, SANS scores were not significantly correlated with other clinical or demographic variables, or with motion during scanning. Including antipsychotic dose (chlorpromazine equivalents) or type (first-generation antipsychotic present or absent) as nuisance covariates did not significantly alter the observed clinical correlation results, or the findings from the within-group and between-group task-activation analyses.
Discussion
Our results replicate prior fMRI studies describing the regional pattern of neural responses to task-relevant and task-irrelevant salient auditory stimuli in healthy controls (Kiehl et al. 2001, 2005b; Linden et al. 1999; Menon et al. 1997; Opitz et al. 1999b; Opitz et al. 1999a; Stevens et al. 2000). We also confirm prior reports that schizophrenia patients exhibit a regional pattern qualitatively similar to that of controls (Kiehl and Liddle, 2001; Kiehl et al. 2005a; Laurens et al. 2005; Liddle et al. 2006). Our findings extend knowledge regarding abnormal responses to deviant stimuli in schizophrenia by identifying region-specific overactivation, as well as attenuations in deactivation observed in controls. Further, we show that patients with more severe negative symptoms have reduced neural responses to novel distractors in both frontal executive regions and limbic motivational regions.
Increased BOLD Responses to Deviant Stimuli in Schizophrenia
The observed overactivation in response to deviant stimuli is consistent with our finding with a visual oddball paradigm (Gur et al. 2007b), and supports the hypothesis that schizophrenia patients are hyperresponsive to salience (Kapur 2003). This may be a direct consequence of the illness, but may also reflect other factors associated with schizophrenia, such as increased arousal or anxiety in response to task demands or fMRI scanning. Although schizophrenia is associated with impaired frontal lobe function, this does not necessarily translate into hypoactivation during task performance. For target detection, many of the same frontal regions that were most robustly activated by targets in the control subjects were overactivated in patients, including the anterior cingulate and premotor cortex. In fMRI studies of working memory tasks, similar frontal overactivation has been found in circumstances where schizophrenia patients perform as well as controls, and has been interpreted as reflecting inefficient neural processing (Callicott et al. 2000).
In response to novel stimuli, patients overactivated the VLPFC. This region is associated with response inhibition (Blasi et al. 2006; Menon et al. 2001), an important part of successful task performance in the face of salient distractors. Overactivation in this region could reflect inefficiency in frontally-mediated response inhibition; alternatively, it could reflect a greater demand for response inhibition secondary to a stronger automatic response to the novel stimuli. This latter hypothesis is consistent with behavioral and electrophysiological evidence that patients have difficulty ignoring irrelevant stimuli (Gray 1995; Grillon et al. 1990). On the other hand, as BOLD responses were not increased in subcortical regions, our data does not fully support this hypothesis.
We found increased activation in patients for both target and novel stimuli, with no regions showing the reverse effect of greater activation in controls. However, this does not reflect global hyperactivation in patients, as several regions tended towards greater activation in control subjects. Few fMRI studies have compared schizophrenia patients and healthy controls using an oddball task (Ford et al. 2005; Gur et al. 2007b; Kiehl and Liddle, 2001; Kiehl et al. 2005a; Laurens et al. 2005; Liddle et al. 2006; Morey et al. 2005). In contrast to our findings, the majority of these have described diffuse reductions in activation magnitudes in the patient group, to both target (Kiehl and Liddle, 2001; Kiehl et al. 2005a; Liddle et al. 2006; Morey et al. 2005) and novel (Kiehl et al. 2005a; Laurens et al. 2005) stimuli. However, some of these earlier studies report subthreshold overactivation, suggesting that divergent results may stem partly from limitations in statistical power. For example, Kiehl et al. (2005a) reported subthreshold target-induced overactivation in patients in bilateral ventral PFC and precentral gyrus, and Laurens et al. (2005) found overactivation to novel stimuli in the supplementary motor area. Population differences in terms of illness phenotype, severity, or performance, or differences in imaging acquisition, processing or statistical analysis, could also be important factors.
In our parallel study of response to visual deviants in schizophrenia (Gur et al. 2007b), both overactivated and underactivated regions were identified in both target and novel conditions. However, underactivation was more prominent for targets while overactivation was more prominent only for novel distractors. While left VLPFC overactivation to novel distractors was common to both auditory and visual paradigms, other regional abnormalities diverged. This suggests the nature of abnormal neural responses to deviant stimuli, particularly targets, differs based on sensory modality, which might be illuminated by direct comparisons within the same subjects. Indeed, ERP studies demonstrated differential P300 deficits during auditory vs. visual processing within the same subjects (Mathalon et al. 2000; Pfefferbaum et al. 1989). The auditory system may have unique vulnerabilities in schizophrenia, due to structural deficits throughout the temporal lobe (Kuroki et al. 2006). However, the observed fMRI overactivation stands in contrast to reductions in P300 ERP responses for both targets and distractors, typically observed in schizophrenia (Mathalon et al. 2000; Turetsky et al. 1998b). This argues against a simple correspondence of P300 and BOLD responses, and points to the need for further studies examining their relationship within the same samples.
Deactivations
In the healthy control group, we observed deactivation (negative BOLD responses relative to baseline) to target stimuli within ventromedial prefrontal cortex, posterior cingulate, and extrastriate visual cortex. Patients did not exhibit significant deactivations, and had statistically significant reductions in deactivation within right occipital cortex.
The ventromedial prefrontal cortex and posterior cingulate are major components of the “default-mode network,” believed to mediate spontaneous self-reflective mental activity (Greicius et al. 2003; Mason et al. 2007; Raichle et al. 2001). Deactivation is commonly observed in these regions during tasks (such as target detection) that require outwardly-focused attention. It is therefore surprising that few fMRI studies of the oddball task (Calhoun et al. 2006; Garrity et al. 2007; Gur et al. 2007a; Stevens et al. 2000) have reported deactivation to target stimuli. Some earlier studies may have excluded deactivations from analysis, as decreases in BOLD signal have traditionally been considered more difficult to interpret than increases. However, recent evidence supports the interpretation of deactivations as a decrease in neural activity (Pasley et al. 2006; Shmuel et al. 2002).
While extrastriate visual cortex has not been described as part of the ‘classic’ default-mode network, similar resting-state activity has been reported there (Damoiseaux et al. 2006). Crossmodal deactivation has been observed in visual cortex during auditory stimulation and in auditory cortex during visual stimulation, revealing an attentional mechanism that inhibits task-irrelevant sensory modalities (Amedi et al. 2005; Laurienti et al. 2002). Attenuated occipital deactivation in schizophrenia patients may thus reflect impairment of this attentional mechanism, leading to greater distractibility from task-irrelevant sensory inputs. Whether this reflects a specific deficit in crossmodal inhibition, or an effect of generalized arousal is unclear; anxiety has been shown to reduce task-related deactivations in ventromedial PFC (Simpson et al. 2001).
Three recent studies also report attenuated deactivation in schizophrenia patients, related to performance and symptoms (Garrity et al. 2007; Harrison et al. 2007; Menzies et al. 2007). These findings justify greater attention to deactivations as a potential window into the pathophysiology of schizophrenia.
Relationship of fMRI Activation to Clinical Symptoms
Greater negative symptoms were associated with reduced BOLD responses to novel stimuli within the left DLPFC, left premotor cortex, and bilateral nucleus accumbens. To our knowledge, only one other fMRI study has examined the relationship of positive and negative symptoms to neural responses in an auditory oddball task (Garrity et al. 2007), identifying a correlation between positive symptoms and task-induced deactivation. However, this study used a different statistical method (independent components analysis), and only examined brain regions within the ‘default-mode’ network. Therefore, the current results should be considered tentative until replicated.
Frontal lobe hypofunction has been thought to underlie negative symptoms of schizophrenia (Andreasen et al. 1992; Ho et al. 2003; Liddle et al. 1992; Mahurin et al. 1998), consistent with the apathy and avolition often observed following traumatic frontal lobe injury (Andersson and Bergedalen 2002). More recently, hypofunction in the ventral striatum during reward or emotion processing has also been linked to negative symptoms in schizophrenia (Juckel et al. 2006a; Taylor et al. 2005). The ventral striatum plays a key role in reward and motivation, and reduced function in this region has been linked to avolition and anhedonia in depression (Epstein et al. 2006; Keedwell et al. 2005). We demonstrate that reduced ventral striatum activation in schizophrenia occurs in response to novelty, not just to rewarding or emotional stimuli, consistent with a broad view of this region’s role in responding to salience (Berridge and Robinson 1998; Jensen et al. 2006; Lisman and Grace 2005; Zink et al. 2006). Ventral striatum hypofunction could play a causal role in the initiation, maintenance, or progression of negative symptoms, and represents a promising intermediate phenotype for future study.
The lack of significant correlations in the target condition suggests that negative symptoms may affect responses to task-irrelevant stimuli more than task-relevant stimuli. Perhaps task-relevant stimuli produce a stronger salience signal that is less vulnerable to the attenuating effects of negative symptoms. Alternatively, negative symptoms may be specifically related to difficulty recruiting additional attentional resources in the face of increased distraction (Silver and Feldman 2005). Notably, in subjects with frontal lobe injury, behavioral and P300 ERP responses to novel stimuli were more reduced in those with greater apathy; this was not seen for target stimuli (Daffner et al. 2000). A recent study of apathy in schizophrenia did not show behavioral changes selective for novel stimuli, suggesting imaging may be more sensitive to novelty-related abnormalities (Roth et al. 2008).
We did not find evidence to support our hypothesis that positive symptoms would be related to greater neural responses to deviant stimuli. While we expect positive symptoms would increase the salience of sensory experience, this effect is potentially opposed by increased preoccupation with internal stimuli that may simultaneously tend to reduce neural responses to external stimuli. This phenomenon has been demonstrated for auditory processing of external speech sounds in patients with hallucinations (Plaze et al. 2006). Attentional processes, even in response to simple targets or novel distractors, may also be sufficiently complex that tasks isolating finer subcomponents of attention would be better able to reveal effects of positive symptoms.
Limitations and Future Directions
Patients in this study had mild symptoms; more severe symptoms might have had a greater effect on activation patterns. This limited severity range may also have contributed to the lack of significant correlations with positive symptoms. However, the significant findings with respect to negative symptoms demonstrate that even in the mild range, BOLD responses can significantly predict symptom severity. Sample size may also have limited our ability to fully characterize the clinical correlations; using a visual paradigm and a larger sample, region-specific correlations in both directions were found in response to both target and novel stimuli (Gur et al. 2007b). Clinical heterogeneity within our sample (with respect to medication status and type, duration of illness, and the inclusion of a patient with schizoaffective disorder, depressed type) could potentially limit our ability to detect effects compared to a more homogenous sample. While grouping symptoms into positive and negative domains has both clinical and statistical validity (Andreasen 1984a, 1984b) correlations with specific symptoms could be obscured. Future studies may reveal stronger, or more distinctive relationships between specific symptoms and responses to salient stimuli.
Medication effects constitute another potential confound. VS activation during reward anticipation can be reduced by both first- and second-generation antipsychotics (Abler et al. 2007; Juckel et al. 2006b). This effect may be stronger for first-generation antipsychotics, and an inverse correlations between negative symptoms and VS activity during reward anticipation was observed in schizophrenia patients taking first-generation antipsychotics but not those on second-generation medications (Juckel et al. 2006b; Schlagenhauf et al. 2007). In the current study, sample size was too small for a meaningful separation of patients into those who did and did not use typical antipsychotics; however the relationship between negative symptoms and ventral striatum hypoactivation remained significant when typical antipsychotic use was included as a binary covariate. Controlling for antipsychotic dose also did not alter the observed group differences or clinical correlation results. While these observations reduce the likelihood that our results are influenced by medication effects, larger studies directly comparing groups with different medication status will be required to resolve this issue definitively.
A weakness of the BOLD fMRI method is that it provides only relative measures of activation, which precludes the assessment of differences in baseline levels of activity. Use of a second lower-level baseline such as crosshair fixation would provide further information; combining fMRI and perfusion MRI could prove even more powerful (Canli et al. 2006).
Conclusion
Our results provide information on the regional brain response to a standard auditory attentional task, separating responses to targets and distractors. We found similar activation patterns in patients and healthy controls, but patients showed overactivation in specific regions for both targets and distractors and failed to show deactivation observed in controls. Furthermore, magnitude of activation responses to novel stimuli in left DLPFC, left premotor cortex, and bilateral nucleus accumbens was associated with greater severity of negative symptoms. These findings may yield additional insights into both normal and aberrant responses to salient stimuli in schizophrenia, and point the way toward new avenues of investigation.
Acknowledgements
This study was supported by National Institutes of Health grants T32-MH019112, Scottish Rite Foundation (D.H.W.), NARSAD Young Investigator Award (D.H.W., sponsored by the Sidney R. Baer, Jr. Foundation) and National Institute of Mental Health Conte Center MH-64045 (REG). We thank Kosha Ruparel and Jeffrey Valdez for assistance with neuroimaging analysis and presentation.
References
- Abler B, Erk S, Walter H. Human reward system activation is modulated by a single dose of olanzapine in healthy subjects in an event-related, double-blind, placebo-controlled fMRIstudy. Psychopharmacology. 2007;191(3):823–833. doi: 10.1007/s00213-006-0690-y. [DOI] [PubMed] [Google Scholar]
- Amedi A, Malach R, Pascual-Leone A. Negative bold differentiates visual imagery and perception. Neuron. 2005;48(5):859–872. doi: 10.1016/j.neuron.2005.10.032. [DOI] [PubMed] [Google Scholar]
- Andersson S, Bergedalen AM. Cognitive correlates of apathy in traumatic brain injury. Neuropsychiatry, Neuropsychoogy, and Behavioral Neurology. 2002;15(3):184–191. [PubMed] [Google Scholar]
- Andreasen NC. Scale for the assessment of negative symptoms (SANS) Iowa City: University of Iowa; 1984a. [Google Scholar]
- Andreasen NC. Scale for the assessment of positive symptoms (SAPS) Iowa City: University of Iowa; 1984b. [Google Scholar]
- Andreasen NC, Rezai K, Alliger R, Swayze VW, 2nd, Kirchner Flaum, M P, Cohen G, O’Leary DS. Hypofrontality in neuroleptic-naive patients and in patients with chronic schizophrenia. Assessment with xenon 133 single-photon emission computed tomography and the Tower of London. Archives of General Psychiatry. 1992;49(12):943–958. doi: 10.1001/archpsyc.1992.01820120031006. [DOI] [PubMed] [Google Scholar]
- Beckmann CF, Jenkinson M, Smith SM. General multilevel linear modeling for group analysis in fMRI. Neuroimage. 2003;20(2):1052–1063. doi: 10.1016/S1053-8119(03)00435-X. [DOI] [PubMed] [Google Scholar]
- Berridge KC, Robinson TE. What is the role of dopamine in reward: hedonic impact, reward learning, or incentive salience? Brain Research Reviews. 1998;28(3):309–369. doi: 10.1016/s0165-0173(98)00019-8. [DOI] [PubMed] [Google Scholar]
- Blasi G, Goldberg TE, Weickert T, Das S, Kohn P, Zoltick B, Bertolino A, Callicott JH, Weinberger DR, Mattay VS. Brain regions underlying response inhibition and interference monitoring and suppression. European Journal of Neuroscience. 2006;23(6):1658–1664. doi: 10.1111/j.1460-9568.2006.04680.x. [DOI] [PubMed] [Google Scholar]
- Braff DL. Information processing and attention dysfunctions in schizophrenia. Schizophrenia Bulletin. 1993;19(2):233–259. doi: 10.1093/schbul/19.2.233. [DOI] [PubMed] [Google Scholar]
- Calhoun VD, Adali T, Pearlson GD, Kiehl KA. Neuronal chronometry of target detection: Fusion of hemodynamic and event-related potential data. Neuroimage. 2006;30(2):544–553. doi: 10.1016/j.neuroimage.2005.08.060. [DOI] [PubMed] [Google Scholar]
- Callicott JH, Bertolino A, Mattay VS, Langheim FJ, Duyn J, Coppola R, Goldberg TE, Weinberger DR. Physiological dysfunction of the dorsolateral prefrontal cortex in schizophrenia revisited. Cerebral Cortex. 2000;10(11):1078–1092. doi: 10.1093/cercor/10.11.1078. [DOI] [PubMed] [Google Scholar]
- Canli T, Qiu M, Omura K, Congdon E, Haas BW, Amin Z, et al. Neural correlates of epigenesis. Proceedings of the Nationall Academy of Sciences USA. 2006;103(43):16033–16038. doi: 10.1073/pnas.0601674103. [DOI] [PMC free article] [PubMed] [Google Scholar]
- Culham JC. Functional neuroimaging: Experimental design and analysis. In: Cabeza R, Kingstone A, editors. Handbook of Functional Neuroimaging of Cognition. 2nd ed. Cambridge, MA: MIT Press; 2006. [Google Scholar]
- Daffner KR, Mesulam MM, Scinto LF, Acar D, Calvo V, Faust R, et al. The central role of the prefrontal cortex in directing attention to novel events. Brain. 2000;123(Pt 5):927–939. doi: 10.1093/brain/123.5.927. [DOI] [PubMed] [Google Scholar]
- Damoiseaux JS, Rombouts SA, Barkhof F, Scheltens P, Stam CJ, Smith SM, et al. Consistent resting-state networks across healthy subjects. Proceedings of the National Academy of Sciences USA. 2006;103(37):13848–13853. doi: 10.1073/pnas.0601417103. [DOI] [PMC free article] [PubMed] [Google Scholar]
- Epstein J, Stern E, Silbersweig D. Mesolimbic activity associated with psychosis in schizophrenia. Symptom-specific PET studies. Annals of the New York Academy of Sciences. 1999;877:562–574. doi: 10.1111/j.1749-6632.1999.tb09289.x. [DOI] [PubMed] [Google Scholar]
- Epstein J, Pan H, Kocsis JH, Yang Y, Butler T, Chusid J, et al. Lack of ventral striatal response to positive stimuli in depressed versus normal subjects. American Journal of Psychiatry. 2006;163(10):1784–1790. doi: 10.1176/ajp.2006.163.10.1784. [DOI] [PubMed] [Google Scholar]
- First MB, Spitzer RL, Gibbon M, Williams JBW. Structured clinical interview for DSM-IV Axis I disorders, patient edition (SCID-P), version 2. Biometics Research. New York: New York State Psychiatric Institute; 1996. [Google Scholar]
- Ford JM, Johnson MB, Whitfield SL, Faustman WO, Mathalon DH. Delayed hemodynamic responses in schizophrenia. Neuroimage. 2005;26(3):922–931. doi: 10.1016/j.neuroimage.2005.03.001. [DOI] [PubMed] [Google Scholar]
- Forman SD, Cohen JD, Fitzgerald M, Eddy WF, Mintun MA, Noll DC. Improved assessment of significant activation in functional magnetic resonance imaging (fMRI): Use of a cluster-size threshold. Magnetic Resonance in Medicine. 1995;33(5):636–647. doi: 10.1002/mrm.1910330508. [DOI] [PubMed] [Google Scholar]
- Garrity AG, Pearlson GD, McKiernan K, Lloyd D, Kiehl KA, Calhoun VD. Aberrant “default mode” functional connectivity in schizophrenia. American Journal of Psychiatry. 2007;164(3):450–457. doi: 10.1176/ajp.2007.164.3.450. [DOI] [PubMed] [Google Scholar]
- Gray JA. Dopamine release in the nucleus accumbens: The perspective from aberrations of consciousness in schizophrenia. Neuropsychologia. 1995;33(9):1143–1153. doi: 10.1016/0028-3932(95)00054-7. [DOI] [PubMed] [Google Scholar]
- Gray JA, Joseph MH, Hemsley DR, Young AM, Warburton EC, Boulenguez P, et al. The role of mesolimbic dopaminergic and retrohippocampal afferents to the nucleus accumbens in latent inhibition: Implications for schizophrenia. Behavioural Brain Research. 1995;71(1–2):19–31. doi: 10.1016/0166-4328(95)00154-9. [DOI] [PubMed] [Google Scholar]
- Green MF. What are the functional consequences of neurocognitive deficits in schizophrenia? American Journal of Psychiatry. 1996;153(3):321–330. doi: 10.1176/ajp.153.3.321. [DOI] [PubMed] [Google Scholar]
- Greicius MD, Krasnow B, Reiss AL, Menon V. Functional connectivity in the resting brain: A network analysis of the default mode hypothesis. Proceedings of the National Academy of Sciences USA. 2003;100(1):253–258. doi: 10.1073/pnas.0135058100. [DOI] [PMC free article] [PubMed] [Google Scholar]
- Grillon C, Courchesne E, Ameli R, Geyer MA, Braff DL. Increased distractibility in schizophrenic patients. Electrophysiologic and behavioral evidence. Archives of General Psychiatry. 1990;47(2):171–179. doi: 10.1001/archpsyc.1990.01810140071010. [DOI] [PubMed] [Google Scholar]
- Gur RC, Turetsky BI, Loughead J, Waxman J, Snyder W, Ragland JD, et al. Hemodynamic responses in neural circuitries for detection of visual target and novelty: An event-related fMRI study. Human Brain Mapping. 2007a;28(4):263–274. doi: 10.1002/hbm.20319. [DOI] [PMC free article] [PubMed] [Google Scholar]
- Gur RE, Turetsky BI, Loughead J, Snyder W, Kohler C, Elliott M, et al. Visual attention circuitry in schizophrenia investigated with oddball event-related functional magnetic resonance imaging. American Journal of Psychiatry. 2007b;164(3):442–449. doi: 10.1176/ajp.2007.164.3.442. [DOI] [PubMed] [Google Scholar]
- Harris JG, Minassian A, Perry W. Stability of attention deficits in schizophrenia. Schizophrenia Research. 2007;91(1–3):107–111. doi: 10.1016/j.schres.2006.12.021. [DOI] [PubMed] [Google Scholar]
- Harrison BJ, Yucel M, Pujol J, Pantelis C. Task-induced deactivation of midline cortical regions in schizophrenia assessed with fMRI. Schizophrenia Research. 2007;91(1–3):82–86. doi: 10.1016/j.schres.2006.12.027. [DOI] [PubMed] [Google Scholar]
- Ho BC, Andreasen NC, Nopoulos P, Arndt S, Magnotta V, Flaum M. Progressive structural brain abnormalities and their relationship to clinical outcome: A longitudinal magnetic resonance imaging study early in schizophrenia. Archives of General Psychiatry. 2003;60(6):585–594. doi: 10.1001/archpsyc.60.6.585. [DOI] [PubMed] [Google Scholar]
- Jenkinson M, Smith S. A global optimisation method for robust affine registration of brain images. Medical Image Analysis. 2001;5(2):143–156. doi: 10.1016/s1361-8415(01)00036-6. [DOI] [PubMed] [Google Scholar]
- Jenkinson M, Bannister P, Brady M, Smith S. Improved optimization for the robust and accurate linear registration and motion correction of brain images. Neuroimage. 2002;17(2):825–841. doi: 10.1016/s1053-8119(02)91132-8. [DOI] [PubMed] [Google Scholar]
- Jensen J, Smith AJ, Willeit M, Crawley AP, Mikulis DJ, Vitcu I, et al. Separate brain regions code for salience vs. valence during reward prediction in humans. Human Brain Mapping. 2007;28(4):294–302. doi: 10.1002/hbm.20274. [DOI] [PMC free article] [PubMed] [Google Scholar]
- Jezzard P, Balaban RS. Correction for geometric distortion in echo planar images from b0 field variations. Magnetic Resonance in Med. 1995;34(1):65–73. doi: 10.1002/mrm.1910340111. [DOI] [PubMed] [Google Scholar]
- Juckel G, Schlagenhauf F, Koslowski M, Wustenberg T, Villringer A, Knutson B, et al. Dysfunction of ventral striatal reward prediction in schizophrenia. Neuroimage. 2006a;29(2):409–416. doi: 10.1016/j.neuroimage.2005.07.051. [DOI] [PubMed] [Google Scholar]
- Juckel G, Schlagenhauf F, Koslowski M, Filonov D, Wustenberg T, Villringer A, et al. Dysfunction of ventral striatal reward prediction in schizophrenic patients treated with typical, not atypical, neuroleptics. Psychopharmacology (Berlin) 2006b;187(2):222–228. doi: 10.1007/s00213-006-0405-4. [DOI] [PubMed] [Google Scholar]
- Katayama J, Polich J. Auditory and visual P300 topography from a 3 stimulus paradigm. Clinical Neurophysiology. 1999;110(3):463–468. doi: 10.1016/s1388-2457(98)00035-2. [DOI] [PubMed] [Google Scholar]
- Kapur S. Psychosis as a state of aberrant salience: A framework linking biology, phenomenology, and pharmacology in schizophrenia. American Journal of Psychiatry. 2003;160(1):13–23. doi: 10.1176/appi.ajp.160.1.13. [DOI] [PubMed] [Google Scholar]
- Keedwell PA, Andrew C, Williams SC, Brammer MJ, Phillips ML. The neural correlates of anhedonia in major depressive disorder. Biological Psychiatry. 2005;58(11):843–853. doi: 10.1016/j.biopsych.2005.05.019. [DOI] [PubMed] [Google Scholar]
- Kiehl KA, Liddle PF. An event-related functional magnetic resonance imaging study of an auditory oddball task in schizophrenia. Schizophrenia Research. 2001;48(2–3):159–171. doi: 10.1016/s0920-9964(00)00117-1. [DOI] [PubMed] [Google Scholar]
- Kiehl KA, Laurens KR, Duty TL, Forster BB, Liddle PF. Neural sources involved in auditory target detection and novelty processing: An event-related fMRI study. Psychophysiology. 2001;38(1):133–142. [PubMed] [Google Scholar]
- Kiehl KA, Stevens MC, Celone K, Kurtz M, Krystal JH. Abnormal hemodynamics in schizophrenia during an auditory oddball task. Biological Psychiatry. 2005a;57(9):1029–1040. doi: 10.1016/j.biopsych.2005.01.035. [DOI] [PMC free article] [PubMed] [Google Scholar]
- Kiehl KA, Stevens MC, Laurens KR, Pearlson G, Calhoun VD, Liddle PF. An adaptive reflexive processing model of neurocognitive function: Supporting evidence from a large scale (n = 100) fMRI study of an auditory oddball task. Neuroimage. 2005b;25(3):899–915. doi: 10.1016/j.neuroimage.2004.12.035. [DOI] [PubMed] [Google Scholar]
- Kuroki N, Shenton ME, Salisbury DF, Hirayasu Y, Onitsuka T, Ersner-Hershfield H, et al. Middle and inferior temporal gyrus gray matter volume abnormalities in first-episode schizophrenia: An MRI study. American Journal of Psychiatry. 2006;163(12):2103–2110. doi: 10.1176/appi.ajp.163.12.2103. [DOI] [PMC free article] [PubMed] [Google Scholar]
- Laruelle M, Abi-Dargham A. Dopamine as the wind of the psychotic fire: New evidence from brain imaging studies. Journal of Psychopharmacology. 1999;13(4):358–371. doi: 10.1177/026988119901300405. [DOI] [PubMed] [Google Scholar]
- Laurens KR, Kiehl KA, Ngan ET, Liddle PF. Attention orienting dysfunction during salient novel stimulus processing in schizophrenia. Schizophrenia Research. 2005;75(2–3):159–171. doi: 10.1016/j.schres.2004.12.010. [DOI] [PubMed] [Google Scholar]
- Laurienti PJ, Burdette JH, Wallace MT, Yen YF, Field AS, Stein BE. Deactivation of sensory-specific cortex by cross-modal stimuli. Journal of Cognitive Neuroscience. 2002;14(3):420–429. doi: 10.1162/089892902317361930. [DOI] [PubMed] [Google Scholar]
- Liddle PF, Friston KJ, Frith CD, Hirsch SR, Jones T, Frackowiak RS. Patterns of cerebral blood flow in schizophrenia. British Journal of Psychiatry. 1992;160:179–186. doi: 10.1192/bjp.160.2.179. [DOI] [PubMed] [Google Scholar]
- Liddle PF, Laurens KR, Kiehl KA, Ngan ET. Abnormal function of the brain system supporting motivated attention in medicated patients with schizophrenia: An fMRI study. Psychological Medicine. 2006;36(8):1097–1108. doi: 10.1017/S0033291706007677. [DOI] [PubMed] [Google Scholar]
- Linden DE, Prvulovic D, Formisano E, Vollinger M, Zanella FE, Goebel R, et al. The functional neuroanatomy of target detection: An fMRI study of visual and auditory oddball tasks. Cerebral Cortex. 1999;9(8):815–823. doi: 10.1093/cercor/9.8.815. [DOI] [PubMed] [Google Scholar]
- Lisman JE, Grace AA. The hippocampal-VTA loop: Controlling the entry of information into long-term memory. Neuron. 2005;46(5):703–713. doi: 10.1016/j.neuron.2005.05.002. [DOI] [PubMed] [Google Scholar]
- Mahurin RK, Velligan DI, Miller AL. Executive-frontal lobe cognitive dysfunction in schizophrenia: A symptom subtype analysis. Psychiatry Research. 1998;79(2):139–149. doi: 10.1016/s0165-1781(98)00031-6. [DOI] [PubMed] [Google Scholar]
- Mason MF, Norton MI, Van Horn JD, Wegner DM, Grafton ST, Macrae CN. Wandering minds: The default network and stimulus-independent thought. Science. 2007;315(5810):393–395. doi: 10.1126/science.1131295. [DOI] [PMC free article] [PubMed] [Google Scholar]
- Mathalon DH, Ford JM, Pfefferbaum A. Trait and state aspects of P300 amplitude reduction in schizophrenia: A retrospective longitudinal study. Biological Psychiatry. 2000;47(5):434–449. doi: 10.1016/s0006-3223(99)00277-2. [DOI] [PubMed] [Google Scholar]
- Mathalon DH, Heinks T, Ford JM. Selective attention in schizophrenia: Sparing and loss of executive control. American Journal of Psychiatry. 2004;161(5):872–881. doi: 10.1176/appi.ajp.161.5.872. [DOI] [PubMed] [Google Scholar]
- McCarthy G, Luby M, Gore J, Goldman-Rakic P. Infrequent events transiently activate human prefrontal and parietal cortex as measured by functional MRI. Journal of Neurophysiology. 1997;77(3):1630–1634. doi: 10.1152/jn.1997.77.3.1630. [DOI] [PubMed] [Google Scholar]
- McClure MM, Bowie CR, Patterson TL, Heaton RK, Weaver C, Anderson H, et al. Correlations of functional capacity and neuropsychological performance in older patients with schizophrenia: Evidence for specificity of relationships? Schizophrenia Research. 2007;89(1–3):330–338. doi: 10.1016/j.schres.2006.07.024. [DOI] [PubMed] [Google Scholar]
- Menon V, Ford JM, Lim KO, Glover GH, Pfefferbaum A. Combined event-related fMRI and EEG evidence for temporal-parietal cortex activation during target detection. Neuroreport. 1997;8(14):3029–3037. doi: 10.1097/00001756-199709290-00007. [DOI] [PubMed] [Google Scholar]
- Menon V, Adleman NE, White CD, Glover GH, Reiss AL. Error-related brain activation during a Go/NoGo response inhibition task. Human Brain Mapping. 2001;12(3):131–143. doi: 10.1002/1097-0193(200103)12:3<131::AID-HBM1010>3.0.CO;2-C. [DOI] [PMC free article] [PubMed] [Google Scholar]
- Menzies L, Ooi C, Kamath S, Suckling J, McKenna P, Fletcher P, et al. Effects of gamma-aminobutyric acid-modulating drugs on working memory and brain function in patients with schizophrenia. Archives of General Psychiatry. 2007;64(2):156–167. doi: 10.1001/archpsyc.64.2.156. [DOI] [PubMed] [Google Scholar]
- Muller-Gass A, Macdonald M, Schröger E, Sculthorpe L, Campbell K. Evidence for the auditory P3a reflecting an automatic process: Elicitation during highly-focused continuous visual attention. Brain Research. 2007;1170(1):71–78. doi: 10.1016/j.brainres.2007.07.023. [DOI] [PubMed] [Google Scholar]
- Morey RA, Inan S, Mitchell TV, Perkins DO, Lieberman JA, Belger A. Imaging frontostriatal function in ultra-high-risk, early, and chronic schizophrenia during executive processing. Archives of General Psychiatry. 2005;62(3):254–262. doi: 10.1001/archpsyc.62.3.254. [DOI] [PMC free article] [PubMed] [Google Scholar]
- Opitz B, Mecklinger A, Von Cramon DY, Kruggel F. Combining electrophysiological and hemodynamic measures of the auditory oddball. Psychophysiology. 1999a;36(1):142–147. doi: 10.1017/s0048577299980848. [DOI] [PubMed] [Google Scholar]
- Opitz B, Mecklinger A, Friederici AD, von Cramon DY. The functional neuroanatomy of novelty processing: Integrating ERP and fMRI results. Cerebral Cortex. 1999b;9(4):379–391. doi: 10.1093/cercor/9.4.379. [DOI] [PubMed] [Google Scholar]
- Pasley BN, Inglis BA, Freeman RD. Analysis of oxygen metabolism implies a neural origin for the negative bold response in human visual cortex. Neuroimage. 2007;36(2):269–276. doi: 10.1016/j.neuroimage.2006.09.015. [DOI] [PMC free article] [PubMed] [Google Scholar]
- Pfefferbaum A, Ford JM, White PM, Roth WT. P3 in schizophrenia is affected by stimulus modality, response requirements, medication status, and negative symptoms. Archives of General Psychiatry. 1989;46(11):1035–1044. doi: 10.1001/archpsyc.1989.01810110077011. [DOI] [PubMed] [Google Scholar]
- Plaze M, Bartres-Faz D, Martinot J, Januel D, Bellivier F, De Beaurepaire R, Chanraud S, Andoh J, Lefaucheur J, Artiges E, Pallier C, Paillere-Martinot M. Left superior temporal gyrus activation during sentence perception negatively correlates with auditory hallucination severity in schizophrenia patients. Schizophrenia Research. 2006;87:109–115. doi: 10.1016/j.schres.2006.05.005. [DOI] [PubMed] [Google Scholar]
- Polich J. Updating P300: an integrative theory of P3a and P3b. Clinical Neurophysiology. 2007;118(10):2128–2148. doi: 10.1016/j.clinph.2007.04.019. [DOI] [PMC free article] [PubMed] [Google Scholar]
- Prouteau A, Verdoux H, Briand C, Lesage A, Lalonde P, Nicole L, et al. The crucial role of sustained attention in community functioning in outpatients with schizophrenia. Psychiatry Research. 2004;129(2):171–177. doi: 10.1016/j.psychres.2004.07.005. [DOI] [PubMed] [Google Scholar]
- Raichle ME, MacLeod AM, Snyder AZ, Powers WJ, Gusnard DA, Shulman GL. A default mode of brain function. Proceedings of the National Academy of Sciences USA. 2001;98(2):676–682. doi: 10.1073/pnas.98.2.676. [DOI] [PMC free article] [PubMed] [Google Scholar]
- Roth RM, Koven NS, Pendergrass JC, Flashman LA, McAllister TW, Saykin AJ. Apathy and the processing of novelty in schizophrenia. Schizophrenia Research. 2008;98(1–3):232–238. doi: 10.1016/j.schres.2007.08.020. [DOI] [PMC free article] [PubMed] [Google Scholar]
- Sawaki R, Katayama J. Difficulty of discrimination modulates attentional capture for deviant information. Psychophysiology. 2007;44(3):374–382. doi: 10.1111/j.1469-8986.2007.00506.x. [DOI] [PubMed] [Google Scholar]
- Schlagenhauf F, Juckel G, Koslowski M, Kahnt T, Knutson B, Dembler T, Kienast T, Gallinat J, Wrase J, Heinz A. Reward system activation in schizophrenic patients switched from typical neuroleptics to olanzapine. Psychopharmacology. 2007 doi: 10.1007/s00213-007-1016-4. (Epub ahead of print; doi 10.1007/s00213-007-1016-4). [DOI] [PubMed] [Google Scholar]
- Shmuel A, Yacoub E, Pfeuffer J, Van de Moortele PF, Adriany G, Hu X, et al. Sustained negative BOLD, blood flow and oxygen consumption response and its coupling to the positive response in the human brain. Neuron. 2002;36(6):1195–1210. doi: 10.1016/s0896-6273(02)01061-9. [DOI] [PubMed] [Google Scholar]
- Silver H, Feldman P. Evidence for sustained attention and working memory in schizophrenia sharing a common mechanism. Journal of Neuropsychiatry and Clinical Neurosciences. 2005;17(3):391–398. doi: 10.1176/jnp.17.3.391. [DOI] [PubMed] [Google Scholar]
- Simpson JR, Jr, Drevets WC, Snyder AZ, Gusnard DA, Raichle ME. Emotion-induced changes in human medial prefrontal cortex: II. During anticipatory anxiety. Proceedings of the National Academy of Sciences USA. 2001;98(2):688–693. doi: 10.1073/pnas.98.2.688. [DOI] [PMC free article] [PubMed] [Google Scholar]
- Smith SM. Fast robust automated brain extraction. Human Brain Mapping. 2002;17(3):143–155. doi: 10.1002/hbm.10062. [DOI] [PMC free article] [PubMed] [Google Scholar]
- Squires NK, Squires KC, Hillyard SA. Two varieties of long-latency positive waves evoked by unpredictable auditory stimuli in man. Electroencephalography and Clinical Neurophysiology. 1975;38(4):387–401. doi: 10.1016/0013-4694(75)90263-1. [DOI] [PubMed] [Google Scholar]
- Stevens AA, Skudlarski P, Gatenby JC, Gore JC. Event-related fMRI of auditory and visual oddball tasks. Magnetic Resonance Imaging. 2000;18(5):495–502. doi: 10.1016/s0730-725x(00)00128-4. [DOI] [PubMed] [Google Scholar]
- Taylor SF, Phan KL, Britton JC, Liberzon I. Neural response to emotional salience in schizophrenia. Neuropsychopharmacology. 2005;30(5):984–995. doi: 10.1038/sj.npp.1300679. [DOI] [PubMed] [Google Scholar]
- Turetsky BI, Colbath EA, Gur RE. P300 subcomponent abnormalities in schizophrenia: I. Physiological evidence for gender and subtype specific differences in regional pathology. Bioogical Psychiatry. 1998a;43(2):84–96. doi: 10.1016/S0006-3223(97)00258-8. [DOI] [PubMed] [Google Scholar]
- Turetsky BI, Colbath EA, Gur RE. P300 subcomponent abnormalities in schizophrenia: II. Longitudinal stability and relationship to symptom change. Bioogical Psychiatry. 1998b;43(1):31–39. doi: 10.1016/s0006-3223(97)00261-8. [DOI] [PubMed] [Google Scholar]
- Tzourio-Mazoyer N, Landeau B, Papathanassiou D, Crivello F, Etard O, Delcroix N, et al. Automated anatomical labeling of activations in SPM using a macroscopic anatomical parcellation of the MNI MRI single-subject brain. Neuroimage. 2002;15(1):273–289. doi: 10.1006/nimg.2001.0978. [DOI] [PubMed] [Google Scholar]
- Woolrich MW, Ripley BD, Brady M, Smith SM. Temporal autocorrelation in univariate linear modeling of fMRI data. Neuroimage. 2001;14(6):1370–1386. doi: 10.1006/nimg.2001.0931. [DOI] [PubMed] [Google Scholar]
- Woolrich MW, Behrens TE, Beckmann CF, Jenkinson M, Smith SM. Multilevel linear modelling for fMRI group analysis using Bayesian inference. Neuroimage. 2004;21(4):1732–1747. doi: 10.1016/j.neuroimage.2003.12.023. [DOI] [PubMed] [Google Scholar]
- Zink CF, Pagnoni G, Martin ME, Dhamala M, Berns GS. Human striatal response to salient nonrewarding stimuli. Journal of Neuroscience. 2003;23(22):8092–8097. doi: 10.1523/JNEUROSCI.23-22-08092.2003. [DOI] [PMC free article] [PubMed] [Google Scholar]
- Zink CF, Pagnoni G, Chappelow J, Martin-Skurski M, Berns GS. Human striatal activation reflects degree of stimulus saliency. Neuroimage. 2006;29(3):977–983. doi: 10.1016/j.neuroimage.2005.08.006. [DOI] [PMC free article] [PubMed] [Google Scholar]