

Abstract
Frontal alpha asymmetry is typically computed using alpha power averaged across many overlapping epochs. Previous reports have estimated the internal consistency reliability of asymmetry by dividing resting EEG sessions into segments of equal duration (e.g. 1 min) and treating asymmetry scores for each segment as “items” to estimate internal consistency reliability using Cronbach's alpha. Cronbach's alpha partly depends on the number of items, such that this approach may underestimate reliability by using less than the number of distinct items available. Reliability estimates for resting EEG data in the present study (204 subjects, 8 sessions) were obtained using mean split-half correlations with epoch alpha power as treated as separate items. Estimates at all scalp sites and reference schemes approached 0.90 with as few as 100 epochs, suggesting the internal consistency of frontal asymmetry is greater than that previously reported.
Keywords: Frontal Electroencephalographic Asymmetry, EEG, Reliability
Anterior electroencephalographic (EEG) alpha asymmetry, that is the difference in EEG-band alpha power between the right and left anterior scalp electrodes, is purported to measure the relative inter-hemispheric difference in activity of frontal cortex (Davidson, 1988). Frontal alpha asymmetry measured during rest has been associated with a number of traitlike qualities in both pathological conditions as well as non-pathological individual differences related to affect (Coan & Allen, 2004). With respect to psychopathology, most studies have focused on depression, in which both depressed (Allen, Iacono, Depue, & Arbisi, 1993; Gotlib, Ranganath, & Rosenfeld, 1998; Henriques & Davidson, 1991; Schaffer, Davidson, & Saron, 1983) and asymptomatic individuals with a history of depression (Allen et al., 1993; Gotlib et al., 1998; Henriques & Davidson, 1990) show asymmetry scores associated with a bias towards greater right anterior cortical activity (although not in all cases, e.g. Reid, Duke, & Allen, 1998). Such findings suggest that resting frontal alpha asymmetry may to some extent measure one or more traits associated with a risk of depression, and may serve as a psychophysiological marker of mechanisms that create risk for depression, although similar findings in anxiety disorders (Davidson, Marshall, Tomarken, & Henriques, 2000; (Heller & Nitschke, 1998; Wiedemann et al., 1999) raise the possibility that it may be a more general indicator of risk for emotional dysregulation in psychopathology.
Frontal alpha asymmetry has also been associated with normal-range individual differences in motivation and affect, although any traits that the asymmetry metric may measure in such studies might largely overlap with those that increase the risk of depression and anxiety. Davidson (1993, 1998) has proposed a model in which asymmetry scores correspond to individual differences in approach and withdrawal tendencies (for review, see Coan & Allen, 2003a). In this model, asymmetry scores reflecting a relatively greater left frontal activity correspond to trait tendencies to approach positive affective stimuli more intensely. Conversely, asymmetry scores reflecting relatively greater right frontal activity correspond to trait tendencies towards more intense withdraw from negative affective stimuli. Trait approach and withdrawal models of emotion overlap somewhat with Gray's behavioral activation and inhibition systems model (BAS/BIS, Gray, 1972, 1987, 1990), in which high trait behavioral activation is associated with greater tendency to seek out both positive and negative reinforcement, as well as generally greater positive affect. In contrast, trait behavioral inactivation is associated with behavioral inhibition and generally greater negative affect. Several studies have shown a correspondence between BAS asymmetry scores reflecting relatively greater left frontal activity (Coan & Allen, 2003; Harmon-Jones & Allen, 1997; Sutton & Davidson, 1997), however, it is not clear that there is a direct relationship between relatively greater right frontal activity and BIS (Coan & Allen, 2003).
Frontal EEG alpha asymmetry also appears to be a marker for state changes in emotion. In general, spontaneous or induced emotional states associated with approach or positive affect are associated with greater left frontal activity, whereas emotional states associated with withdrawal or negative affect are associated with greater right frontal activity As is the case with trait-level models, changes in alpha asymmetry across states are taken as indicators of the proposed shift towards greater activity in one hemisphere. (see Coan & Allen, 2003a). Such state-dependent changes in asymmetry have been found in a number of studies, including spontaneous and voluntary facial experessions (Coan, Allen, & Harmon-Jones, 2001; Davidson, Ekman, Saron, Senulis, & Friesen, 1990; Ekman & Davidson, 1993; Ekman, Davidson, & Friesen, 1990; Fox & Davidson, 1988), exposure to emotional films (Jones & Fox, 1992; Tomarken, Davidson, & Henriques, 1990), and response to pleasant and aversive flavors in infants (Fox & Davidson, 1986). It should also be noted frontal alpha asymmetry may reflect an interaction between trait- and state-level variables, in addition to independent contributions from each (Hagemann, Hewig, Seifert, Naumann, & Bartussek, 2005; Hagemann, Thayer, Naumann, & Bartussek, 2002; Steyer, Ferring, & Schmitt, 1992; see Coan & Allen, 2003a for discussion).
The extent to which resting frontal alpha asymmetry is a valid indicator of traits associated with both psychopathology and overall affective style depends on both the stability and reliability of the asymmetry metric. Stability is less important in establishing the validity of asymmetry as an indicator of state changes, although changes in asymmetry scores due to state manipulation should be consistent across occasions of measurement. However, good internal consistency reliability of frontal alpha asymmetry is necessary for establishing the validity of frontal alpha asymmetry for assessing both state fluctuations and trait individual differences. This requirement is more obvious in the case of traits, as poor internal consistency reliability may be due to the asymmetry score not measuring stable traits, being mostly dictated by state fluctuations in addition to trait levels, or measuring a trait with little variability across individuals. In cases where asymmetry scores are used as a measure of state-level variables, poor internal consistency of asymmetry scores may reflect a lack of control for non-experimental factors. In both cases, it is necessary to establish that the frontal alpha asymmetry score is a reliable metric. The reliability of frontal alpha asymmetry can also dictate pragmatic considerations, as is the case when deciding how much EEG data to record to achieve a minimum acceptable reliability.
Estimating Internal Consistency Reliability
Most of the studies examining resting frontal EEG asymmetry use the procedure first described by Tomarken, Davidson, Wheeler, & Kinney (1992) in their assessment of the stability and internal consistency reliability of the asymmetry metric. In that study, EEG power in the alpha band was collected across 8 one-minute recordings. Internal consistency reliability was estimated using Cronbach's alpha, in which asymmetry scores for each minute were treated as items. The authors also used the Spearman-Brown prophecy formula to estimate the value of alpha associated with using a smaller number of minutes (5, 6 and 7 minutes). Estimated reliability coefficients of asymmetry scores met or exceeded their minimum criteria (0.7 – 0.75 range) across frontal regions and the various number of minutes, leading Tomarken et al. (1992) to conclude that as few as 5 minutes of EEG recording will achieve acceptable internal consistency reliability.
Allen, Urry, Hitt, & Coan (2004) noted that use of the Spearman-Brown prophecy formula was not the best way to estimate internal consistency reliability associated with different recording lengths, as that formula (as well as the original estimate based on Cronbach's alpha) is partially dependent on the number of items in a measure. In the Allen, Urry et al. (2004) study, initial estimates of the internal consistency reliability of asymmetry scores were obtained using the method of Tomarken et al. (1992), i.e. calculating Cronbach's alpha for 8 one-minute resting periods. In order to estimate the internal consistency reliability associated with fewer than 8 minutes of EEG data, each minute of data was then divided into smaller segments. In this way, the number of “items” was held constant at eight, but the total length of time ranged from two to eight minutes. In addition, Cronbach's alpha was calculated using fewer than eight blocks for each of the block durations. In general, alphas were fairly constant across recording lengths ranging from two to eight minutes, but tended to decrease when any given recording length was divided into fewer blocks. These results led Allen, Urry et al. (2004) to conclude that any estimates of internal consistency reliability as a function of recording length must take into account the number of blocks used in the estimate, and that a division resulting in fewer than four blocks will likely underestimate internal consistency reliability when using Cronbach's alpha.
Although the methods used to calculate Cronbach's alpha in both of these studies resulted in generally high coefficients (i.e. greater than .70, with a few exceptions in Allen, Urry et al., 2004), the division of the EEG record into fairly lengthy segments of equal duration (e.g., 1 min) is somewhat arbitrary: up to a point, the number of items can be increased simply by reducing the length of each segment. In both the Tomarken et al. (1992) and Allen, Urry et al. (2004) studies, the asymmetry scores associated with each segment were computed using the average of alpha power across all artifact-free epochs within the segment, in effect computing the average Short-Term Fourier Transform (STFT) for each segment. The STFT is generally employed as a method of assessing changes in spectral density of a signal across time by dividing successive portions of the time-domain signal into epochs, such that the spectral density of each epoch can be estimated by using the Fast Fourier Transform (FFT). In the case of frontal alpha asymmetry, the time-varying information of the STFT is disregarded, as the measure of interest is the average power in the alpha band across EEG record. Regardless of the duration of the EEG data being assessed, the basic unit of measurement in the STFT (and therefore in the estimate of EEG alpha-band power) is the spectral density of the individual epoch, rather than any aggregate score derived from a pre-defined set of epochs.
The individual epochs used for calculating asymmetry scores may be thought of as individual items on a multi-item scale assessing asymmetry for a given EEG dataset and a homologous pair within that dataset. In the context of the Tomarken et al. (1992) and Allen, Urry et al. (2004) studies, STFT epochs would represent the smallest possible segment length. If every dataset were identical with respect to number and timing of each epoch, internal consistency reliability could ostensibly be estimated by treating each epoch as an item on a scale and computing Cronbach's alpha (where the overall score for the scale corresponds to mean alpha power). Both epochs and fixed-duration segments involve some departure from the standard use off Cronbach's alpha, in that what constitutes an item will vary in some way across participants. For example, if the first epoch of every resting set is considered one item, counterbalancing will result in that epoch being drawn from the eyes-open condition in one half of the participants, and from the eyes-closed condition in the other. Similarly, when items consist of averages over minutes, the criteria for any individual item may be the nth minute overall or the nth eyes-open and –closed minutes, but not both (e.g. the first eyes-open minute will be the first minute f recording for only half of the participants). Additionally, the presence of artifacts results in datasets that differ across participants with respect to which portions are usable. As such, the individual epochs cannot be treated as fixed items for each EEG dataset, as many epochs will not be available for all participants.
Internal consistency reliability can also be estimated by Spearman-Brown corrected split-half correlations, i.e. by separating epochs into two halves, calculating an asymmetry score for each half, and calculating the Pearson product moment correlation between the two resulting sets of asymmetry scores. The Spearman-Brown prophecy formula is used to correct the resulting estimate, as the uncorrected split-half correlation is an estimate of the reliability of a measure with half as many items as the original. Cronbach's alpha for all items is equivalent to the average of the Spearman-Brown-correct correlation coefficients obtained from all possible split-halves, in the case where test items are parallel (i.e. measure the same true-score, with each item having equal error variances, Lord & Novick, 19681). In practice, it would be impossible to evaluate all possible split-half combinations for even a small number of epochs and records2. Additionally, the individual epochs will likely differ with respect to how they measure the reliable component of asymmetry (e.g. eyes-open and –closed minutes may involve different error variances), in which case the average of the Spearman-Brown corrected split-half correlation coefficients will underestimate Cronbach's alpha. Nonetheless, assuming one can sample a representative subset of split-half reliabilities, the average of the resulting Spearman-Brown corrected split-half correlations should approximate Cronbach's alpha (in the ideal case where the latter could in fact be used). In the present study, estimates of internal consistency reliability were obtained by averaging the Spearman-Brown-corrected split-half correlation coefficients across 1000 randomly selected split-half combinations of epochs. To provide estimates of the internal consistency reliability of EEG asymmetry for data sets of varying lengths, this procedure was conducted separately for 20 different sets of epochs ranging in number from 20 to 400, in steps of 20.
Method
Participants
Participants were undergraduates recruited for an ongoing study on the relationship between frontal EEG alpha asymmetry and risk for depression, for which they received monetary compensation. Of the 204 participants reported (149 female), 39 met criteria for current Major Depressive Disorder (MDD), and 88 met criteria for at least one past episode of MDD. The Beck Depression Inventory was administered to each participant, with scores ranging from 0 to 39 (mean = 15.5, median = 17). Participants were drawn from a pool of candidates by oversampling, such that the distribution of BDI scores was roughly rectangular across the sample. All participants were strongly right-handed (indicated by a score of 35 or more out of 39 point scale of Chapman & Chapman, 1987). Participants were excluded from the study if any of the following were present at the time of the experiment: co-morbid Axis-I disorder other than Major Depressive Disorder or Dysthymia, serious uncontrolled medical condition, or if the potential for suicide was sufficiently high to warrant immediate treatment. Additionally, participants were excluded if there was a history of any of the following: use of mood-stabilizing medications, head trauma, loss of consciousness, epilepsy, electro-shock treatments, or substance abuse or dependence within the last 4 months.
Procedure
EEG data were recorded on four separate occasions, all within a two week time period. Each session consisted of two 8-minute resting periods, separated by a 4-minute task designed to examine state-dependent changes in frontal alpha asymmetry (Directed Facial Action task, see Coan & Allen, 2003b; Coan et al., 2001). Only data from the resting periods is reported here. Resting periods consisted of 8 one-minute segments of rest, alternating between eyes-open (O) and –closed (C) (ordered COOCOCCO or OCCOCOOC). In this way, eight separate resting periods of EEG were collected from each participant (four sessions, two periods per session), resulting in 1632 separate records. Twenty-nine of these records were removed from further analyses due to excessive artifacts or critical leads that went bad (e.g. mastoids), with the remaining records treated as separate observations for the purpose of estimating reliability.
Participants were fitted with a stretch-lycra cap with sintered Ag/AgCl electrodes. Additional electrodes were placed on the face superior and inferior to the left pupil, and on the outer canthus of each eye, to record vertical and horizontal electrooculographic signals (VEOG and HEOG), and on the upper chest to record the electrocardiographic (ECG) signal (which will not be reported here). Scalp EEG was recorded from 64 channels arranged according to an extended International 10-20 system (FP1, FP2, FPz, AF3, AF4, Fz, F1, F2, F3, F4, F5, F6, F7, F8, FCz, FC1, FC2, FC3, FC4, FC5, FC6, FT7, FT8, Cz, C1, C2, C3, C4, C5, C6, T7, T8, CPz, CP1, CP2, CP3, CP4, CP5, CP6, TP7, TP8, Pz, P1, P2, P3, P4, P5, P6, P7, P8, POz, PO1, PO2, PO3, PO4, PO5, PO6, PO7, PO8, O1, O2, Oz, CB1, CB2) in addition to left and right mastoids (A1 and A2). Impedances at all sites were required to be less than 10kΩ, a choice influenced by the 1 Gigaohm input impedance on the amplifier (Neuroscan, El Paso TX). Scalp and mastoid sites were referenced to an additional electrode (located midway between Cz and CPz); EOG and ECG recording used bipolar pairs (medial vs. lateral horizontal EOG, and superior vs. inferior vertical EOG). All signals were low-passed filtered online at 200Hz (-12dB/octave rolloff), and digitized at 1000Hz. For the resting data reported here, participants were seated alone in a quiet, low-illumination room, and given standardized instructions via intercom.
Data reduction
Each record was visually inspected to remove artifacts. A computer-based algorithm was used to remove blink (and other ocular) artifacts, such that individual epochs in which the VEOG potential deviated more than 75μV from the epoch mean were rejected. In addition to the online reference (O), each record was re-referenced offline to computer-averaged linked-mastoids (L) and average (A) references. Each 1-minute block of EEG data (out of the 8-minute period) was divided into 119 2.048s epochs, overlapping by 1.5s. Epochs which overlapped manually rejected segments of the data or in which the ocular rejection threshold was crossed were omitted from further analyses. Each epoch was baseline corrected and weighted with a 2048-point Hamming window (50% taper), and a fast Fourier transform (FFT) was applied to estimate power in the alpha band (between 7.8 and 13.7 Hz).
Estimation of Internal Consistency Reliability
Internal consistency reliability estimates via Spearman-Brown-corrected split-half correlation coefficients (SB-SH reliability estimates) were obtained for 20 through 400 epochs, in steps of 20 (i.e. 20, 40, 60, etc.). For each set of epochs, asymmetry scores were calculated for 27 homologous pairs (FP2-FP1, AF4-AF3, F2-F1, F4-F3, F6-F5, F8-F7, FC2-FC1, FC3, FC4-FC3, FC6-FC5, FT8-FT7, C2-C1, C4-C3, C6-C5, T8-T7, CP2-CP1, CP4-CP3, CP6-CP5, TP8-TP7, P2-P1, P4-P3, P6-P5, P8-P7, PO2-PO1, PO4-PO3, PO6-PO5, PO8-PO7, O2-O1, CB2-CB1). It should be noted that as the number of epochs increased, the total number of available records (subjects and sessions) decreased, since many of the records had fewer than 400 useable epochs following artifact rejection.
For each set of epochs n, 1000 split-half correlation coefficients were calculated. On each iteration, from among all the available epochs in each record, n were randomly selected, and each selected epoch was randomly assigned to one of two sets (A and B). Average alpha power at each site was then calculated separately for each set, using only the epochs included in that set. The average alpha power for each set was then used to compute asymmetry scores for homologous pairs, as the difference in natural log-transformed average alpha power between the pair's right and left electrode. In this way, a separate asymmetry score was obtained for the two sets. The Pearson correlation coefficient r was calculated using the asymmetry scores from sets A and B across all the useable records (i.e. records that contained enough useable epochs for any given n). This procedure was repeated 1000 times, yielding 1000 correlation coefficients for a given set of n epochs.
The estimate of internal consistency reliability for any given set of epochs of size n was computed by applying the Fisher z-transform to each of the 1000 correlation coefficients, computing the average Fisher-z across all 1000 iterations, and converting the average Fisher‐z result back into a correlation coefficient (using the inverse of the z-transform). Since a split-half procedure was used, this average correlation would approximate the internal consistency reliability of asymmetry scores based on n / 2 epochs. For this reason, the Spearman-Brown prophecy formula was used to correct for double-length. This procedure was conducted for all sets of epochs (20 sets ranging from size 20 to 400 in steps of 20), and for each of the three reference schemes (A, O, and L).
Results
Figure 1 shows SB-SH reliability estimates for each homologous pair as a function of reference and epoch set size. Additionally, for each reference, markers indicate the number of epochs for which the SB-SH reliability estimate equals or exceeds 0.90 (the number of epochs at this point is also listed in the inset of each graph). Standard deviations of the SB-SH reliability estimates for each iteration were omitted from the graph, as in each case this value was very low (mean .028, median .024, range .019-.287, with the largest standard deviations at anterior pairs and 20 epochs). In all cases, SB-SH reliability estimates increases with the number of epochs, though this trend tends to asymptote around 200 epochs in most cases. Figure 2 shows the percentage of all sites that meet or exceed reliabilities of 0.70, 0.80, and 0.90 for each reference scheme, again as a function of epochs set size. As can be seen in both figures, SB-SH reliability estimates for all homologous pairs and reference schemes is greater than or equal to 0.90 at 160 epochs. SB-SH reliability estimates tended to be higher for more posterior pairs across all reference derivations (figure 3). Anterior pairs covering regions typically assessed in frontal alpha asymmetry showed consistently greater SB-SH reliability estimates for the linked-mastoids reference compared to the online and average references.
Figure 1.
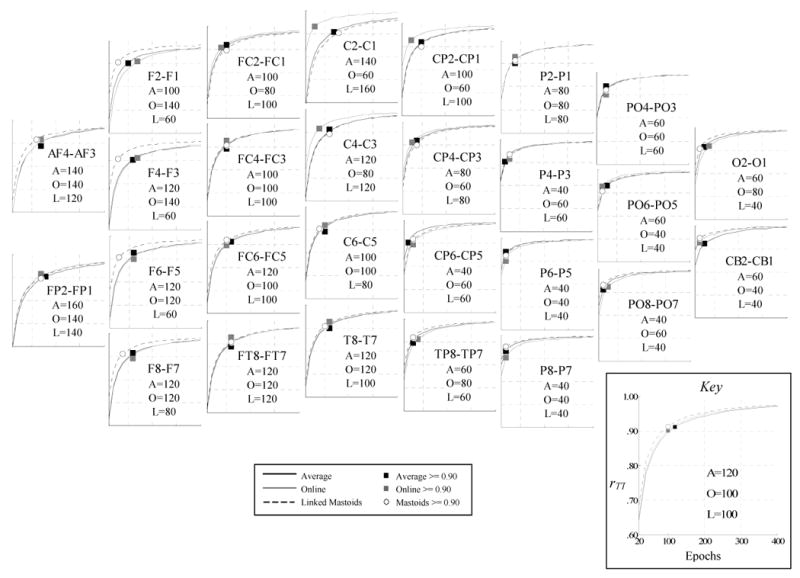
Estimated internal consistency reliability (rTT) of asymmetry scores for epoch set sizes n ranging from 20 to 400, across average (black), online (gray) and linked-mastoids (dashed) reference derivations and all homologous electrode pairs. Graph markers and table insets indicate the epoch set size n at which the estimated internal consistency reliability coefficient for each reference derivation was greater than or equal to 0.90.
Figure 2.
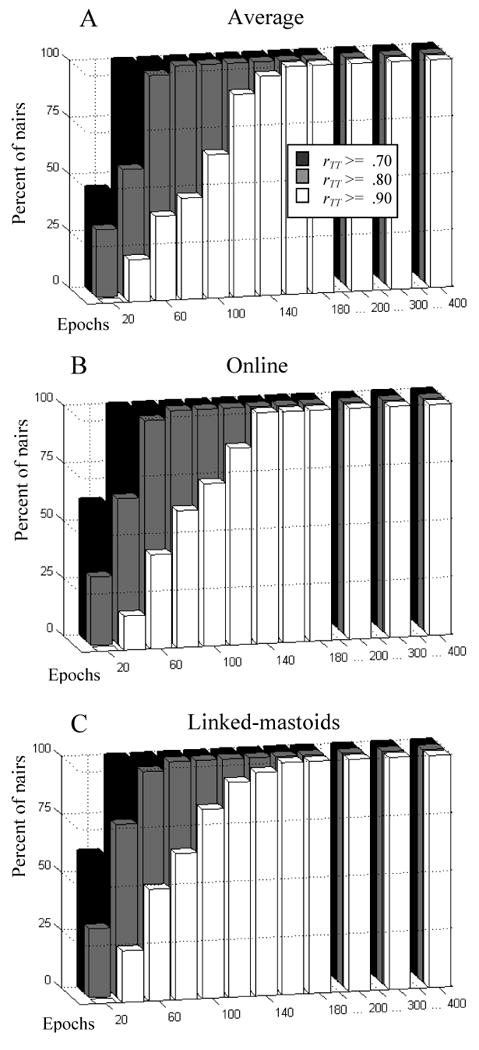
Percentage of homologous electrode pairs in which estimates of internal consistency reliability (rTT) of asymmetry scores were greater than or equal to 0.70 (white), 0.80 (light gray) and 0.90 (dark gray) as a function of epoch set size n and reference derivation.
Figure 3.
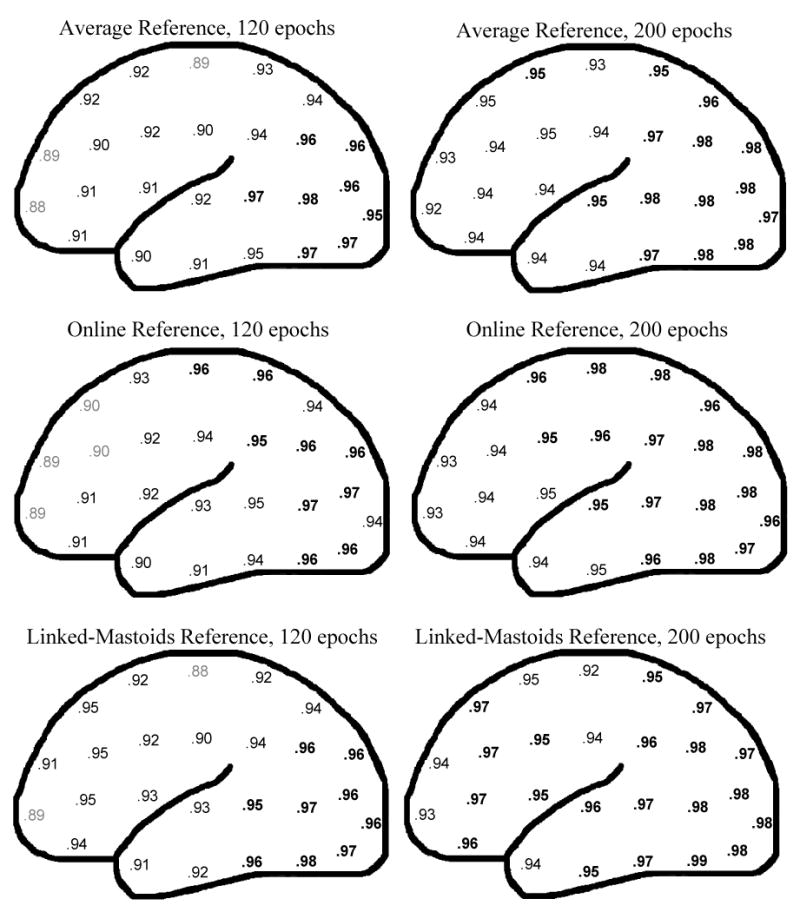
Estimated internal consistency reliability (rTT) of asymmetry scores for epoch set sizes of 120 and 200, with light gray numbers indicating .85 ≤ rTT < .90, and bold numbers indicating rTT ≥ .95 (the pair CB2-CB1 was omitted).
It is possible that the above procedure may overestimate the reliability of the asymmetry score due to the use of overlapping epochs. Epochs are overlapped to accommodate the impact of the Hamming window (Allen, Coan, & Nazarian, 2004), as only data in the center of each epoch are given maximal weighting in the FFT. Although the extent to which the overlap creates redundancy is attenuated by the Hamming window (see Allen et al., 2004, figure 1), the estimates of alpha power within each epoch are not strictly independent using the overlapping epoch approach. Moreover, given the sampling scheme detailed above, the effect of overlapping epochs should be further minimized, as adjacent epochs are not always selected on any given iteration. For the STFT employed in this study, each epoch can have a maximum of four other overlapping epochs; for the sampling procedure, each epoch is both randomly selected from all artifact-free epochs within the resting EEG data and randomly assigned to either set A or B. Thus, sampling will be unlikely to select adjacent epochs for the same split-half (A or B) with any frequency when set sizes are small. Nonetheless, the impact of the overlapping epochs was assessed by sampling from epoch sets with varying degrees of overlap.
SB-SH reliability estimates for these epoch sets were obtained with essentially the same procedure outlined above, with the following differences. Each minute of the 8-minute resting task was divided into 2.048s epochs, and epoch sets were created using every second, third, or fourth epoch thus obtained. The resulting sets contained epochs which could overlap other epochs in time by a maximum of 50%, 25% and 0%, respectively. Sampling epochs in this way dramatically reduces the number of useable epochs, limiting the comparison of SB-SH reliability estimates to a maximum epoch set size of 100. As with the previous analysis, epochs so selected were rejected if they overlapped with manually-screened artifacts or if the VEOG potential deviated more than 75μV from the epoch mean. Table 1 shows the resulting mean, minimum, and maximum of the SB-SH reliability estimates across all homologous pairs for an epoch set size of 100. Separate SB-SH reliability estimates were obtained for each of the three reference derivations, and the original epoch selection method (75% overlap) is included for comparison. Overall, there was little difference between SB-SH reliability estimates associated with varying degrees of epoch overlap, with the maximum difference being 0.03 between the 75% and 0% overlap cases (for pair F2-F1 in the average reference, and pair AF4-AF3 in the linked-mastoids reference), suggesting that the lack of complete independence between epochs may result in only a slight over-estimation of internal consistency reliability in a few cases
Table 1.
Mean, minimum, and maximum (across all homologous pairs) estimated Spearman-Brown corrected split-half correlations for 100 epochs sampled with 75%, 50%, 25% and approximately 0% overlap between successive epochs.
| Reference | Average | Online | Linked-Mastoids | |||||||||
|---|---|---|---|---|---|---|---|---|---|---|---|---|
| Epoch Overlap | 75% | 50% | 25% | 0% | 75% | 50% | 25% | 0% | 75% | 50% | 25% | 0% |
| Mean | 0.92 | 0.92 | 0.91 | 0.91 | 0.92 | 0.92 | 0.92 | 0.92 | 0.93 | 0.93 | 0.92 | 0.92 |
| Minimum | 0.86 | 0.85 | 0.84 | 0.84 | 0.87 | 0.87 | 0.86 | 0.87 | 0.86 | 0.85 | 0.85 | 0.85 |
| Maximum | 0.97 | 0.97 | 0.97 | 0.97 | 0.97 | 0.97 | 0.98 | 0.99 | 0.98 | 0.98 | 0.98 | 0.98 |
Note: In the approximately 0% overlap cases, only 48ms of time-domain data was shared between any two epochs, with the Hamming window weights for this interval ranging from 0.080 to 0.085.
The same procedure was also used to obtain SB-SH reliability estimates for eyes-open versus eyes-closed minutes. Additionally, since Hagemann & Naumann, (2001) found no difference in asymmetry as a function of the inclusion or removal of blinks, SB-SH reliability estimates were also derived for data where automated ocular artifact rejection was not used. Thus the set of epochs for this analysis included those with both blinks and as well as other ocular artifacts (e.g. eye movement of sufficient amplitude to exceed the 75μV rejection threshold normally employed), but not other artifacts. SB-SH reliability estimates were also derived for each combination of these factors (eyes-open / -closed, blink rejection / inclusion). As seen in Figure 4, the SB-SH reliability estimates were highly similar across the combinations of eyes open/closed and ocular rejection/inclusion epochs, with average of approximately 80 epochs necessary to obtain SB-SH reliability estimates that exceed 0.90.
Figure 4.

Mean, minimum (▲) and maximum (▼) epoch set sizes n in which estimates of internal consistency reliability of asymmetry scores exceeded 0.90 for all homologous electrodes. Each row represents epochs sampled according to resting minute type (all, eyes-closed only, and eyes-open only). The first column of graphs represent epochs remaining after ocular artifact rejection (removing epochs in which vertical EOG amplitude deviates more than 75μV from the epoch mean); the second column represents no ocular artifact rejection (though in both cases epochs overlapping manually rejected segments of the EEG data are omitted).
In order to compare the present procedure to previous estimates of internal consistency reliability (Tomarken et al. 1992, Allen, Urry et al., 2004), Cronbach's alpha values were calculated using eight one-minute segments (corresponding to the alternating eyes-open and –closed minutes). Asymmetry scores for each homologous pair and segment were calculated using all artifact-free epochs within that segment (records with fewer than 25 useable epochs in each minute were omitted). Table 2 shows alphas thus calculated along with SB-SH reliability estimates obtained for 200 epochs. Estimates using the latter procedure were consistently higher than the corresponding coefficient alphas, despite the latter typically utilizing more recorded EEG.
Table 2.
SB-SH internal consistency reliability estimates compared to Cronbach's alpha
| Average | Online | Linked-Mastoids | ||||
|---|---|---|---|---|---|---|
| α (8 items) |
Split-half (200 epochs) |
α (8 items) |
Split-half (200 epochs) |
α (8 items) |
Split-half (200 epochs) |
|
| FP2-FP1 | 0.87 | 0.92 | 0.91 | 0.93 | 0.89 | 0.93 |
| AF4-AF3 | 0.89 | 0.93 | 0.92 | 0.93 | 0.90 | 0.94 |
| F8-F7 | 0.92 | 0.94 | 0.93 | 0.94 | 0.95 | 0.96 |
| F6-F5 | 0.92 | 0.94 | 0.92 | 0.94 | 0.95 | 0.97 |
| F4-F3 | 0.90 | 0.94 | 0.92 | 0.94 | 0.95 | 0.97 |
| F2-F1 | 0.92 | 0.95 | 0.89 | 0.94 | 0.96 | 0.97 |
| FT8-FT7 | 0.89 | 0.94 | 0.92 | 0.94 | 0.90 | 0.94 |
| FC6-FC5 | 0.90 | 0.94 | 0.93 | 0.95 | 0.93 | 0.95 |
| FC4-FC3 | 0.91 | 0.95 | 0.93 | 0.95 | 0.92 | 0.95 |
| FC2-FC1 | 0.92 | 0.95 | 0.94 | 0.96 | 0.92 | 0.95 |
| T8-T7 | 0.90 | 0.94 | 0.92 | 0.95 | 0.92 | 0.95 |
| C6-C5 | 0.92 | 0.95 | 0.94 | 0.95 | 0.94 | 0.96 |
| C4-C3 | 0.90 | 0.94 | 0.94 | 0.96 | 0.91 | 0.94 |
| C2-C1 | 0.89 | 0.93 | 0.96 | 0.98 | 0.87 | 0.92 |
| TP8-TP7 | 0.93 | 0.97 | 0.92 | 0.96 | 0.95 | 0.97 |
| CP6-CP5 | 0.95 | 0.98 | 0.94 | 0.97 | 0.94 | 0.97 |
| CP4-CP3 | 0.93 | 0.97 | 0.94 | 0.97 | 0.93 | 0.96 |
| CP2-CP1 | 0.92 | 0.95 | 0.96 | 0.98 | 0.91 | 0.95 |
| P8-P7 | 0.96 | 0.98 | 0.95 | 0.98 | 0.97 | 0.99 |
| P6-P5 | 0.96 | 0.98 | 0.95 | 0.98 | 0.96 | 0.98 |
| P4-P3 | 0.94 | 0.98 | 0.94 | 0.98 | 0.95 | 0.98 |
| P2-P1 | 0.93 | 0.96 | 0.93 | 0.96 | 0.93 | 0.97 |
| PO8-PO7 | 0.94 | 0.98 | 0.93 | 0.97 | 0.96 | 0.98 |
| PO6-PO5 | 0.93 | 0.98 | 0.92 | 0.98 | 0.93 | 0.98 |
| PO4-PO3 | 0.93 | 0.98 | 0.92 | 0.98 | 0.93 | 0.97 |
| CB2-CB1 | 0.95 | 0.98 | 0.99 | 0.98 | 0.97 | 0.99 |
| O2-O1 | 0.90 | 0.97 | 0.89 | 0.96 | 0.92 | 0.98 |
Note: Cronbach's alpha values were calculated using asymmetry scores derived from eight one-minute segments (alternating eyes-open and –closed). The Spearman-Brown-corrected mean split-half correlations are identical to those shown in figure 1 for 200 epochs.
Discussion
Acceptable length
Previous methods for estimating the internal consistency reliability of EEG asymmetry have depended upon calculating Cronbach's alpha for an arbitrary number of segments of arbitrary length (treating the alpha asymmetry scores for these segments as “items”). In contrast, the present study treated the individual epochs as items, estimating internal consistency reliability across a number of epoch set sizes. Overall, these estimates of internal consistency reliability are higher than those previously reported when comparing equivalent lengths of the EEG record. Additionally, at 200 epochs, these estimates were also consistently higher than the Cronbach's alphas based on more total EEG data, calculated in the same way as previous studies (i.e. dividing the EEG data into eight one-minute items). These findings are consistent with the fact that estimates of reliability increase as the number of items in a scale increases, assuming that the added items are equally good at measuring the variable of interest.
SB-SH estimates from the present study indicate that good reliability (e.g. >0.90) can be obtained for all homologous pairs and reference derivations at approximately 160 epochs. This translates to approximately 80 seconds, or about 16% of the total recording time of 8 minutes. Thus the measurement of resting frontal alpha asymmetry may require far less recording time than the standard 8 minutes (though likely more than 80 seconds, see below). Moreover, these estimates may be used to establish a minimum criterion for a number of accepted epochs; e.g. removing those subjects' sessions in which the number of epochs remaining after artifact rejection falls below the number of epochs associated with a chosen reliability desideratum. In establishing such a criterion, one should note that the estimates obtained in the present study differed with both the location of the homologous pair and the reference derivation. For example, the minimum acceptable recording length may be less in frontal alpha asymmetry studies utilizing only the linked-mastoids reference compared to those including other references, as the SB-SH reliability estimates for the linked-mastoids reference were typically greater at frontal sites compared to the average and online reference.
Prior to assuming that the estimates of reliability summarized above would generalize to similar studies, however, there are a number of issues that should be addressed with respect to data recording, reduction, and analysis procedures (e.g. scalp montage, sampling rate, and artifact rejection criteria). Perhaps the most important of these considerations is that the reliability of a scale increases as the true-score variance of the value being measured increases (assuming the error variance does not increase). Assuming that frontal alpha asymmetry measures are in some way related to the construct of interest (e.g. history or risk of depression, anxiety, etc.), any estimate of the reliability of frontal alpha asymmetry will increase as the underlying variability in the sample increases. In the present study, the pool of potential participants was oversampled such that the distribution of BDI scores was roughly uniform across both extremes. In contrast, reliability of frontal alpha asymmetry in studies with intentionally restricted range may be lower than the values reported here. For example, if it is assumed that both BDI scores and resting frontal alpha asymmetry are related, in part, to the same underlying construct, restricting the sample range to only those participants who are currently depressed will necessarily restrict the range of the construct within the sample, thereby reducing the reliability of resting frontal alpha asymmetry.
A more pragmatic consideration when determining the amount of data to record is how much data will be lost due to artifacts. Figure 5 shows the distribution of useable epochs following artifact rejection for the data presented here. While most of the records have useable epochs that far exceed the threshold for “reasonable” reliability shown above (i.e. the 160 epochs associated with reliability coefficients >= 0.90), there are a number of cases in which the amount of useable data is near or below that threshold. Care should be taken, then, in constructing an experiment in which total EEG recording time is associated with what would be considered reasonable reliability, as much of the data may be subsequently lost during artifact rejection. In the present study, the majority of data loss was due to ocular artifact rejection, most of which were blinks. Hagemann & Naumann (2001) found, however, that the presence of blinks did not significantly alter frontal alpha asymmetry scores, and the present study found little difference in terms of SB-SH reliability estimates as a function of the inclusion or exclusion of ocular artifacts. Thus, retaining epochs with ocular activity may allow for the reduction of EEG recording length while maintaining reasonable reliability.
Figure 5.

Percentage of resting EEG datasets (of a total of 832, aggregated across participants, recording session, and within-day resting task) as a function of percentage of artifact-free epochs (with resting task having a maximum of 952 epochs).
Finally, care must be taken in assuming that the SB-SH reliability estimates reported above would be identical to that resting data recorded over a period substantially shorter than eight minutes, as EEG recorded immediately after the onset of the resting session may differ from that collected later in the session. The main findings reported above are estimates obtained by randomly sampling epochs from across all eight minutes of the resting task. As such, it should not be assumed that the estimates of reliability associated with any given epoch set size N would be identical if only N epochs were recorded. Despite this, an additional analysis using the current method showed that SB-SH reliability estimates were in fact similar when only the first two minutes were used. With an epoch set size of 100, SB-SH reliability estimates from the first two minutes differed a maximum of .035 from those using all eight minutes across all pairs and references.
Multiple “asymmetry items”
The estimates of internal consistency reliability described above use the average power across individual epochs in the calculation of asymmetry scores, and as such these estimates address the issue of the amount of data required to obtain acceptable reliability in a frontal EEG asymmetry dataset. These results should not be confused, however, with an assessment of reliability in which asymmetry scores are derived for the individual epochs themselves. The latter approach would require asymmetry scores to be calculated on an epoch by epoch basis, i.e. each “item” would consist of the difference in log transformed power between right and left homologous electrodes for every epoch. Using this approach, estimates of internal consistency reliability for this approach could be obtained via Cronbach's alpha. For example, a sampling method similar to that described in the present study could be used to repeatedly select a fixed number of epochs from each EEG dataset, with the estimate of internal consistency reliability being the mean of Cronbach's alpha across all iterations of the sampling procedure. This approach was not used, since it is inconsistent with previous studies assessing frontal asymmetry that treat asymmetry as the difference in average alpha power between homologous pairs. Since the log-transform introduces a non-linearity, the difference between average right and left log-transformed alpha power is not equivalent to the average of the difference between log-transformed right and left alpha power. The split-half method employed here thus addresses the extent to which consistent estimates of internal consistency reliability can be obtained using various numbers of epochs to obtain estimates of average alpha power, with these averages subsequently used to calculate asymmetry scores.
Alternative methods of estimating internal consistency reliability
For this study, it was assumed that the individual epochs used in the STFT represent the best candidate item in estimating internal consistency reliability of asymmetry scores, as these epochs represent the smallest occasion of measurement (thereby maximizing the number of items for the estimate of reliability). Nonetheless, this use of epochs entails that the estimate of internal consistency reliability is dependent on how the STFT is employed. For example, an arbitrarily large number of items can be obtained by shortening the epoch, or increasing the amount of overlap between successive epochs, or both. In doing so, SB-SH reliability estimates may exceed those described here. This directly follows from the dependence of reliability estimates on the number of items in a given measure, although increased reliability would only occur if the resulting epochs were at least as good as the original epochs in measuring the reliable portion of resting alpha asymmetry. As such, the estimates described here are applicable to frontal EEG asymmetry only in as much as the choice of STFT parameters (e.g. overlap, epoch length, and window function) correspond to those of other studies. Similarly, these results should not be assumed to apply to other methods of estimating the power spectrum (e.g. wavelet analysis).
Cronbach's alpha and the split-half randomization procedure described here are not the only means of estimating internal consistency reliability. Hagemann et al. (2002) obtained estimates of reliability as part of a structural equation model intended to describe the degree to which trait and state level variables determine frontal asymmetry (see also Hagemann et al., 2005). The estimates obtained in these studies were similar to those reported here for epoch set sizes of 160 or more (generally greater than 0.90), and were based on resting data obtained under a similar design (eight 1-minute segments, alternating between eyes open and closed). A more direct comparison is hindered by the dependence of the reliability estimates in Hagemann et al. (2005) and Hagemann et al. (2002) on the more general structural equation model (which, unlike the present study, attempts to account for within-subject variance across separate recording sessions).
Validity
The results of the present study suggest that the reliability of resting frontal alpha asymmetry may be greater than that previously assumed. These results, however, do not directly substantiate claims about the construct validity of frontal alpha asymmetry. Reliability is merely a necessary but nonsufficient condition for construct validity. Although one cause of low reliability is that the items in a test do not reflect the underlying construct to the same degree, it is also possible to have a highly reliable instrument with poor construct validity, as agreement between items may be due to the items being good measures of something other than the construct. The nature of alpha asymmetry poses a number of possible threats to the validity of specific constructs. As an example, estimated power within the alpha band in scalp recorded EEG will likely reflect multiple alpha generators within the brain as well as broadband signal that covers the alpha band (from sources within the brain and from artifacts). Similarly, the propagation of signal from alpha generators within the brain to multiple scalp electrodes limits the extent to which an asymmetry score from any homologous pair of electrodes can be used to infer the asymmetrical activation of cortical areas immediately surrounding those electrodes. Given these constraints, the results reported here suggest that frontal asymmetry scores have the potential to be valid measures of constructs that have been linked to frontal EEG asymmetry, but the assessment of that validity ultimately depends on the agreement between multiple measures intended to assess the same construct.
Conclusions
Estimates of the internal consistency reliability of any measure depend on both the number of items within the measure as well as the extent to which each item measures the variable(s) of interest . In the context of resting frontal EEG alpha asymmetry, previous studies have used segments of the EEG record to construct items that in turn were used, via Cronbach's alpha, to estimate the internal consistency reliability of asymmetry scores. The choice of number and duration of such segments is somewhat arbitrary; in contrast, the individual epochs of the STFT represent every occasion in which a measurement of alpha power was derived from the EEG data. The use of individual epochs resulted in estimates of internal consistency reliability greater than those previously found, while using a much smaller portion of the eight-minute EEG dataset. These estimates also exceeded those obtained by applying the previous methods to the same data (Cronbach's alpha with eight 1-minute items). The finding that reasonable estimates of reliability can be obtained in a comparatively small amount of resting EEG data suggests that it may not be necessary to record for the customary eight minutes when assessing resting frontal alpha asymmetry. Moreover, although it is tempting to extrapolate the present results to task-related data, where the number of epochs may be more limited, the current findings necessarily apply only to resting EEG asymmetry data. Ultimately, the decision concerning how much resting EEG data should be recorded should also factor in the need for additional epochs due to the potential loss of data due to artifacts, as well as the possibility of reduced reliability associated with samples of restricted range.
Acknowledgments
This research was supported in part by grants from the National Institutes of Health (R01‐MH066902) and the National Alliance for Research on Schizophrenia and Depression (NARSAD) to John Allen. The authors wish to thank Eliza Fergerson, Jamie Velo, Dara Halpern, Craig Santerre, Eynav Accortt, Andrew Bismark, and Jay Hegde for assistance with subject recruitment, and to thank James Coan for helping to make the large-scale data collection possible.
Footnotes
Lord & Novick (1968) state that the Cronbach's alpha for all items equals the expected value of Cronbach's alpha applied to all possible split-halves, where each half is combined into single items (which are summary scores of the items within each half). For two items, Cronbach's alpha is equivalent to the Spearman-Brown corrected split-half correlation (assuming the same division of items).
For any given record, the number of unique combinations for set A and B is , where n is the number of available epochs, and k is the number of epochs selected. For an epoch set size of 20 drawn from 40 useable epochs, there are greater than 1015 combinations.
References
- Allen JJ, Iacono WG, Depue RA, Arbisi P. Regional electroencephalographic asymmetries in bipolar seasonal affective disorder before and after exposure to bright light. Biological Psychiatry. 1993;33(8-9):642–646. doi: 10.1016/0006-3223(93)90104-l. [DOI] [PubMed] [Google Scholar]
- Allen JJB, Coan JA, Nazarian M. Issues and assumptions on the road from raw signals to metrics of frontal EEG asymmetry in emotion. Biological Psychology. 2004;67(1):183–218. doi: 10.1016/j.biopsycho.2004.03.007. [DOI] [PubMed] [Google Scholar]
- Allen JJB, Kline JP. Frontal EEG asymmetry, emotion, and psychopathology: the first, and the next 25 years. Biological Psychology. 2004;67:1–5. doi: 10.1016/j.biopsycho.2004.03.001. [DOI] [PubMed] [Google Scholar]
- Allen JJB, Urry HL, Hitt SK, Coan JA. The stability of resting frontal electroencephalographic asymmetry in depression. Psychophysiology. 2004;41(2):269–280. doi: 10.1111/j.1469-8986.2003.00149.x. [DOI] [PubMed] [Google Scholar]
- Beck AT, Ward CH, Mendelson M, Mock J, Erbaugh J. An inventory for measuring depression. Archives of General Psychiatry. 1961;4:561–571. doi: 10.1001/archpsyc.1961.01710120031004. [DOI] [PubMed] [Google Scholar]
- Chapman LJ, Chapman JP. The measurement of differential deficit. Journal of Psychiatric Research. 1978;14(1):303–311. doi: 10.1016/0022-3956(78)90034-1. [DOI] [PubMed] [Google Scholar]
- Chapman LJ, Chapman JP. The measurement of handedness. Brain & Cognition. 1987;6(2):175–183. doi: 10.1016/0278-2626(87)90118-7. [DOI] [PubMed] [Google Scholar]
- Chapman LJ, Chapman JP. Artifactual and genuine relationships of lateral difference scores to overall accuracy in studies of laterality. Psychological Bulletin. 1988;104(1):127–136. doi: 10.1037/0033-2909.104.1.127. [DOI] [PubMed] [Google Scholar]
- Coan J, Allen JJB. Frontal EEG asymmetry and the behavioral activation and inhibition systems. Psychophysiology. 2003;40(1):106–114. doi: 10.1111/1469-8986.00011. [DOI] [PubMed] [Google Scholar]
- Coan J, Allen JJB. The state and trait nature of frontal EEG asymmetry in emotion. In: Hugdahl K, Davidson RJ, editors. The asymmetrical brain. MIT Press; 2003a. pp. 565–615. [Google Scholar]
- Coan JA, Allen JJB. Varieties of emotional experience during voluntary emotional facial expressions. Emotions inside Out. 2003b;1000:375–379. doi: 10.1196/annals.1280.034. [DOI] [PubMed] [Google Scholar]
- Coan JA, Allen JJB. Frontal EEG asymmetry as a moderator and mediator of emotion. Biological Psychology. 2004;67:7–50. doi: 10.1016/j.biopsycho.2004.03.002. [DOI] [PubMed] [Google Scholar]
- Coan JA, Allen JJB, Harmon-Jones E. Voluntary facial expression and hemispheric asymmetry over the frontal cortex. Psychophysiology. 2001;38(6):912–925. doi: 10.1111/1469-8986.3860912. [DOI] [PubMed] [Google Scholar]
- Davidson RJ. EEG measures of cerebral asymmetry: conceptual and methodological issues. International Journal of Neuroscience. 1988;39(1-2):71–89. doi: 10.3109/00207458808985694. [DOI] [PubMed] [Google Scholar]
- Davidson RJ. Emotion and affective style: Hemispheric substrates. Psychological Science. 1992;3(1):39–43. [Google Scholar]
- Davidson RJ. Parsing affective space: Perspectives from neuropsychology and psychophysiology. Neuropsychology. 1993;7(4):464–475. [Google Scholar]
- Davidson RJ. Affective style and affective disorders: Perspectives from affective neuroscience. Cognition & Emotion. 1998;12(3):307–330. [Google Scholar]
- Davidson RJ, Ekman P, Saron CD, Senulis JA, Friesen WV. Approach-withdrawal and cerebral asymmetry: Emotional expression and brain physiology I. Journal of Personality and Social Psychology. 1990;58:330–341. [PubMed] [Google Scholar]
- Davidson RJ, Marshall JR, Tomarken AJ, Henriques JB. While a phobic waits: regional brain electrical and autonomic activity in social phobics during anticipation of public speaking. Biological Psychiatry. 2000;47(2):85–95. doi: 10.1016/s0006-3223(99)00222-x. [DOI] [PubMed] [Google Scholar]
- Ekman P, Davidson RJ. Voluntary smiling changes regional brain activity. Psychological Science. 1993;4(5):342–345. [Google Scholar]
- Ekman P, Davidson RJ, Friesen WV. The Duchenne smile: emotional expression and brain physiology. II. Journal of Personality & Social Psychology. 1990;58(2):342–353. [PubMed] [Google Scholar]
- Fox NA, Davidson RJ. Taste-elicited changes in facial signs of emotion and the asymmetry of brain electrical activity in human newborns. Neuropsychologia. 1986;24(3):417–422. doi: 10.1016/0028-3932(86)90028-x. [DOI] [PubMed] [Google Scholar]
- Fox NA, Davidson RJ. Patterns of brain electrical activity during facial signs of emotion in 10 month-old infants. Develomental Psychology. 1988;24:230–246. [Google Scholar]
- Gotlib IH, Ranganath C, Rosenfeld JP. Frontal EEG alpha asymmetry, depression, and cognitive functioning. Cognition & Emotion. 1998;12(3):449–478. [Google Scholar]
- Gray JA. The psychophysiological basis of introversion-extraversion: A modification of Eysenck's theory. In: Nebylitsyn VD, Gray JA, editors. The biological bases of individual behavior. San Diego: Academic Press; 1972. pp. 182–205. [Google Scholar]
- Gray JA. The psychology of fear and stress. 2nd. Cambridge, England UK: Cambridge University Press; 1987. [Google Scholar]
- Gray JA. Brain systems that mediate both emotion and cognition. Cognition and Emotion. 1990;4:269–288. [Google Scholar]
- Hagemann D, Hewig J, Seifert J, Naumann E, Bartussek D. The latent state-trait structure of resting EEG asymmetry: Replication and extension. Psychophysiology. 2005;42(6):740–752. doi: 10.1111/j.1469-8986.2005.00367.x. [DOI] [PubMed] [Google Scholar]
- Hagemann D, Naumann E. The effects of ocular artifacts on (lateralized) broadband power in the EEG. Clinical Neurophysiology. 2001;112(2):215–231. doi: 10.1016/s1388-2457(00)00541-1. [DOI] [PubMed] [Google Scholar]
- Hagemann D, Naumann E, Thayer JF. The quest for the EEG reference revisited: A glance from brain asymmetry research. Psychophysiology. 2001;38:847–857. [PubMed] [Google Scholar]
- Hagemann D, Thayer JF, Naumann E, Bartussek D. Does Resting Electroencephalograph Asymmetry Reflect a Trait? An Application of Latent State-Trait Theory. Journal of Personality & Social Psychology. 2002;82(4):619–641. [PubMed] [Google Scholar]
- Hamilton M. Development of a rating scale for primary depressive illness. British Journal of Social & Clinical Psychology. 1967;82(4):619–641. doi: 10.1111/j.2044-8260.1967.tb00530.x. [DOI] [PubMed] [Google Scholar]
- Harmon-Jones E, Allen JJB. Behavioral activation sensitivity and resting frontal EEG asymmetry: covariation of putative indicators related to risk for mood disorders. Journal of Abnormal Psychology. 1997;106(1):159–163. doi: 10.1037//0021-843x.106.1.159. [DOI] [PubMed] [Google Scholar]
- Harmon-Jones E, Allen JJB. Anger and frontal brain activity: EEG asymmetry consistent with approach motivation despite negative affective valence. Journal of Personality & Social Psychology. 1998;74(5):1310–1316. doi: 10.1037//0022-3514.74.5.1310. [DOI] [PubMed] [Google Scholar]
- Heller W, Nitschke JB. The puzzle of regional brain activity in depression and anxiety: The importance of subtypes and comorbidity. Cognition & Emotion. 1998;12(3):421–447. [Google Scholar]
- Henriques JB, Davidson RJ. Regional brain electrical asymmetries discriminate between previously depressed and healthy control subjects. Journal of Abnormal Psychology. 1990;99(1):22–31. doi: 10.1037//0021-843x.99.1.22. [DOI] [PubMed] [Google Scholar]
- Henriques JB, Davidson RJ. Left frontal hypoactivation in depression. Journal of Abnormal Psychology. 1991;100(4):535–545. doi: 10.1037//0021-843x.100.4.535. [DOI] [PubMed] [Google Scholar]
- Jones NA, Fox NA. Electroencephalogram asymmetry during emotionally evocative films and its relation to positive and negative affectivity. Brain & Cognition. 1992;20(2):280–299. doi: 10.1016/0278-2626(92)90021-d. [DOI] [PubMed] [Google Scholar]
- Lord FM, Novick MR. Statistical theories of mental test scores. Reading, Mass.: Addison-Wesley Pub. Co.; 1968. [Google Scholar]
- Oakes TR, Pizzagalli DA, Hendrick AM, Horras KA, Larson CL, Abercrombie HC, Schaefer SM, Koger JV, Davidson RJ. Functional Coupling of Simultaneous Electrical and Metabolic Activity in the Human Brain. Human Brain Mapping. 2004;21(4):257–270. doi: 10.1002/hbm.20004. [DOI] [PMC free article] [PubMed] [Google Scholar]
- Reid SA, Duke LM, Allen JJB. Resting frontal electroencephalographic asymmetry in depression: inconsistencies suggest the need to identify mediating factors. Psychophysiology. 1998;35(4):389–404. [PubMed] [Google Scholar]
- Schaffer CE, Davidson RJ, Saron C. Frontal and parietal electroencephalogram asymmetry in depressed and nondepressed subjects. Biological Psychiatry. 1983;18(7):753–762. [PubMed] [Google Scholar]
- Shrout PE, Fleiss JL. Intraclass correlations: Uses in assessing rater reliability. Psychological Bulletin. 1979;86:420–428. doi: 10.1037//0033-2909.86.2.420. [DOI] [PubMed] [Google Scholar]
- Steyer R, Ferring D, Schmitt MJ. States and traits in psychological assessment. European Journal of Psychological Assessment. 1992;8(2):79–98. [Google Scholar]
- Sutton SK, Davidson RJ. Prefrontal brain asymmetry: A biological substrate of the behavioral approach and inhibition systems. Psychological Science. 1997;8(3):204–210. [Google Scholar]
- Tomarken AJ, Davidson RJ, Henriques JB. Resting frontal brain asymmetry predicts affective responses to films. Journal of Personality & Social Psychology. 1990;59(4):791–801. doi: 10.1037//0022-3514.59.4.791. [DOI] [PubMed] [Google Scholar]
- Tomarken AJ, Davidson RJ, Wheeler RE, Kinney L. Psychometric properties of resting anterior EEG asymmetry: temporal stability and internal consistency. Psychophysiology. 1992;29(5):576–592. doi: 10.1111/j.1469-8986.1992.tb02034.x. [DOI] [PubMed] [Google Scholar]
- Towers DN, Allen JJB. manuscript submitted for review. [Google Scholar]
- Wiedemann G, Pauli P, Dengler W, Lutzenberger W, Birbaumer N, Buchkremer G. Frontal brain asymmetry as a biological substrate of emotions in patients with panic disorders. Archives of General Psychiatry. 1999;56(1):78–84. doi: 10.1001/archpsyc.56.1.78. [DOI] [PubMed] [Google Scholar]