

Abstract
The molecular dynamics of spin labeled compounds included into the solid phase of cyclodextrins (CD) has been studied using conventional (X-Band) ESR at 9 GHz and high-field high-frequency (HFHF) ESR at 240 and 170GHz. The patterns of axial rotation at these higher frequencies are clear just by inspection of the spectrum, unlike the case for 9 GHz spectra. That is HFHF ESR is sensitive to molecular motion about the diffusion axis collinear with the X, Y or Z-direction of the magnetic g- and A-tensors of the nitroxide moiety (referred to respectively as X, Y or Z-rotation). For doxyl stearic acids (Z-rotation) and TEMPOyl caprylate (X-rotation) included in β- and γ-CD’s we were able to determine the rate of molecular motion and the corresponding potential barriers. We emphasize that determining the rate of Z-rotation by ESR is feasible only using HFHF ESR. For the X-rotation case we suggest that the motion of the nitroxide moiety consists of fast small-angle librations about the magnetic X-axis superimposed by rotational diffusion about the same axis. The potential barrier of 1.7 Kcal/mol for this rotational diffusion is unusually low. A fascinating feature of TEMPO derivatives included in β-CD is the detectable molecular motion at temperatures below 77K. For the other CD – spin probe systems, we used multifrequency analysis to assign the conformations of spin-labeled molecules. A dramatic spectral change for 16-sasl in β- and γ-CDs at ~ 260K corresponds to a tilting of the position of the nitroxide moiety on the rotating molecule relative to the long diffusion axis, while for TEMPO derivatives in γ cyclodextrin below 200K, we observe a rapid transition from fast to very slow rotational motion. More complex features are best studied by means of multifrequency ESR experiments. The visual clarity and the simplicity of analysis of the ESR spectra shown in this work should provide a benchmark for future studies of molecular motion by HFHF ESR.
Introduction
Cyclodextrins (CDs) are cyclic oligomers of D-glucopyranose. Due to the presence of a hydrophobic cavity in the molecule they are able to form guest—host complexes with a variety of organic compounds32,10. Complete or partial inclusion into the CD cavity dramatically affects physical and chemical properties of the guest molecule in many cases. For instance, for many hydrophobic compounds binding to CDs dramatically increases the solubility in water, making possible delivery of various pharmaceuticals33 or extraction of biologically important molecules, such as cholesterol from biomembranes37. The presence of CD accelerates catalytic hydrolysis of esters16 and stabilizes some short-lived radicals23. The quantum yield of fluorescence of aromatic hydrocarbons and heterocyclic compounds increases upon inclusion into the CD cavity6. In order to better understand the change in properties of organic compounds in CD complexes, knowledge of their motional features upon binding to CDs may be a key point.
Cyclodextrin inclusion compounds have been extensively studied in solution or in a crystalline state. In most industrial applications, however, CDs are used in a highly disperse polycrystalline, probably partially amorphous, state 20. Molecular probes can be useful to aid in analyzing such applications.
The sensitivity of spin label ESR to molecular motion and local polarity has made it one of the most valuable techniques in physical-chemical and biophysical studies. This sensitivity can be dramatically improved using High Field/High Frequency (HFHF) ESR. In the early 70’s Griffith and co-authors demonstrated at low ESR frequencies (9GHz) patterns of anisotropic molecular motion about various axes by including spin labeled molecules into monocrystals of thiourea and polycrystalline CDs 2. In the present work, we use HFHF ESR to carry out detailed studies for similar systems, for which we determine the details of the molecular motions. HFHF, which provides exceptional orientational resolution, gives a clear picture of molecular motion and its anisotropy 4,17. Also, at the lowest temperatures it enables the unambiguous determination of the A and g – tensors.
Thus in this work, we show how HF ESR provides a comprehensive picture of molecular dynamics and motional modes of spin labeled molecules where lower frequency ESR is either insensitive or ambiguous. For example, whereas the nearly axially symmetrical A-tensor, typical for nitroxides, renders low frequency spectra virtually insensitive to the motion about the diffusion axis coaxial with the magnetic Z-axis, the dominance of the rhombic g-tensor at HF enables its accurate study. One of our distinctive observations enabled by HFHF ESR is that of anomalous mobility of spin labeled molecules included in the CD solid phase at temperatures as low as 50K. The results reported herein should provide a useful benchmark for the study of molecular motion by HFHF ESR and display its virtues vs. ESR at conventional frequencies. We do wish to emphasize that in this study we make use of rather simple motional models, which leads to semi-quantitative, but visually clear and intuitive interpretation of the results. More sophisticated analysis is planned in future work.
Materials and methods
β- and γ-cyclodextrins were purchased from Sigma, doxyl-labeled stearic acids were from TCI America, palmitic acid, caprylic acid, N,N′-Dicyclohexylcarbodiimide (DCC), 4-(Dimethylamino)pyridine (DMAP), 4-amino-TEMPO (TEMPAMINE) and 4-hydroxy-TEMPO (TEMPOL) were from Aldrich. TEMPO-derivatives, TEMPOyl-caprylate (4-hydroxy – 2,2,6,6-tetramethylpiperidine-1-oxyl-caprylate), TEMPOyl-palmitate (4-hydroxy – 2,2,6,6-tetramethylpiperidine-1-oxyl-palmitate) and TEMPOyl-palmitamide (4-palmitamido – 2,2,6,6-tetramethylpiperidine-1-oxyl), were synthesized using the standard DCC-promoted reaction between corresponding acids and TEMPAMINE or TEMPOL 19 in methylene chloride and purified on a silica column in 1:24 methanol:chloroform. For forming ester bonds a small amount of DMAP was used as a catalyst. The products, which give a single spot in the TLC, were further characterized by mass spectrometry.
The chemical structures of two spin labeled stearic acids and TEMPO derivatives used in our HFHF study are shown in Fig. 1.
Fig. 1.

Chemical structures of some spin labels used in the study.
The spin labels were trapped in the solid host using a modification of the method, previously described by Griffith1. 50 mg/ml of β- or γ-CD in water were mixed with the same volume of 0.5 mM solution of corresponding spin-labeled compound in decane or cyclohexane and Vortexed. For β-CD, because of its low solubility in water at room temperature, the mixing procedure required a temperature of ~70°C. After several hours at room temperature the precipitate was separated from the liquid phases using Centricon concentrators and a centrifuge for Eppendorf tubes, washed with hexane in the same concentrator and briefly dried. The procedure allows effective separation of the solid phase and at the same time prevents loss of the crystallohydrate water from the sample by drying. As we discuss below, keeping the samples well hydrated is the key factor for obtaining reproducible results.
X-Band ESR spectra were recorded on a Bruker EMX spectrometer at a frequency of 9.55 GHz under standard conditions. Dry nitrogen gas flow under the control of a Varian temperature controller was used to stabilize the temperature in the range of 190–320K. Spectra at temperatures between 4 and 200 K were recorded using a liquid helium cryostat, ESR-10 (Oxford Instruments Ltd, England).
High field ESR spectra were recorded on a 170/240 GHz (6/9T) ESR spectrometer, which was designed and built at ACERT at Cornell University 14. The data collection routine is based on LabView virtual instrument drivers written at ACERT. A Lakeshore 340 temperature controller was used to stabilize the temperature.
Nonlinear least-squares analysis of ESR spectra based on the stochastic Liouville equation29,31 were performed using the fitting program by Budil et al.9. The magnetic g-tensor components needed for simulations were obtained from fitting rigid limit 240 GHz spectra recorded at 77K, or, in the case of anomalous mobility below this temperature (see below), at 25K. The field sweep was calibrated using a Mn2+/MnO ESR standard as well as glassy solutions of PD TEMPONE in toluene and in water/glycerol at 77K with known principal values of the g-tensor8,7. Since the positions of the central peak (mI=0) in the Z-region were the same as for PD TEMPONE in water/glycerol or toluene within experimental uncertainty, we assigned to them the common gzz value of 2.00233 reported for PD TEMPONE 7 and accurately determined the gyy and gzz values relative to this gzz value from the corresponding spectral splittings. The A-tensor components were obtained from fitting rigid limit 9.5 GHz spectra. These tensor components are summarized in Table 1.
Table 1.
Principal values of the g- and A-tensors for various spin labeled molecules included into solid phase of β- and γ-cyclodextrins. gzz is fixed at 2.00233, cf. text. *.
| System | gxx | gyy | Axx, G | Ayy, G | Azz, G |
|---|---|---|---|---|---|
| Tempoyl-Caprylate, β-CD | 2.01041 | 2.00641 | 7.0 | 6.4 | 33.6 |
| Tempoyl-Palmitate, β-CD | 2.01035 | 2.00642 | 7.0 | 6.4 | 33.7 |
| Tempoyl-Palmitamide, β-CD | 2.01038 | 2.00644 | 7.0 | 6.4 | 33.7 |
| Tempoyl-Caprylate, γ-CD | 2.01019 | 2.00621 | 6.7 | 6.2 | 33.6 |
| 5-sasl/γ-CD | 2.00955 | 2.00614 | 5.1 | 4.5 | 33.2 |
| 5-sasl/β-CD | 2.00942 | 2.00611 | 5.3 | 4.9 | 32.3 |
| 16-sasl/γ-CD | 2.00945 | 2.00613 | 5.1 | 4.5 | 33.3 |
| 16-sasl/β-CD | 2.00936 | 2.00611 | 5.4 | 5.0 | 32.7 |
Uncertainties: in gxx−gzz and gyy− gzz approx. 1·10−5, Azz, approx. 0.2G, Axx and Ayy approx. 0.5G.
Where it was possible, we used for simulations of the motions a simple model of axial anisotropic rotation with or without diffusion tilt angle. In some cases, when the simple model failed, we used the MOMD model28 with orienting potential or the fast internal motion (FIM) model 24,21,28.
Reproducibility of ESR spectra
The ESR lineshape of included spin-labeled compounds depends in general on the presence of crystallohydrate water in the molecular structure of CD. Though mild drying in air over several hours does not substantially affect the EPR spectrum, several hours of evacuation does cause dramatic change, as seen in fig. 2. The change, as follows from a simple inspection of the HF ESR spectrum shown in fig. 2, is due to a complete cessation of Z-rotation and convergence to a nearly rigid limit spectrum after the evacuation. To rule out the possibility that the changes in the spectrum are due to the loss of organic co-precipitant (cyclohexane, decane etc.) rather than water, a simple experiment was carried out. After a small amount of water was added to a sample after a 12hr evacuation, the spectrum almost completely recovered the lineshape before the drying. Addition of excess cyclohexane does not change the lineshape up to the point when spin probes start to partition into the bulk liquid organic phase. Simultaneous addition of cyclohexane and water to an evacuated sample gave the same effect as water addition alone. In the current study, in order to avoid possible heterogeneity of the samples due to non-uniform drying, we excluded the drying procedure. Instead, we separated the inclusion compound and removed the remaining liquid phases by centrifugation in sealed tubes.
Fig. 2.
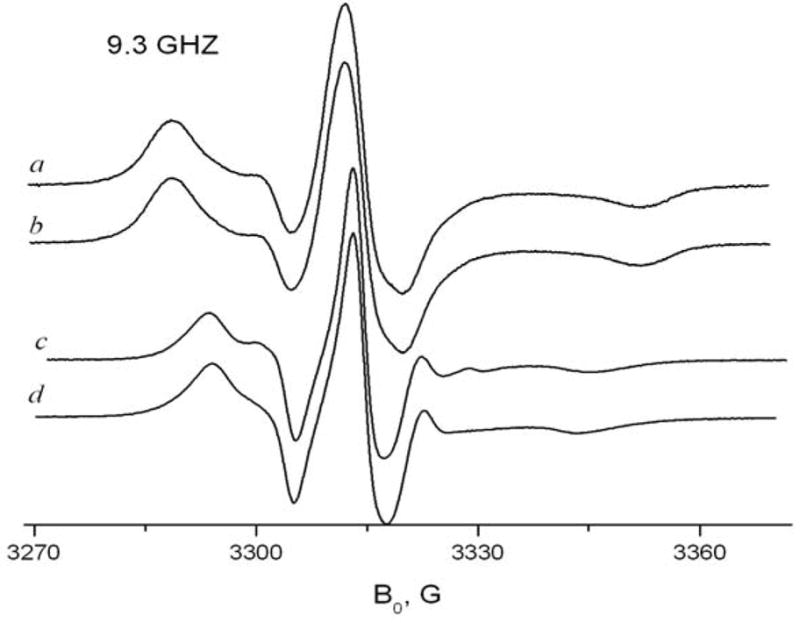
Effects of hydration and addition of cyclohexane for 16-sasl in γ-CD, at A) 9 GHz, 278K and B) 170GHz, 293K: a) the sample prepared by the standard method and kept under vacuum for 12 hrs b) the same sample after adding cyclohexane c) the sample after additional adding water d) the initial line shape before pumping.
Results and discussion
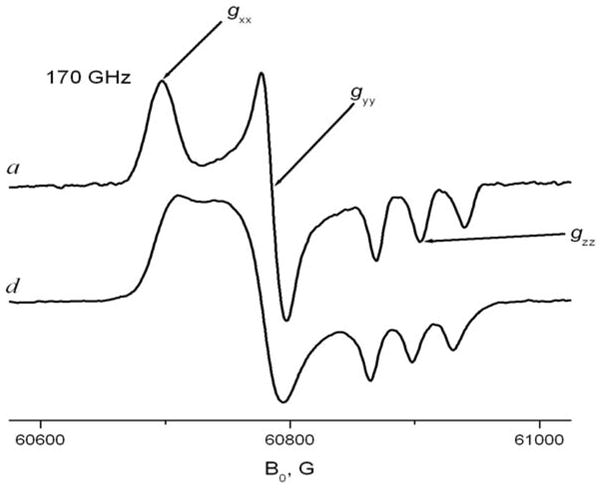
One of the main virtues of HFHF ESR over ESR at conventional frequencies is the excellent orientational resolution that it provides for studies utilizing nitroxide spin labels17,8,4 High Field ESR spectroscopy provides g-tensor resolved ESR spectroscopy in frozen or “powder” media. As seen for the rigid limit spectrum at 170GHz shown in Fig. 3A, the regions corresponding to molecules with their X-axis parallel to B0 (X-region), Y-axis parallel to B0 (Y-region) and Z-axis parallel to B0 (Z-region) are well separated due to the dominant role of the g-tensor. As a result, once motional effects are discernable in the spectrum, one can discern about which axis (or axes) the motion occurs. Fast rotation about a diffusion axis collinear with the magnetic X-, Y- or Z-axis of the nitroxide radical does not, of course, affect the field position of the corresponding spectral region. Fig 3 shows experimental 170GHz spectra corresponding to fast axial rotation about the X-, Y- or Z-axes in comparison with the rigid limit spectrum. For example, if the rotation about the X-axis is very fast on the ESR time scale, one can still see a sharp peak at the same magnetic field as for the X-region of the rigid limit spectrum, (cf. Fig. 3C). However, instead of separate peaks corresponding Y- and Z-regions of the rigid limit spectrum, one observes a single peak with an averaged g-factor value of (gyy+gzz)/2. For the case of Z-rotation, (cf. Fig. 3B) two regions corresponding effective g-values gzz and (gxx+gyy)/2 are also observable in the spectrum, with the Z-region split into a well-resolved triplet due to the large value of the hyperfine constant Azz. For fast Y-rotation, since for nitroxides gyy ~ (gxx+gzz)/2, the HFHF ESR spectrum takes an appearance of a single sharp line superimposed on a broader line (cf. Fig 3D). Unlike the X- or Z-rotation cases, the conclusion of Y-rotation may not be immediately clear by simple inspection of the high field ESR spectrum and may require a multifrequency study for verification. Since we did not observe fast Y-rotation in solid CDs, it is shown in Fig. 3D for the case of a spin labeled cholesterol analog, CSL, in membrane vesicles. In our study, these simple models of anisotropic axial rotation are used for semi-quantitative interpretation of ESR spectra and for extracting motional and thermodynamic parameters of spin-labeled molecules included into solid CDs.
Fig. 3. 170 GHz spectra of nitroxide radicals corresponding to different modes of molecular motion.
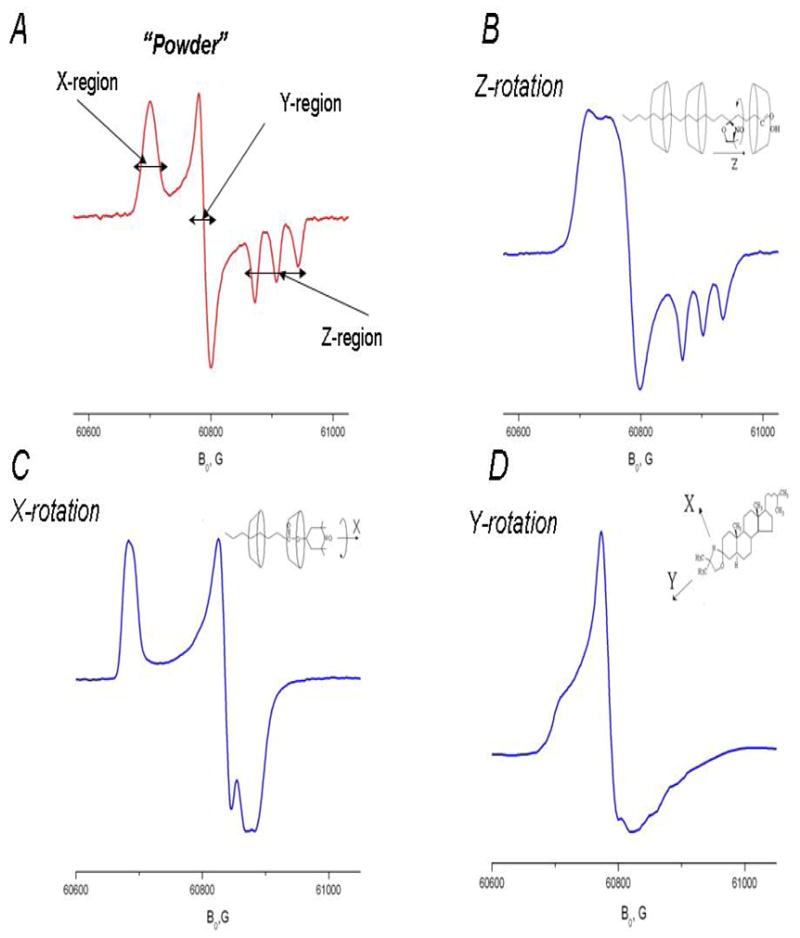
A. 5-sasl in γ-CD with crystallohydrate water removed by overnight evacuation at 293K: rigid limit spectrum.
B. 5-sasl in γ-CD crystallohydrate at 292K
C. TEMPOyl-caprylate in β-CD 293K
D. CSL spin label in the DPPC membrane at 295K
Doxyl stearic acids
Fig. 4 shows 9.5 GHz spectra of doxylstearic acids at room temperature in solid γ-CD. With the exception of 16-sasl (discussed below) the spectra of all the doxyl-stearic acids are similar. The pattern of anisotropic rotation about the Z-axis is obvious for 5-sasl from the HFHF spectrum just by a simple visual inspection of its 170GHz spectrum (fig. 3B). One can see a merging of X- and Y-regions of the spectrum whereas the Z-region essentially retains the structure of the rigid limit spectrum. Simulation of HFHF spectra using a simple model of axial Z-rotation gives reasonable semiquantitative agreement with the experimental spectra for 5-sasl (cf. Fig. 5) yielding the R⊥ and R|| values at temperatures above 210K from the best fits (cf. Table 2). The results are indicative of strong rotational anisotropy, with R|| > 50R⊥ at room temperature. We have to note here that, strictly speaking, the model of unrestricted slow off-axial motion (R⊥) is not very realistic since the molecular motion is restricted in amplitude by the CD cavities. However, the rates of the off-axial motion obtained below 273K are so slow that this motion has only a marginal effect on the shape of the ESR spectrum, consistent with its uniaxiality on the time scale of 170 GHz ESR. A more realistic MOMD model with extremely high order parameter, S ≥ 0.95 and a greater R⊥ yields exactly the same R|| values over the whole temperature range and a comparable quality of fit (cf. Supplemental material – simulations, also see results for TEMPO-derivatives below).
Fig. 4.
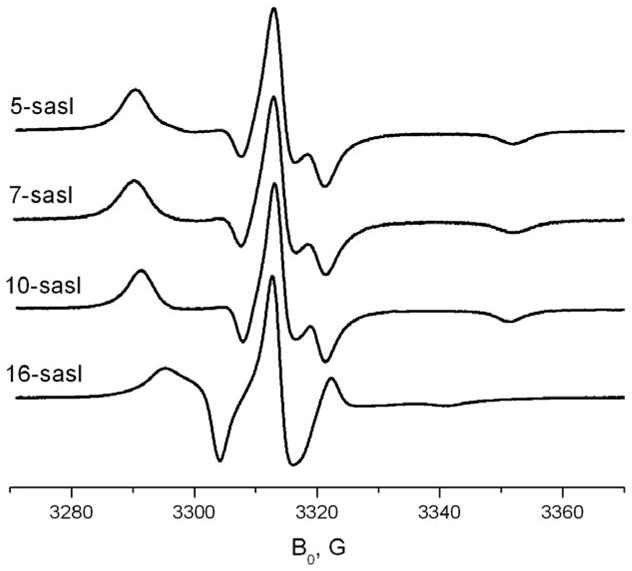
9 GHz spectra of 5-, 7-, 10- and 16-doxylstearic acids at 293K in solid γ-CD
Fig. 5.

170 GHz spectra of 5-sasl in solid γ-CD at 80 – 295K. Dotted lines show simulations.
Table 2.
Motional dynamics parameters in the γ-CD/5-sasl system
| Temperature, K | R|| s−1 | R⊥s−1 |
|---|---|---|
| 78 | rigid limit | |
| 210 | 1.5·107 | 3.3·106 |
| 240 | 2·107 | 7.5·106 |
| 250 | 2.4·107 | 7.8·106 |
| 265 | 5·107 | 9·106 |
| 273 | 6·107 | 1.18·107 |
| 293 | 1.7·108 | 2.5·107 |
The activation energy for motion about the long molecular axis (i.e. R||) can be determined from diffusion coefficients R|| given in Table 2 using the Arrhenius relation It gives ~ 6.3 Kcal/mol, indicative of substantial interaction of spin-labeled molecules with their CD environment;(but see results for X-rotating derivatives of TEMPO below).
We emphasize that determining the rate of Z-rotation by ESR benefits greatly from the use of high frequency. Due to the almost axially symmetric A-tensor for nitroxides and the insufficient g-factor resolution of low frequency ESR, the latter is not sensitive to this type of molecular motion, whose rate is given by R|| However, 9 GHz ESR does show sensitivity to R⊥, which manifests itself in the decreasing outer splitting 2Azz′ and the deepening of the minimum between the maxima of the low field and central components as R⊥ increases (fig. 6). We also note that a multifrequency approach with two or more high frequencies may be very useful in many cases. For example, most high field experiments in this study were carried out at 240GHz. However, for 5sasl the 170GHz spectra show much better patterns of Z-rotation. The pattern of complete merging X- and Y-components with an insignificant change in the position and shape of the Z-component is obvious at this frequency just by visual inspection of the room temperature spectrum. On the other hand, 240GHz ESR gives a faster snapshot of the molecular motion in the same system and shows separate peaks for X- and Y-components in the whole temperature range. However, the Z-rotation pattern at 240GHz is quite clear if spectra at several temperatures are analyzed for the change in positions of X- and Y-components. The validity of the analysis in terms of simple anisotropic diffusion is supported by the fact that diffusion rates determined from simulations of ESR spectra at 240 and 170 GHz are the same.
Fig 6.

Temperature dependence of 9 GHz ESR spectra for 5-sasl in γ- and β-cyclodextrins.
In β- and γ-CDs the Z-rotation patterns obtained for 5-sasl are very similar. It seems likely that two or more CD molecules comprise the hydrocarbon chain on both sides of the nitroxide (Fig 7), which supports a stretched conformation of the chain and, hence, perpendicular orientation of the plane of the nitroxide moiety relative to the chain. In this confinement the nitroxide ring moves like a wheel on the hydrocarbon axis rotating in the hubs of two CD molecules.
Fig 7.
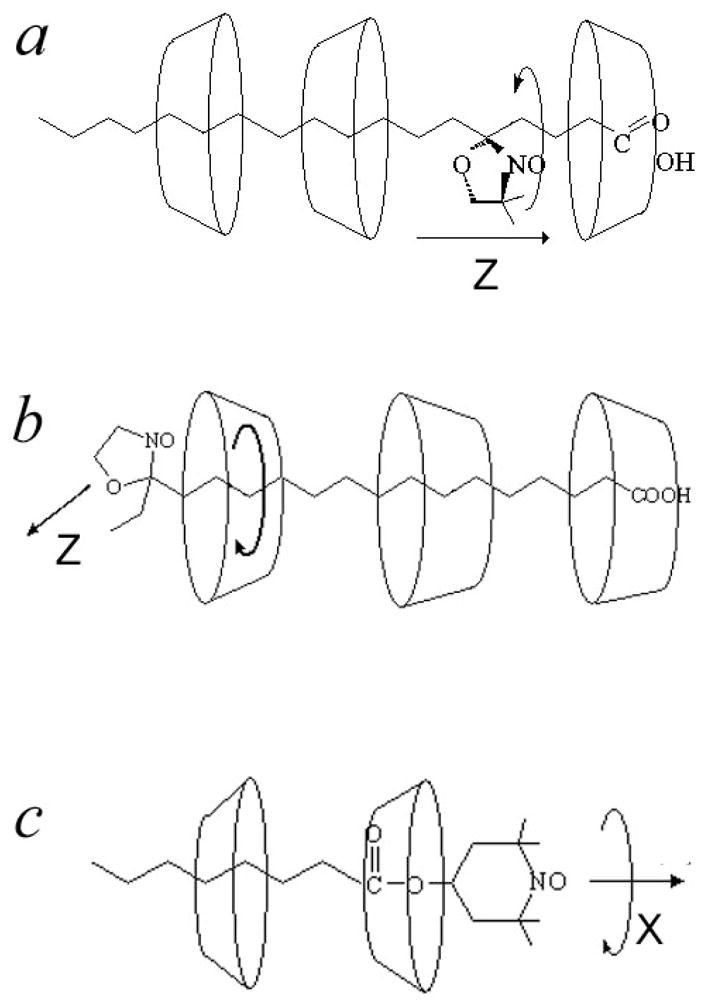
Schematic drawing of the hypothetical arrangement of cyclodextrin molecules around spin-labeled compound: a) 5-sasl b) 16-sasl c) TEMPOyl-caprylate
The values of the g- and A-tensors indicate low polarity of the local environment for the spin label in β- and γ-CDs (cf. Table 1). The polarity value is close to that detected by 16-PC spin label in the most hydrophobic part of a DPPC membrane with corresponding tensor values, which are gxx, gyy, gzz =2.00929, 2.00600, 2.00212, Azz=33.5G 15.
As seen above, (cf. Fig. 4) for 16sasl, the pattern of molecular motion displayed by the HF ESR spectrum is different compared to the other doxyl stearic acids. At room temperature HF and 9 GHz spectra for 16sasl can be simulated using a diffusion tilt angle of 32° (γ-CD) or 38° (β-CD) corresponding to the angle between the magnetic Z-axis and the long diffusion axis of the molecule (cf. Fig. 8). In Fig. 9 spectra of 16-sasl are shown at different temperatures at 240 and 9 GHz. The difference between 16-sasl and other doxylstearates can be explained by an insufficient length of the hydrocarbon chain on one side of the nitroxide moiety to bind a CD molecule (cf. fig 7). Instead of a stretched conformation, the molecule takes on a gauche-like one with the direction of the magnetic Z-axis different from the long diffusion axis.
Fig 8.

Simulation of the ESR spectrum of 16-sasl at 9 GHz(a) and 240 GHz (b) at room temperature. The g- and A-tensor components for all simulations are taken from Table 1. Simulation parameters, see 9 for both cases, betad is the diffusion tilt angle between the long diffusion axis and the magnetic Z-axis of the nitroxide group.
β-CD 9 GHz: R⊥/R|| = 1.6·107s−1/5·108s−1, betad = 38°
240 GHz: R⊥/R|| = 4·107s−1/109s−1, betad = 38°
γ-CD 9 GHz: R⊥/R|| = 3.16·107s−1/7.9·108s−1, betad = 32°
240 GHz: R⊥/R|| = 7.9·107s−1/109s−1, betad = 32°
Fig. 9.


240 GHz and 9 GHz ESR spectra of 16-sasl, temperature dependence, A) in β-CD; B) in γ-CD
An interesting feature of 16-sasl included into the solid phase of CDs is a dramatic change of the spectrum within a relatively narrow temperature range. This change is an indication of a change in the mode of molecular motion (cf. fig 9). For both β- and γ-CDs at ~ 220–270K, one can see this dramatic transformation in the spectrum. It is manifested at 9 GHz as a change of the outer splitting from close to the rigid limit value of 64G at 210 K to ~ 47G in γ- and ~ 42 G in β-CD at room temperature. At intermediate temperatures one can clearly see two coexisting components and an isosbestic-point like behavior. But it is not precisely an isosbestic point since the spectra of both components are also changing with temperature, not just their ratio. This ratio changes from 1:10 to 10:1 within a temperature interval of ~50K, which gives an estimate for the enthalpy of the transition 10–11 Kcal/mol. Similar values were observed for a number of cases of conformational interconversion of simple organic molecules, see, for example 18,27. HF ESR helps to understand the nature of the transition. At 240GHz increasing the temperature from 190K (corresponding to the nearly rigid limit) causes two separate effects. First, as seen also at 9 GHz, is emergence of a second component. Second, one sees a change in the shape of the initial, rigid limit-like component. Similar to 5 sasl, at 240GHz the X-peak moves towards the Y-peak; at the same time the position of the Z-triplet remains virtually unchanged. Thus, just an inspection of the high-field spectrum leads to the conclusion of Z-rotation at lower temperatures and assigns the conformational change as a change in the orientation of the nitroxide moiety relative to the long molecular axis. This assignment cannot be obtained from 9GHz, since the low frequency does not allow reliable distinction between this kind of conformational change and complete cessation of axial rotation at low temperature. Also, comparing results at the two high frequencies, 240 GHz (cf. Fig. 2) gives better separation of the two components than 170GHz (not shown). One can also see that in the case of 16sasl, the Z-rotation is faster than for 5-sasl. That is, 5-sasl and 16-sasl within the CD environment have virtually the same values of g- and A-tensors (cf. Table 1). If they both undergo Z-rotation, the spectra at the same motional rate should be similar. As seen in fig. 9 the peak positions for the presumably Z-rotating component of 16sasl at 240K in β-CD correspond to the 308K spectrum of 5-sasl.
4-acyl derivates of TEMPO
Another relatively simple case of molecular motion was observed for 4-acyl TEMPO derivatives in β-CD (Fig 10). They show for a wide temperature range only a single spectral component. The g-tensor values given in Table 1 were determined from rigid limit spectra (T=25K) both at 170 and 240GHz. Interestingly, for this system we observed a systematic difference (nearly 1G) between Azz values determined as an outer splitting of the 9 GHz spectrum and the distance between three hyperfine peaks in the Z-region of the high field (170 or 240 GHz) spectrum. Introducing an angle of 10° between the principal axis of A- and g-tensors yields for both frequencies a common value of 33.4G.
Fig. 10.

TEMPOyl caprylate in β-CD. 240 GHz and 9GHz. Temperature dependence. 9 GHz spectra are shown with a 10K step. Simulations are shown in Supplement materials.
An angle of 8.5 degrees between the g- and A-principal axis has been reported in single crystals of TEMPOL 5, the source material for synthesizing our TEMPO derivatives. The g- and A-values are indicative of extremely hydrophobic environment, more hydrophobic than that of toluene where TEMPOyl-caprylate shows gxx,gyy,gzz = 2.01011, 2.00641, 2.00233 and Azz = 34.2. This extremely low polarity value may indicate the nitroxide moiety is virtually pointing away from any neighboring atoms, as if it is effectively in “vacuum”.
At higher temperatures (>200K) the molecular motion can be described as fast X-rotation to a high degree of accuracy. As seen in Table 3 the rotational diffusion rate is higher than observed for doxylstearate derivatives. This observed high rate of axial rotation is unusual for large molecules in the solid phase.
Table 3.
Motional dynamics parameters in the γ-CD/TEMPOyl caprylate
| Temperature, K | R||, s−1 (240GHz) | R||, s−1 (9Hz) |
|---|---|---|
| 25 | rigid limit | |
| 100 | 2.5·106 | 3.1·106 |
| 130 | 4·106 | 1.8·107 |
| 140 | 6. · 107 | 2.6·107 |
| 150 | 1·108 | 4·107 |
| 160 | 1.25·108 | 4.5·107 |
| 170 | 2·108 | 7.2·107 |
| 180 | 2.5·108 | 9.1·107 |
| 190 | 3.2·108 | 1.1·108 |
| 200 | 5·108 | 1.32·108 |
| 240 | 7.9·108 | 1·108 |
| 260 | 1·109 | 2.5·108 |
The activation energy for motion about the long molecular axis can be determined from the diffusion coefficients in Table 2 by using again the Arrhenius relation (ccf. above). Above 140K in the Arrhenius coordinates (fig. 11) the temperature dependence of R|| gives a linear approximation of ln(R||) = 24.09 – 853/T, yielding a potential barrier of ~ 1.7 Kcal/mol. This value of the activation energy is well below the activation energy expected for a trans-gauche conformational change in the hydrocarbon chain, which usually ranges between 3 Kcal/mol obtained by NMR for n – alkanes and 4.5 Kcal/mol determined for non-terminal CH2 - groups of lipid hydrocarbon chains in lipid membranes 26. This observation, as well as the low polarity value for the nitroxide moiety is consistent with a hub – axis model and minimal interaction of spin-labeled molecules with their CD environment. Since rotational barriers for ester (10–15 kcal mol−1) or amide bonds (18–21 kcal mol−1) are even much higher, 11,34 we conclude that ester or amide groups of spin-labeled TEMPO-derivatives are not anchored by the interaction with their CD environment. This minimal interaction allows almost free rotation of the spin-labeled molecule as a whole with a much greater rate than the rate of reorientation around ester or amide groups in the latter case.
Fig 11.
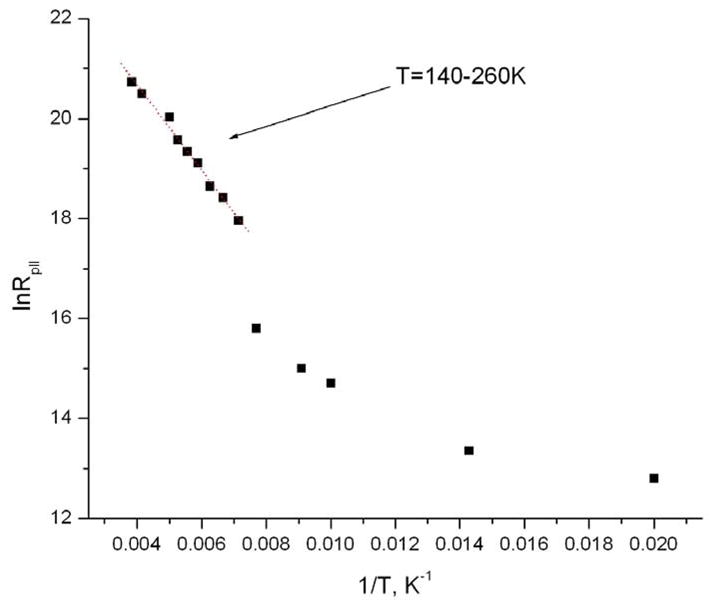
Temperature dependence of R|| for TEMPOyl caprylate in β-CD in Arrhenius coordinates. R|| is determined from simulation of 240 GHz using simple model of axial anisotropic rotation.
Below 140K the Arrhenius dependence undergoes a sharp break and the molecular motion slows down (cf. Fig. 11). Over the temperature range between T=100 and 130 K two components are discernible in the spectrum (cf Fig. 12 for 240GHz at 110K). Further decrease in temperature leaves only one, rigid limit-like component. However, the true rigid limit spectrum for the system is reached only below 50K.
Fig 12.

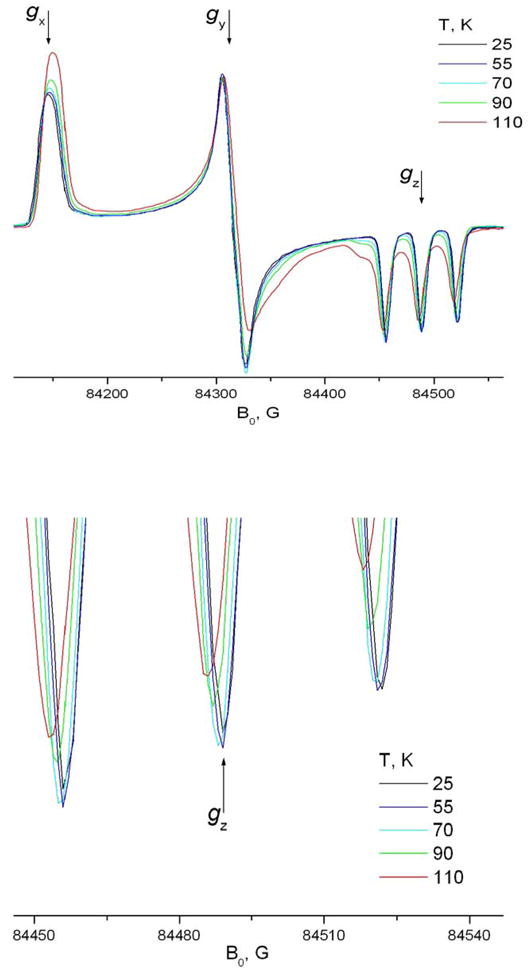
A fragment of the ESR spectrum A) 9 GHz and B) 240 GHz of TEMPOyl caprylate in β-CD demonstrates noticeable molecular motion at temperatures below 90K.
This mobility of spin-labeled molecules included into the solid phase of CDs at low temperatures is very interesting. Usually 77K in ESR spectroscopy is considered to yield the rigid limit, especially for HF ESR. Fig. 12-A shows a fragment of the 9 GHz spectrum of TEMPOyl caprylate in β-CD at temperatures below 90K. The position of the high field minimum of the spectrum clearly moves downfield above 50K, indicating motional effects. For example, between T=50K and T=77K both high field and low field extrema move towards each other approximately by 0.5G.
High field ESR is at least as sensitive in detecting molecular motion at low temperature (Fig. 12-B). High-field ESR acts as a “faster snapshot” 17,4 of molecular motion, so it is usually considered to be less sensitive than lower frequency ESR (e.g. 9 GHz) for detecting slower motions, the narrow lines in the Z-region of the HF spectrum in the nearly-rigid limit range allow unambiguous detection of small changes in their position. The 240GHz spectrum becomes sensitive to motion at R values above 4·105s−1. For 9GHz, however, molecular motion at a rate below 7.5·105 s−1 can not be reliably distinguished from the rigid limit. The values of R|| at low temperatures given in Table 3 are obtained by fixing R⊥ at 2·105s−1 and varying R|| to get the correct position for the spectral extrema in the gZ-region of the 240GHz spectrum.
The break in the Arrhenius plot (cf. Fig. 11 and above discussion) and the apparent existence of two components at 100–130K indicate changes in the mode of molecular motion at this temperature. We speculate that at this temperature rotation about the long molecular axis reduces to limited angle librations. Allowing for limitations of the Brownian diffusion model in general 13 and the model of simple axially symmetric rotation in particular, simulations of HF ESR have given acceptable fits over a wide range of temperatures above ~ 160K. The values of R|| and R⊥ are systematically increasing with temperature in accord with the activation barrier obtained. For 9 GHz, however, attempts to simulate spectra using the model of simple axial anisotropic rotation failed. If best fits for these low-quality simulations are used to obtain the diffusion coefficients R|| and R⊥ the obtained values are ~ 4–6 times slower than the values obtained from HF spectra using the same model. Besides, the values from 9GHz (given in Table 3) do not systematically change with temperature. Importantly, some spectral features, like the more complex lineshape of the high-field (mI=−1) component (cf. Fig. 9B for 9 GHz) cannot be achieved using the simple model of axial rotation. This observation gives some insight into understanding the 9GHz spectrum, and ultimately the nature of molecular motion in the system, as we explain in the next paragraph.
In general, the simulation of ESR spectra resulting from complex motional modes requires more sophisticated modeling, such as the slowly relaxing local structure (SRLS) model 28,30 and a substantial computational resource. However, there are two simple limiting cases of the SRLS model, which are very common and allow one to analyze ESR spectra using more standard and efficient software. The first limiting case is the fast internal motion (FIM) model, wherein the faster internal motion is considered to be so rapid that one just observes partial averaging of magnetic tensors; the second one is the MOMD (Microscopic Order Macroscopic Disorder) model which considers the slower mode (e.g. global tumbling of macromolecules) to be in the rigid limit. The slower motional mode in the FIM case and faster internal motion, for MOMD, are parameterized in terms of the relevant diffusion constants as well as local ordering potentials. It is shown that, in general 28, the MOMD model is a better approximation for ESR spectra obtained at high frequency, whereas, the FIM model works better at 9GHz. In multifrequency studies of spin-labeled gramicidin in aligned membranes, we justified, by an appeal to the FIM model, the use of adjusted magnetic tensor parameters at 9 GHz 12. The corresponding 170GHz spectrum, however, could be well described by the rigid-limit magnetic tensor parameters and ordering and diffusion constants fitted using the MOMD model.
As seen in Fig 13, a simulation based on the FIM model with partially averaged g- and A-tensor components at 9GHz gives a good fit for TEMPO-derivatives in β-CD. Simulations based on the model of simple axial rotation with initial tensor components yield less satisfactory fits. As one can see, the averaging includes only Y- and Z-tensor components, while the X-component does not participate in the averaging. This indicates that the fast motion occurs predominantly about the X-axis. The slower Brownian motion, as follows from diffusion constants determined from the FIM simulations, also shows the X-rotation pattern. Based on this observation, we suggest that the molecular motion in this system can be described as fast librations about the magnetic X-axis and at the same time larger angle rotations around the same axis.
Fig. 13.
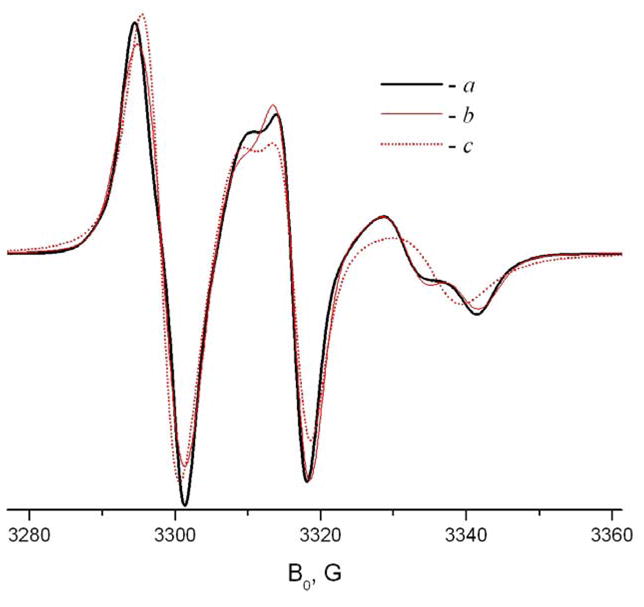
Example of FIM simulation at 9 GHz. a – TEMPOyl-palmitamide in β-CD at 293K; b - simulation using the FIM model with following parameters
gxx=2.0033, gyy=2.0048, gzz=2.0101; Axx=25, Ayy=14, Azz=5.6; R⊥ = 106s−1;R|| =1.4·107s−1; c – attempt to simulate spectrum a using initial tensor values (Table 1), R⊥ = 106s−1; R =1.6·108s−1.
Effect of Chain Length and Ester/Amide substitution
To better understand the behavior of long chain organic molecules in the solid phase of CDs we studied effects of the hydrocarbon chain length and the nature of the bond between the chain and the nitroxide ring. Fig. 14 shows both effects at 9GHz and 240GHz. As seen in the figure, an increase in the length of the hydrocarbon chain from 8 to 16 atoms does not cause any substantial changes in the ESR lineshape. On the other hand, replacement of the ester bond by an amide clearly slows down the rate of molecular motion. As we discussed above, this difference cannot be attributed to the different barriers of internal rotation for the amide and ester bonds. However, since the spin-labeled molecule rotates as a whole, transient interaction of the amide or ester group with their CD environment may affect the rotational rate. Indeed, it is known that an ester bond can form hydrogen bonds only via an acceptor mechanism, whereas the amide group forms both donor and acceptor hydrogen bonds. Also, the amide carbonyl as acceptor forms a stronger hydrogen bond than an ester carbonyl 25. Amide-to-ester substitutions have been shown to be a useful method for studying the effect of backbone hydrogen bonds on the structure of proteins 3. Although in the case of TEMPO derivatives neither ester nor amide apparently forms stable hydrogen bonds with the CD environment, some residual effects can cause the observed difference in their motional dynamics. One could expect stronger interaction with hydroxyl groups on the CD molecule and/or crystallohydrate water for the amide group, and hence a slower rate of axial rotation.
Fig 14.


Effect of the length of the hydrocarbon chain and amide – ester substitution on A) 240 GHz and B) 9 GHz spectra of TEMPO derivatives in β-CD.
Comparison of results in β- and γ-CD’s
Generally speaking, the axial patterns for β and γ-CDs for the same spin probes are similar. We assume that CD molecules trap the long hydrocarbon chains of spin probes. The constraints imposed by this trapping determine motional patterns for the whole molecule. In a sense, the hydrocarbon chain plays the role of an axis which spins in the hubs formed by CD molecules (cf. Fig 7). However, one might expect difference arising from the fact that γ-CD has a larger cavity than β-CD (i.e. 0.95 nm vs. 0.78 nm32).
For 5- and 16-sasl’s in both β and γ-CD and derivatives of TEMPO in β-CD a simple model of axial rotation gives a relatively good description of the effects observed in their HFHF ESR spectra. This motion is described by just two different diffusion coefficients R|| and R⊥ and no potential parameters were needed for semi-quantitative fitting. The more rigorous MOMD model with a high symmetrical ordering potential and higher value of R⊥, although providing somewhat better fits ((cf. Supplemental material), yields the same values for the rate of axial rotation, (see results for doxyl stearic acids above).
The X-rotation pattern for TEMPOyl caprylate included in γ-CD is very similar to the one observed in β-CD. As seen in Fig. 15, at temperatures above 240K the Z- and Y-areas of the initial rigid limit spectrum merge. Also, the X-rotation rate in γ-CD is higher than in β-CD. Already at 220K one can see a ~19G splitting of the Y-Z component, which corresponds to (Azz+Ayy)/2 value and indicative of very fast (R|| > 2·109s−1) axial rotation. However, to explain all features of the 240GHz spectrum (cf. Fig. 16) we have to use the MOMD model and assume an asymmetric potential (i.e. a rhombicity in the potential31). We speculate that due to the larger size of the γ-CD cavity the included part of the spin-labeled molecule is located on the side of the cavity causing asymmetric effects in axial rotation. Also, in contrast to β-CD, in γ-CD X-rotation abruptly stops below 220K. At this temperature a second component appears in the spectrum (see 9GHz and 240GHz). At 200K this component with a fraction of at least 0.9 corresponds to very slow motion with a rate of R⊥<R|| ~ 3·106S−1. Between 180 and 170K the spectrum converges to the rigid limit with virtually no detectable motion. This striking difference between β- and γ-CDs also most likely could be explained by the different size of their cavities. Due to the larger cavity size the spin-labeled molecule in γ-CD may take on a conformation which does not undergo fast axial rotation, while the transition in β-CD does not occur since the conformation does not fit the narrower cavity. It would, perhaps be of value to study in the future such differences in terms of free volume and/or expanded volumes models previously utilized in ESR studies of molecular motions at 9 GHz22,35.
Fig. 15.
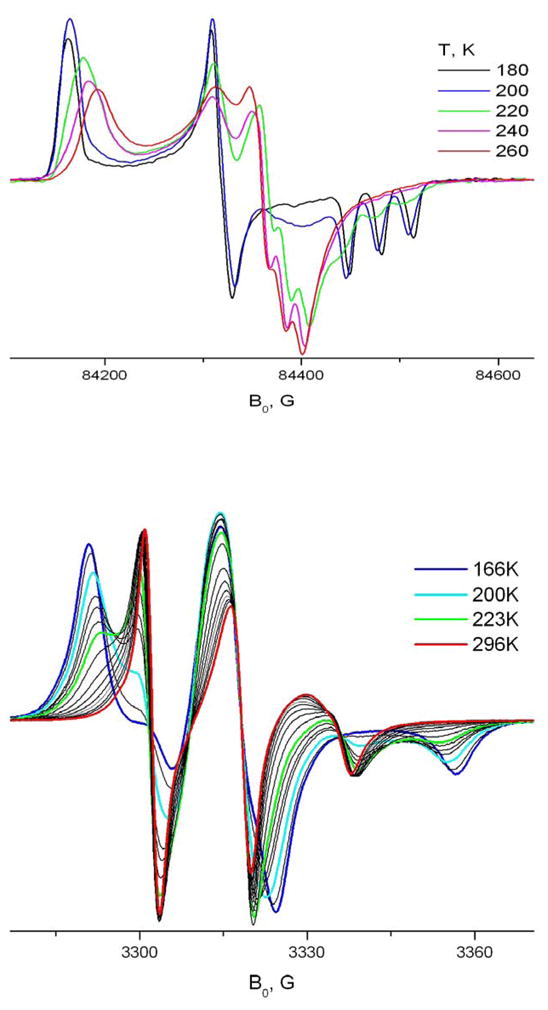
TEMPOyl caprylate in γ-CD. Temperature dependence at 240GHz and 9 GHz.
Fig. 16.

Simulation of 240 GHz ESR spectrum of TEMPOyl caprylate in γ-CD using the MOMD model. The simulation parameters using initial tensor values (Table 2) are:
R⊥ = 2·107s−1; R|| =2·109s−1, C20/C22/C40=2.0/4.4/4.4, number of orientations is 22, betad=15°
Conclusions
We studied the rotational molecular dynamics of spin-labeled derivatives of fatty acids included into the solid state of cyclodextrins using HFHF ESR and compared the results with ESR at 9GHz. HFHF ESR allowed us to demonstrate Z- and X-axial rotation and determine the relevant rotation diffusion constants and potential barriers. Such determination at 9GHz is either impossible (Z-rotation) or inaccurate (X-rotation). One of the interesting properties of the systems studied is an observable rate of molecular motion at temperatures down to 50K. Based on low potential barriers of molecular rotation we suggest that spin-labeled molecules of TEMPO derivatives have minimal interaction with their CD environment. We show how the excellent orientational resolution of HFHF ESR helps to detect and understand a number of conformational changes occurring in the system as the temperature is varied. It is found that for fatty acid ester or amide derivatives of TEMPO, an increase in the length of the hydrocarbon chain from 8 to 16 atoms does not cause any considerable changes in the ESR lineshape. On the other hand, replacement the ester bond by an amide slows down the rate of molecular motion. We attribute the difference to the difference in transient interactions between the amide and ester groups with their cyclodextrin environment.
An important feature of HFHF ESR in a system with fast anisotropic rotation of spin-labeled molecules is its visual clarity. Once motion occurs in the system, a simple inspection of HFHF spectrum indicates about which axis the motion occurs. Most ESR spectra were analyzed using simplified models: axial rotation or FIM (for 9GHz); but one case required (at 240GHz) the MOMD model with an asymmetric potential. Future studies involving simultaneous analysis of multi-frequency spectra (e.g. 9, 95, 170 and 240 GHz) will enable the use of more sophisticated SRLS approach for extracting more subtle details of the molecular motions 36. We trust that the simplicity and clarity of the ESR spectra shown in this work will serve as a benchmark for future studies by ESR of motional dynamics using HFHF.
Supplementary Material
Acknowledgments
We are grateful to Indra Devu for help in low temperature 9 GHz measurements. This work was supported by Grant Number 5P41RR016292 (at Cornell) from the National Center for Research Resources (NCRR), a component of the National Institute of Health.
References
- 1.Birrel GB, Griffith OH, French D. Journal of the American Chemical Society Comm. 1973;95:8171–8172. doi: 10.1021/ja00789a006. [DOI] [PubMed] [Google Scholar]
- 2.Birrel GB, Van SP, Griffith OH. Journal of the American Chemical Society. 1973;95:2451–2458. doi: 10.1021/ja00789a006. [DOI] [PubMed] [Google Scholar]
- 3.Blankenship JW, Balambika R, Dawson PE. Biochemistry. 2002;41:15676–15684. doi: 10.1021/bi026862p. [DOI] [PubMed] [Google Scholar]
- 4.Borbat PP, Costa-Filho AJ, Earle KA, Moscicki JK, Freed JH. Science. 2001;291:266–269. doi: 10.1126/science.291.5502.266. [DOI] [PubMed] [Google Scholar]
- 5.Bordeaux D, Laizerowicz-Bonneteau J, Brierie R, Lemaire H, Rassat A. Organic Magnetic Resonance. 1973;5:47–52. [Google Scholar]
- 6.Bortolus P, Monty S. Photochemistry in cyclodextrin cavities. In: Neckers DC, Volman DH, Bünau G, editors. Advances in Photochemistry. Vol. 21. Wiley&Sons; 1996. pp. 1–133. [Google Scholar]
- 7.Budil DE, Earle K, Freed JH. Journal of Physical Chemistry. 1993;97:1294–1303. [Google Scholar]
- 8.Budil DE, Earle KA, Lynch WB, Freed JH. Electron paramagnetic resonance at 1 mm wavelength. In: Hoff A, editor. Advanced EPR: Applications in Biology and Biochemistry. Elsevier; Amsterdam: 1989. pp. 307–340. [Google Scholar]
- 9.Budil DE, Lee S, Saxena S, Freed JH. Journal of magnetic resonance A. 1996;120:155–189. [Google Scholar]
- 10.Connors KA. Chemical Reviews. 1997;97:1325–1357. doi: 10.1021/cr960371r. [DOI] [PubMed] [Google Scholar]
- 11.Drakenberg T, Dahlqvist KI, Forsén S. The Journal of Physical Chemistry. 1972;76:2178–2183. [Google Scholar]
- 12.Dzikovski B, Earle K, Pachtchenko S, Freed JH. Journal of magnetic resonance. 2006;179:273–279. doi: 10.1016/j.jmr.2005.12.015. [DOI] [PubMed] [Google Scholar]
- 13.Earle K, Budil DE, Freed JH. Journal of Physical Chemistry. 1993;97:13289–13297. [Google Scholar]
- 14.Earle K, Dzikovski B, Hofbauer W, Moscicki JK, Freed JH. Magnetic Resonance in Chemistry. 2005;43:S256–S266. doi: 10.1002/mrc.1684. [DOI] [PubMed] [Google Scholar]
- 15.Earle K, Moscicki JK, Budil DE, Freed JH. Biophysical Journal. 1994;66:1213–1221. doi: 10.1016/S0006-3495(94)80905-1. [DOI] [PMC free article] [PubMed] [Google Scholar]
- 16.Flohr K, Paton RM, Kaiser ET. Journal of the American Chemical Society. 1975;95:1209–2118. doi: 10.1021/ja00838a041. [DOI] [PubMed] [Google Scholar]
- 17.Freed JH. The development of High Field/High Frequency ESR. Historical overview. In: Grinberg OY, Berliner LJ, editors. Very High Frequency (VHF) ESR/EPR. Biological Magnetic Resonance. Vol. 22. Kluwer; New York: 2004. pp. 19–43. [Google Scholar]
- 18.Hashimoto K, Togo H, Morihashi K, Yokoyama Y, Kikuchi O. Bulletin of the Chemical Society of Japan. 1991;64:3245–3250. [Google Scholar]
- 19.Hassner A, Alexanian V. Tetrahedron Letters. 1978;19:4475–4478. [Google Scholar]
- 20.Hedges AR. Chemical Reviews. 1998;98:2035–2044. doi: 10.1021/cr970014w. [DOI] [PubMed] [Google Scholar]
- 21.Hubbell W, McConnell H. JACS. 1971;93:314–326. doi: 10.1021/ja00731a005. [DOI] [PubMed] [Google Scholar]
- 22.Hwang JS, Rao KVS, Freed JH. The Journal of Physical Chemistry. 1976;80:1490–1501. [Google Scholar]
- 23.Karoui H, Tordo P. Tetrahedron Letters. 2004;45:1043–1045. [Google Scholar]
- 24.Keyes RS, Bobst AM. Biochemistry. 1995;34:9265–9276. doi: 10.1021/bi00028a040. [DOI] [PubMed] [Google Scholar]
- 25.Koh JT, Cornish VW, Schultz PG. Biochemistry. 1997;36:11314–11322. doi: 10.1021/bi9707685. [DOI] [PubMed] [Google Scholar]
- 26.Lee AG, Birdsall NJM, Metcalfe JC, GBW, Roberts GCK. Proceedings of the Royal Society of London Series B Biological Sciences. 1976;193:253–274. doi: 10.1098/rspb.1976.0045. [DOI] [PubMed] [Google Scholar]
- 27.Leventis N, Hanna SB, Sotiriou-Leventis C. Journal of Chemical Education. 1997;74:813–814. [Google Scholar]
- 28.Liang Z, Freed J. Journal of Physical Chemistry B. 1999;103:6384–6396. [Google Scholar]
- 29.Meirovitch E, Igner D, Igner E, Moro G, Freed JH. Journal of chemical Physics. 1982;77:3915–3938. [Google Scholar]
- 30.Polimeno A, Freed JH. Journal of Physical Chemistry. 1995;99:10995–11006. [Google Scholar]
- 31.Schneider DJ, Freed JH. Calculating slow motional magnetic resonance spectra: a user’s guide. In: Berliner LJ, Reuben J, editors. Biological Magnetic Resonance, Spin Labeling, Theory and Application. Vol. 8. Plenum Press; New York: 1989. pp. 1–76. [Google Scholar]
- 32.Szejtli J. Chemical Reviews. 1998;98:1743–1753. doi: 10.1021/cr970022c. [DOI] [PubMed] [Google Scholar]
- 33.Uekama K, Hirayama F, Irie T. Chemical Reviews. 1998;98:2045–2076. doi: 10.1021/cr970025p. [DOI] [PubMed] [Google Scholar]
- 34.Wiberg KB, Laidig KE. Journal of the American Chemical Society. 1987;109:5935–5943. [Google Scholar]
- 35.Zager SA, Freed JH. Journal of Chemical Physics. 1982;77:3360–3375. [Google Scholar]
- 36.Zhang Z, Fleissner M, Tipikin D, Earle K, Hubbell W, Freed JH. To be published. [Google Scholar]
- 37.Zivodetzki R, Levitan I. Biochimica et Biophysica acta. 2007;1768:1311–1324. doi: 10.1016/j.bbamem.2007.03.026. [DOI] [PMC free article] [PubMed] [Google Scholar]
Associated Data
This section collects any data citations, data availability statements, or supplementary materials included in this article.