Abstract
A high-order accurate shock- and interface-capturing scheme is used to simulate the collapse of a gas bubble in water. In order to better understand the damage caused by collapsing bubbles, the dynamics of the shock-induced and Rayleigh collapse of a bubble near a planar rigid surface and in a free field are analysed. Collapse times, bubble displacements, interfacial velocities and surface pressures are quantified as a function of the pressure ratio driving the collapse and of the initial bubble stand-off distance from the wall; these quantities are compared to the available theory and experiments and show good agreement with the data for both the bubble dynamics and the propagation of the shock emitted upon the collapse. Non-spherical collapse involves the formation of a re-entrant jet directed towards the wall or in the direction of propagation of the incoming shock. In shock-induced collapse, very high jet velocities can be achieved, and the finite time for shock propagation through the bubble may be non-negligible compared to the collapse time for the pressure ratios of interest. Several types of shock waves are generated during the collapse, including precursor and water-hammer shocks that arise from the re-entrant jet formation and its impact upon the distal side of the bubble, respectively. The water-hammer shock can generate very high pressures on the wall, far exceeding those from the incident shock. The potential damage to the neighbouring surface is quantified by measuring the wall pressure. The range of stand-off distances and the surface area for which amplification of the incident shock due to bubble collapse occurs is determined.
1. Introduction
Cavitation occurs in a wide range of hydraulic applications, such as turbomachinery, naval structures, biomedical ultrasound and shock wave lithotripsy, and materials processing and cleaning. The structural damage caused by bubble collapse to nearby surfaces is an important consequence of cavitation. Erosion has long been attributed to the release of shock waves upon collapse (Rayleigh 1917; Hickling & Plesset 1964). The presence of a neighbouring surface gives rise to non-spherical bubble collapse, as exemplified by the formation of a re-entrant jet directed towards the surface (Kornfeld & Suvorov 1944; Benjamin & Ellis 1966). Similarly, interactions between shock waves and gas inhomogeneities such as bubbles lead to the formation of a re-entrant jet (Haas & Sturtevant 1987; Bourne & Field 1992). The water-hammer pressure associated with the jet impact on the distal side of the bubble or directly on the solid surface has also been regarded as a potential damage mechanism (Plesset & Chapman 1971). In many applications, cloud cavitation occurs and, while the presence of many bubbles can lead to more complex dynamics including concerted collapse (Hansson, Kedrinskii & Mørch 1982; Kumar & Brennen 1991), shock waves emitted by individually collapsing bubbles can be observed.
Experiments of Rayleigh collapse have involved the use of a spark discharge (Kling & Hammitt 1972; Tomita & Shima 1986) or a laser (Lauterborn & Bolle 1975; Vogel, Lauterborn & Timm 1989) to vaporize a small volume of liquid, thus generating a cavitation bubble. Recently, high-speed photography has allowed detailed observations of cavitation bubble collapse near solid surfaces, including visualizations of the re-entrant jet formation and shock emission (Philipp & Lauterborn 1998; Lindau & Lauterborn 2003). Experimental investigations of shock-induced collapse also show the formation of a re-entrant jet in the direction of shock propagation and the emission of a shock wave upon collapse (Shima, Tomita & Takahashi 1984; Ohl & Ikink 2003; Sankin et al. 2005).
Owing to the small spatial and short time scales, precise flow measurements are difficult to perform experimentally. Numerical simulations have therefore emerged as an alternative tool to complement the analysis and experiments. Methods based on potential theory were first used to compute the collapse of a bubble near a wall (Plesset & Chapman 1971; Blake, Taib & Doherty 1986; Klaseboer et al. 2007); front-tracking was also used to study viscous effects (Popinet & Zaleski 2002). Though the initial bubble behaviour is well predicted, such methods break down in the final stages of collapse when compressibility effects become important; shock waves cannot be simulated and ‘numerical surgery’ (Best 1993) must be carried out after the jet has hit the distal side. Recent efforts have focused on developing methods capable of solving the Euler equations in order to handle shock waves and interfaces in a robust fashion. Ball et al. (2000) used a two-dimensional spatially second-order accurate free-Lagrange method (FLM) to study shock–bubble interactions based on the experiments of Bourne & Field (1992). Nourgaliev, Dinh & Theofanous (2006) employed adaptive characteristics-based matching, Hu et al. (2006) used a level set method with corrections to account for conservation losses and Chang & Liou (2007) implemented a volume fraction formulation in the AUSM+-up methodology to study two-dimensional shock–bubble interactions. Rayleigh collapse was considered by Nagrath et al. (2006), who combined finite element and level set methods to simulate the three-dimensional collapse of a spherical bubble. Jamaluddin, Ball & Leighton (2005) and Turangan et al. (2008) used FLM and Johnsen & Colonius (2008) employed a high-order accurate quasi-conservative scheme to study axisymmetric shock-induced bubble collapse in shock wave lithotripsy, in which focused shock waves are used to pulverize kidney stones.
In order to better understand cavitation damage, the dynamics and potential damage of non-spherical bubble collapse are studied and characterized. The present article reports on numerical simulations of shock-induced and Rayleigh collapse of a gas bubble in a free field and near a planar rigid surface. In particular, the shock structure upon collapse and the effect of the finite propagation speed of the shock in water are investigated; collapse properties are quantified, and comparisons of the present results with theory and experiments are emphasized. The current methodology is introduced in § 2, including a description of the problems under consideration and a presentation of the computational model and method. The evolution of the bubble during collapse is examined in § 3. Then, the bubble behaviour at collapse is studied in § 4 by computing certain bubble properties at collapse. The emission and propagation of the shock generated at collapse are investigated and wall pressures are reported in § 5. Quantitative comparisons of the results from the present shock-induced collapse simulations with the experiments of Shima et al. (1984) are then provided in § 6. Finally, the article ends with some concluding remarks and an outlook for further studies.
2. Methodology
2.1. Problem description
In the present work, shock-induced and Rayleigh collapse of a gas bubble are studied. In the former, a shock wave propagates over the bubble so that the pressure across the shock drives the collapse; examples of this phenomenon include interactions of shock waves produced in shock wave lithotripsy and underwater explosions with pre-existing bubbles. In the present work, the latter denotes the collapse driven by the ratio between the pressure of the water (usually atmospheric pressure) and that of the bubble (approximately vapour pressure); this problem is the archetype of cavitation bubble collapse and occurs in most cavitation applications. Historically, Rayleigh collapse refers to the spherically symmetric collapse of an empty cavity in an infinite sea of incompressible and irrotational liquid (Rayleigh 1917). In the present work, this problem is generalized to the collapse of a gas bubble whose pressure is initially smaller than the uniform pressure of the surroundings, in order to distinguish it from the asymmetric shock-induced collapse. In experiments (e.g. Vogel et al. 1989), this generalized Rayleigh collapse starts when the bubble achieves its maximum radius. The limiting case of shock-induced collapse for which the shock speed in the liquid is infinite corresponds to a Rayleigh collapse. This third problem is equivalent to raising the pressure of the water by a specific amount, while keeping the bubble pressure at atmospheric value; it is thus a generalization of the first problem for which the pressure ratio can be made arbitrary and for which the bubble pressure is atmospheric. These three problems are considered in two different geometries: free-field collapse and collapse near a planar rigid wall. In the present work, the bubbles contain only non-condensable gas; the dynamics of cavitation (vapour) bubbles, at least in the case of Rayleigh collapse, are quantitatively different from those of gas bubbles in the final stages of collapse, as discussed in § 5.3.
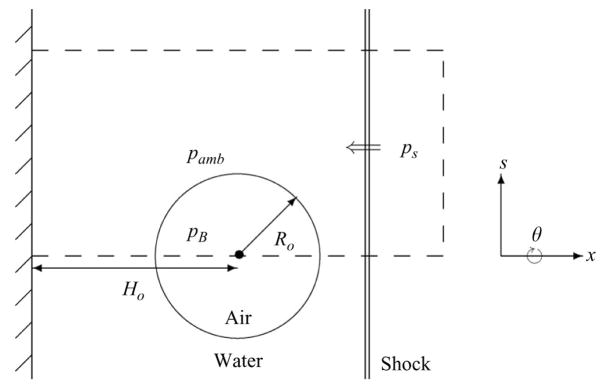
The problem set-up is similar to that of Johnsen & Colonius (2008). A slice through the centre of the domain is shown in figure 1. The domain consists of a cylinder, along whose centreline a spherical bubble of radius Ro is located. When the collapse takes place near a wall, the initial stand-off distance is denoted Ho. The wall is assumed to have infinite impedance, so that all waves are completely reflected with no losses. In reality, solids have a finite impedance; the implications of this assumption is further discussed in § 6. When the collapse is non-spherical, the radius, R(t), is an average value calculated from the bubble volume as defined in (3.1), and the stand-off distance, H (t), denotes the position of the bubble centroid. In the present simulations of shock-induced collapse, the incoming shock wave consists of a step change in pressure of constant amplitude with zero rise time and infinite width. The only exception lies in the results presented in § 6, in which the shock is immediately followed by an expansion; this latter pressure waveform is representative of the experiments of interest (Shima et al. 1984), but introduces an additional parameter to the problem, namely the size of the bubble relative to the width of the waveform, which affects the bubble dynamics (Johnsen & Colonius 2008). The shock is initialized inside the domain, travels from right to left, and impinges the wall normally. Thus, the problems of interest are axisymmetric, so that they can be reduced from three spatial dimensions to cylindrical coordinates with azimuthal symmetry. In the set-up shown in figure 1, the proximal side always denotes the right side of the bubble (i.e. near shock), and the distal side always denotes the left side of the bubble (i.e. near wall). The pressure in three regions is specified: the bubble pressure, pB, the ambient pressure, pamb, and the shock pressure, ps. The pressure ratio driving the collapse is denoted ps/po, where po is the relevant pressure ahead of the compression. In the present simulations, the bubble pressure has atmospheric value (pB = patm), so that po = pB = patm; for Rayleigh collapse (the third problem of interest described in the previous paragraph): pamb = ps.
Figure 1.
Schematic of the problem geometry (not to scale). The dashed line indicates the computational domain, which is a cylinder revolved about the axis s = 0. In the case of collapse near a wall, the left boundary of the domain consists of a rigid wall (solid hatched line), and the double line on the right of the bubble denotes a shock.
2.2. Equations of motion
The bubble consists of an ideal gas (air) and the liquid (water) obeys an appropriate equation of state. The dynamics of the gas and liquid phases are modelled using compressible multicomponent flows, a subset of multiphase flows in which the different fluid components are assumed immiscible. Diffusion, surface tension and phase change are not expected to affect the bubble dynamics over the major part of the collapse and are therefore ignored; a justification for these assumptions is provided in § 4.3. In addition, body forces are ignored. The resulting adiabatic and inviscid flows are governed by the unsteady Euler equations, written here in conservative form,
| (2.1) |
where ρ is the density, u is the velocity vector, p is the pressure, E is the total energy and I is the identity tensor. Here, q is the vector of conserved variables and f is the flux vector. In the present simulations, cylindrical coordinates with azimuthal symmetry are used. The stiffened equation of state (Harlow & Amsden 1971),
| (2.2) |
is used to close the Euler equations. For gases, γ is the ratio of specific heats (γ= 1.4 for air) and B = 0. For water, γ is a constant similar to the exponent of density in the Tait equation of state and B is the stiffness of the liquid; both constants are determined based on the shock Mach number (Cocchi, Saurel & Loraud 1996). Since the shock Mach numbers corresponding to the pressure ratios of interest are close to unity in water (1.005 ≤ Ms ≤ 1.050), the limit Ms →1 is taken, so that constant values of γ = 6.68 and B = 4050 atm are employed in all the simulations. In the derivation of (2.2), Cocchi et al. (1996) use the following density and sound speed of water: ρL = 998 kg m−3 and cL = 1647 m s−1.
Since the fluid components are assumed immiscible, interfaces are represented by a discontinuity in the fluid composition characterized by γ and B. Mass transfer is neglected, so that interfaces between the two fluid components are advected by the flow. Thus, the functions φ = (1/(γ−1), γB/(γ−1))T obey the advection equation,
| (2.3) |
These particular functions of γ and B must be advected in order to prevent spurious pressure oscillations at interfaces (Shyue 1998).
The ambient density and sound speed of the water, ρL and cL, along with the initial bubble radius, Ro, are used to non-dimensionalize the variables. From the equations of motion and the problem description, the following non-dimensional groups can be formed: Ho/Ro, ps/po, po/B, ρG/ρL, γG and γL. The subscripts L and G denote water and air, respectively. Water and air are used, so that the density ratio, γG, γL and B ≫ po are constant. Therefore, two non-dimensional numbers govern the problems under consideration: (i) the pressure driving the collapse, ps/po, and (ii) the initial stand-off distance from the wall, Ho/Ro. The dependence of the problems on the pressure ratio is investigated by varying it in the range, 34 ≤ps/po ≤ 710. The lower bound corresponds to the pressure ratio driving the collapse of a cavitation bubble (patm/pv ≈ 34, where pv is the vapour pressure). A pressure ratio of 353 corresponds to shock wave lithotripsy conditions and the upper bound is representative of that driving the collapse of a bubble located in the vicinity of an underwater explosion (Cole 1948). Based on preliminary tests, the effect of the wall on the results is minor for initial stand-off distances greater than five initial radii. Thus, the range, 1.05 ≤Ho/Ro ≤ 5, is considered.
2.3. Interface-capturing WENO scheme
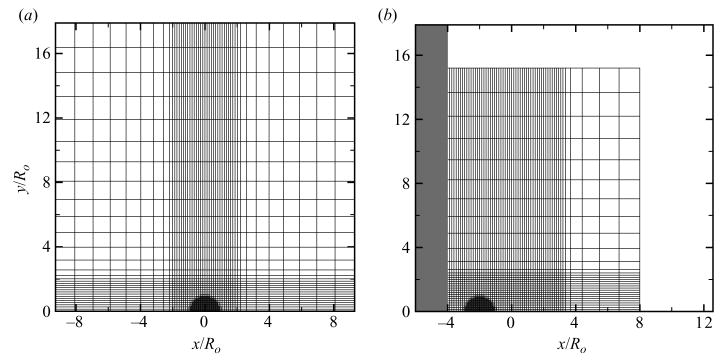
In order to achieve high-order accuracy in smooth regions, enforce discrete conservation of total mass, momentum and energy, and prevent oscillations at discontinuities, Johnsen & Colonius (2006) extended the quasi-conservative interface-capturing formulation of Abgrall (1996) by implementing a high-order accurate weighted essentially non-oscillatory (WENO) reconstruction and the Harten, Lax and van Leer solver with contact restoration (HLLC). A third-order accurate total variation diminishing Runge–Kutta scheme (Gottlieb & Shu 1998) is employed to march the equations forward in time. The spatial discretization consists of a fifth-order accurate finite volume WENO scheme (Shu 1997), in which the averaged primitive variables are reconstructed to preserve the interface conditions, and of the HLLC solver (Toro, Spruce & Speares 1994), which was modified so that it could solve advection equations. In order to simulate axisymmetric bubble collapse, the method of Johnsen & Colonius (2006) was extended to cylindrical coordinates with azimuthal symmetry and to non-uniform grids (Johnsen 2007). The computational domain is shown in figure 2. The rigid wall is aligned with the grid and modelled using a centreline approach in which the flux vectors are mirrored about the wall. Non-reflecting boundary conditions (Thompson 1990) are implemented along the top and right edges of the computational domain. Grids of 960 × 600 (for free-field Rayleigh collapse) and 1200 × 600 (for all the other cases) are used; results with Δxmin = 6.67 × 10⁻³ are reported in the present work, except for the results of § 6, where Δxmin = 1.67 × 10⁻². A fine mesh is used near the bubble and in the areas of interest; the grid is stretched in order to make the domain large enough to prevent spurious waves generated at the non-reflecting boundaries from propagating back to the region of interest and contaminating the solution. Verification of the numerical method was carried out by Johnsen & Colonius (2006), while validation is provided throughout the present study using comparisons to experiments.
Figure 2.
Computational mesh One in twenty points is shown and the bubble is denoted by the half-disk in the refined area. (a) free-field Rayleigh collapse; (b) shock-induced collapse near a wall. The wall is denoted by the solid region on the left of the domain.
The numerical solution to the multidimensional Euler equations in which shock waves interact with interfaces may exhibit ill-posed features. In particular, Samtaney & Pullin (1996) showed that the solution to the interaction between a shock wave and a vortex sheet does not necessarily converge in a pointwise or weak sense. As discussed in Niederhaus et al. (2008), irregularities due to the discretization of the initial conditions introduce a cut-off wavenumber for the Kelvin–Helmholtz instability so that the solution does not continuously depend on the initial conditions. In the limit of infinite resolution, the wavenumber of these perturbations tends to infinity, thus leading to exponential growth characteristic of the Hadamard instability (Joseph 1989). Such instabilities are not observed in nature because of the regularizing properties of viscosity, surface tension and other diffusive processes; though these effects are neglected in the present work, both the shock and interface capturing introduce numerical dissipation at discontinuities, thereby regularizing the problem. Because of the complexity of the numerical schemes, the extent to which such artificial dissipation mechanisms act as physical diffusion is unknown. Such instabilities may be further lessened by initially smoothing interfaces over a few grid points (Niederhaus et al. 2008); in the present case, the interface is initially smeared over approximately four cells.
In the present simulations, these Hadamard instabilities are evident only in the case of symmetric free-field Rayleigh collapse. Later during spherically symmetric collapse, instabilities occur at the grid scale with a pattern that highlights the underlying Cartesian grid. For non-spherical collapse (i.e. for collapse induced by a shock wave or taking place near a rigid boundary), such instabilities are not observed because the bubble does not achieve as small a size as in spherical collapse. This drawback may be improved by using adaptive mesh refinement. Figure 3 shows the history of the bubble volume for free-field Rayleigh collapse (ps/po = 353) at different resolutions until the bubble reaches Vmin. As the number of grid points is increased, the bubble volume appears to be converging in a global sense. Though convergence is not completely achieved, the present computations constitute the best possible effort based on the current computing power to obtain solutions that can be used to carry out a parametric study.
Figure 3.
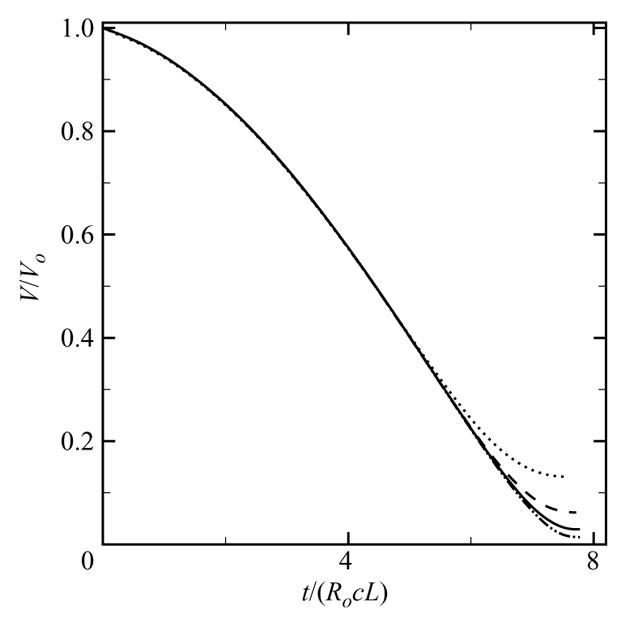
History of the bubble volume for free-field Rayleigh collapse (ps/po = 353) using different resolutions (dotted line: Δxmin = 5.33 × 10⁻²; dashed line: Δxmin = 2.67 × 10⁻²; solid line: Δxmin = 1.33 × 10⁻²; dashed-dotted line: Δxmin = 6.67 × 10⁻³).
3. Evolution of the collapsing bubble
3.1. Qualitative bubble behaviour
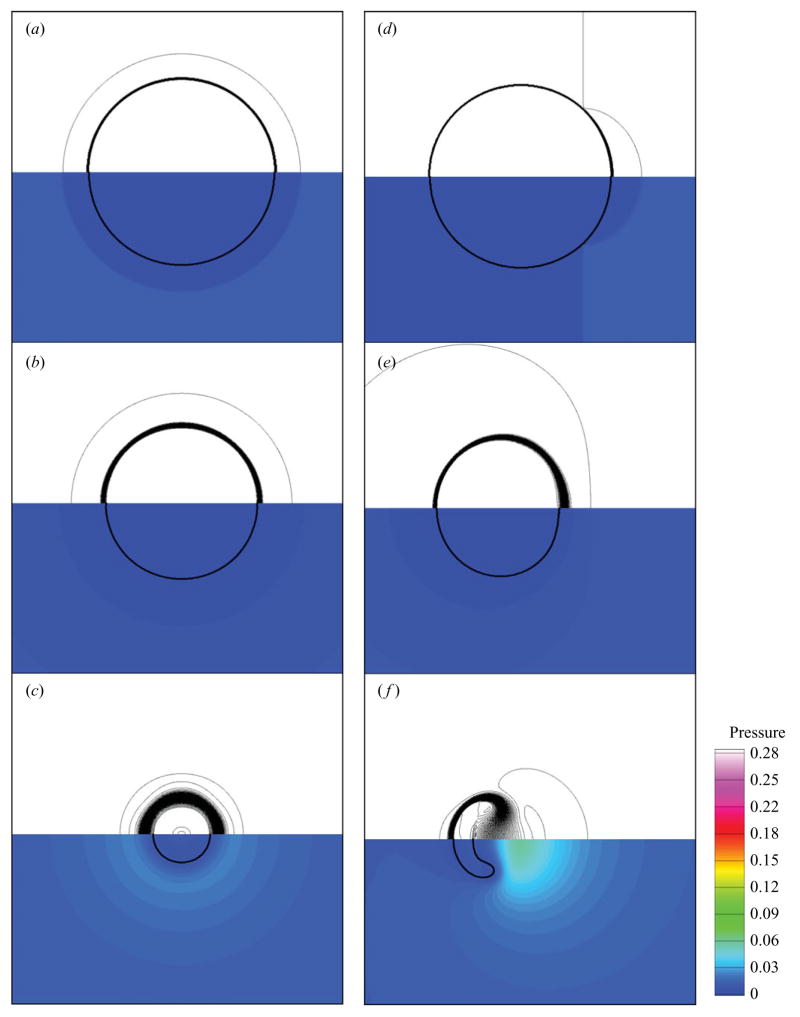
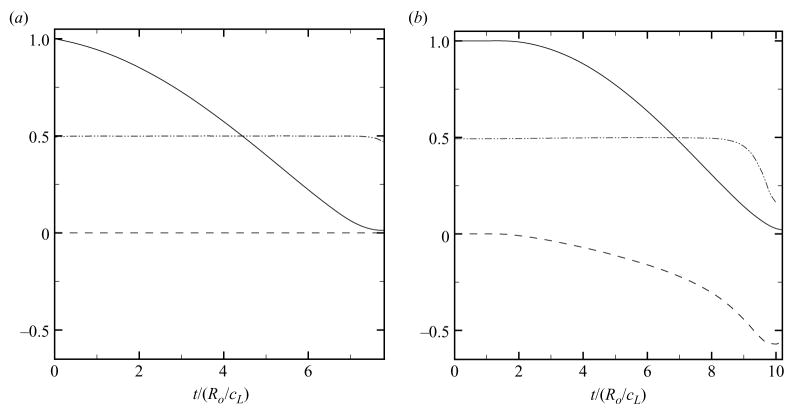
The dynamics of free-field shock-induced and Rayleigh collapse differ significantly, in that the former is an asymmetric phenomenon, while the latter is spherically symmetric. To highlight the differences in the qualitative behaviour of these two types of collapse in a free field, figure 4 shows density lines and pressure contours, and figure 5 shows the history of the bubble volume, VB, of the bubble non-sphericity and of the displacement of the bubble centroid, XB − Xo, from the initial location of its centroid, Xo. The approximate location of the interface is given by the contour γ= 1.42, so that the volume fraction of air can be computed from the field, and ps/po = 353. The bubble volume is calculated by summing the volume of air in each computational cell. Then, the bubble radius is defined as:
| (3.1) |
Figure 4.
Evolution of free-field collapse (ps/po = 353): (a) Rayleigh collapse at times (a) t/(Ro/cL) = 0.265, (b) t/(Ro/cL) = 3.98, (c) t/(Ro/cL) = 6.98 and (b) shock-induced collapse at times (d) t/(Ro/cL) = 0.280, (e) t/(Ro/cL) = 5.79, (f) t/(Ro/cL) = 8.02. Top: density lines; bottom: pressure contours non-dimensionalized by (approximate interface location: γ = 1.42 contour).
Figure 5.
(a) Rayleigh collapse and (b) shock-induced collapse. History of the normalized bubble volume, VB/Vo (solid line), non-sphericity (dashed-dotted line) and displacement, (XB − Xo)/Ro (dashed line), until collapse for free-field conditions (ps/po = 353).
A quantitative measure of the bubble non-sphericity is given by the ratio of the projected bubble area to the length of the perimeter and normalized by the average radius; a value of 0.5 corresponds to a spherical collapse, while a value of zero implies that the interface has greatly deformed.
In Rayleigh collapse, the problem is started by instantaneously raising the liquid pressure, thus leading to a Riemann problem across the interface; a shock converges within the bubble, while an expansion propagates outwards. Thereafter, the volume monotonically decreases until collapse. During this process, the velocity of the bubble wall increases, leading to a pressure rise in the liquid near the bubble. By symmetry, the displacement is zero and the bubble collapses spherically. In the last stages of collapse, the shape does not remain spherical due to grid-dependent features, as described in § 2.3. In shock-induced collapse, the bubble starts to deform when the shock hits it. As the shock interacts with the bubble, the shock is partially reflected as an expansion wave and transmitted into the bubble as a weak shock. Then, as the bubble starts to collapse, its proximal side flattens, thus leading to the motion of its centroid in the direction of propagation of the shock. As the bubble collapses further, its proximal side involutes to form a re-entrant jet. Finally, later in the collapse, the bubble shape becomes highly non-spherical.
Theory and experiments have shown that a bubble collapsing near a rigid wall migrates towards it (Benjamin & Ellis 1966; Plesset & Chapman 1971). Rayleigh collapse near a wall is considered to provide a comparison of the history of the bubble displacement with the experiments of Vogel et al. (1989) in figure 6. Because the bubble pressure is initially assigned atmospheric value in the simulations, a factor of is used to scale time. The behaviour of the bubble is well captured until collapse (τc ≈ 0.2 ms). It is noted that the pressure distribution in the liquid when the bubble achieves its maximum volume is not exactly uniform in the experiments due to the proximity of the wall during the growth; this effect is evidently minor for this value of Ho/Ro = 2.15. Early in the collapse, the bubble migrates slowly towards the wall. Then, its motion progressively accelerates during the collapse. At collapse, the bubble has migrated by a significant amount towards the wall. The impact of the jet on the distal side further accelerates the bubble. The present results diverge from the experimental results thereafter because of the different bubble contents in the experiments (vapour) and in the simulations (gas), thus leading to a different behaviour at collapse, as explained at the end of § 5.3, and during rebound.
Figure 6.
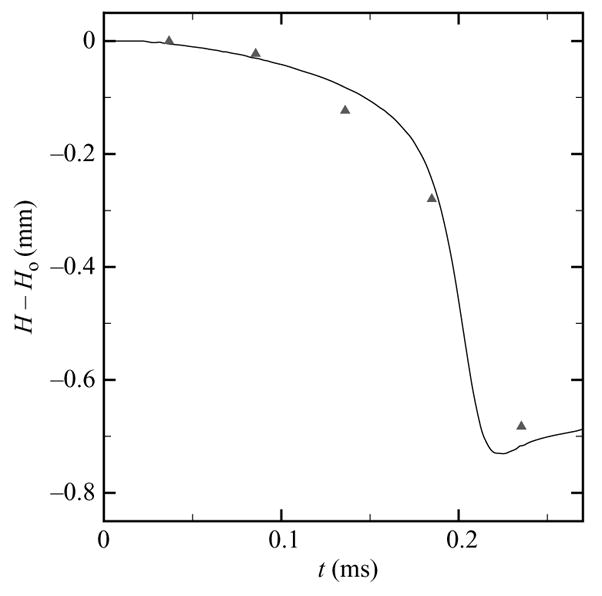
History of the bubble displacement for Rayleigh collapse near a wall with Ho/Ro = 2.15. Solid line: simulations; triangles: experiments by Vogel et al. (1989).
3.2. Initial stages of collapse
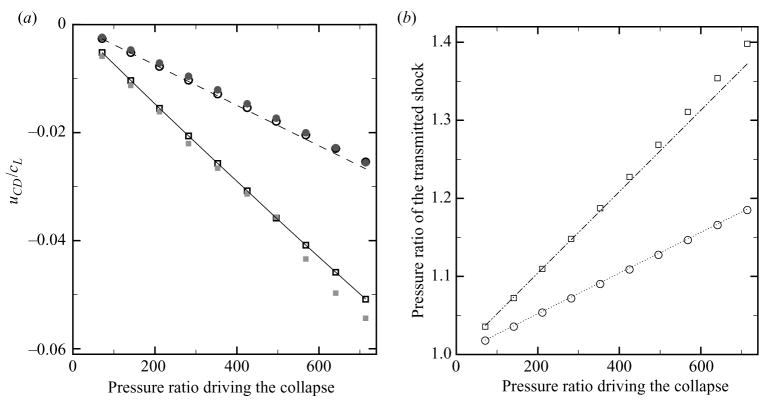
In the present compressible formulation, instantaneously increasing the liquid pressure leads to a gas–liquid Riemann problem across the interface. In the limit of small time, this problem reduces approximately to a one-dimensional planar problem. Similarly, when the shock wave intersects the bubble in shock-induced collapse, the conditions along the centreline (s = 0) are those of a Riemann problem across the interface; for interface points off-axis, the problem is fully multidimensional. As a result of such initial conditions, an expansion wave propagates outwards in the liquid, while a shock wave converges within the bubble. Figure 7 shows the initial velocity of the interface and the pressure ratio of the transmitted shock as a function of the initial pressure ratio across the interface for Rayleigh collapse and across the shock for shock-induced collapse. Results from the simulations and from the corresponding one-dimensional Riemann problems are included. The interface velocity is the impulsive velocity measured initially in Rayleigh collapse and just after the shock hits the interface in shock-induced collapse in the simulations, and corresponds to the velocity of the contact discontinuity in the Riemann problems. When considering the compressible Rayleigh–Plesset equation, Plesset (1969) used the following initial condition:
| (3.2) |
which is in fact a linearization of the normal shock relation for velocity. In the case of shock-induced collapse, the initial velocity can be estimated by considering the reflection of a weak discontinuity off an interface separating two fluids whose ratio of acoustic impedances is large (see § 4.8 and § 4.9 in Thompson 1984),
Figure 7.
Initial interface velocity, and pressure ratio across the transmitted shock as a function of the pressure ratio driving the collapse for shock-induced (squares) and Rayleigh (circles) collapse. The open symbols denote the analytical solution to the corresponding planar Riemann problem and the filled symbols refer to the simulations. (a) Initial interface velocity. Dashed line: (3.2); solid line: (3.3). (b) Pressure ratio across the transmitted shock. Dotted line: 1 + αz; dashed-dotted line: 1 + 2αz.
| (3.3) |
where up is the particle velocity behind the incoming shock. This expression is valid for the interaction of a shock with an interface between two fluids whose impedance ratio is large and in which the shock is propagating in the fluid with the higher impedance.
The agreement between the simulation and the exact solution to the one-dimensional Riemann problem is good, though there are deviations in the shock-induced collapse results for large pressure ratio; these deviations may be due to the fact that the data is sampled only at discrete times. For a given pressure ratio, the interface velocity in the shock-induced collapse is approximately twice the particle speed behind the shock, as expected from (3.3). The strength of the transmitted shock along s = 0 just after refraction can be evaluated by solving the one-dimensional Riemann problem. Then, the pressure ratio across the transmitted shock can be calculated. Given that the pressure ratio across the transmitted shock in Rayleigh collapse is 1 + αz, where z is the initial pressure ratio across the interface and α ≈ 2.6 × 10⁻⁴ is a constant, the pressure ratio across the transmitted shock in shock-induced collapse agrees with the 1 + 2αz line for small pressure ratios, as expected from the linearized shock relations, and diverges as the pressure ratio driving the collapse is increased. As the bubble collapses, the behaviour deviates from that of the planar problem and focusing takes place, so that the velocity of the interface increases. As a result of focusing, the strength of the shock propagating within the bubble increases.
3.3. Interface velocity
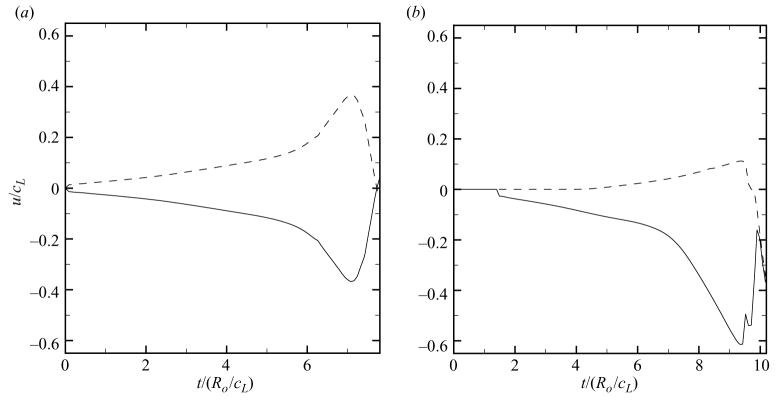
In order to better understand the local details of the collapse, figure 8 depicts the velocity of the jet vj and of the distal side vd for free-field shock-induced and Rayleigh collapse until the bubble reaches its minimum volume. Because of the symmetry of Rayleigh collapse, the velocity of the distal side is the opposite of that of the proximal side. The interface first follows a slow collapse before achieving a larger acceleration at t/(Ro/cL) ≈6. The maximum interfacial velocity occurs slightly before the minimum volume is achieved; the bubble wall then decelerates before the bubble reaches the maximum compression. In the case of shock-induced collapse, the proximal side is first impacted by the shock and therefore contracts first. The external shock then diffracts around the bubble and, upon intersection with the axis, prompts the distal side to contract. Since the speed of sound is higher in water than in air, the external shock reaches the end of the bubble before the internal (transmitted) shock does, and, because of the misalignment of the pressure and density ratios, baroclinic vorticity is deposited along the bubble interface. As shown in table 1, the time taken by the external shock to diffract around the bubble does not vary significantly with the pressure ratio across the shock, because the range of shock Mach numbers considered in the present work is close to unity. However, the time taken by the transmitted shock to reach the distal side depends strongly on the pressure ratio across the shock. Comparing these times to the collapse times in § 4.1, it is observed that for a low value of ps/po the internal shock will have time to reflect several times within the bubble. On the other hand, for the higher values of ps/po, the minimum volume is achieved shortly after the internal shock has reached the distal side. The velocity of the proximal side follows a behaviour similar to that of Rayleigh collapse; however, it achieves a higher velocity because the distal side is not there yet to arrest its motion. This is due to the fact that it takes a finite amount of time for the external (diffracting) shock to propagate around the bubble, thus delaying the contraction of the distal side. These observations emphasize the transient and non-symmetric nature of shock-induced collapse.
Figure 8.
History of the velocity of the jet (solid line) and of the distal side (dashed line) for free-field collapse (ps/po = 353). (a) Rayleigh collapse and (b) shock-induced collapse.
Table 1.
Time taken by the external and internal shocks to reach the distal side of the bubble.
| Pressure ratio | 71 | 141 | 211 | 353 | 568 | 641 |
| External shock | 2.72 | 2.68 | 2.64 | 2.57 | 2.54 | 2.53 |
| Internal shock | 7.94 | 7.69 | 7.43 | 6.68 | 6.43 | 5.78 |
As illustrated in figure 4, the pressure in the liquid near the interface becomes higher than the pressure at infinity over some interval during collapse. This phenomenon can be understood by considering the momentum equation in the liquid for a spherical bubble obeying the Rayleigh–Plesset equation:
| (3.4) |
where r denotes the radial coordinate. Under adiabatic conditions, the pressure at the bubble wall is pB = po(Ro/R)3γ and dominates (3.4) in the last stages of collapse, while the pressure tends to p∞ far away from the bubble. To better understand what happens in the region in-between, figure 9 shows the pressure as a function of distance using (3.4) and the Rayleigh–Plesset equation at different times for Rayleigh collapse with ps/po = 353. At early times, the pressure monotonically increases from the low initial bubble pressure to p∞. As the bubble collapses, the interfacial velocity and bubble pressure increase, so that, as a consequence, the liquid pressure rises and eventually exceeds p∞. This maximum pressure in the liquid is also observed when liquid compressibility is included into the model (Hickling & Plesset 1964; Fujikawa & Akamatsu 1980). Though the present analysis cannot directly be extended to non-spherical collapse, it may be argued that the high pressure in the liquid behind the jet is due to the local velocity increase; thus, this high pressure is not a cause for jet formation, but a consequence of the acceleration of the bubble wall. This conclusion follows from the fact that, for spherical bubble dynamics based on the Rayleigh–Plesset equation, the radius is only a function of the bubble pressure and the pressure at infinity, and does not depend on the details of the flow field in-between. This analysis is contrary to some earlier studies that postulated that the high pressure in the liquid just behind the interface was driving the re-entrant jet formation (Best & Kucera 1992).
Figure 9.
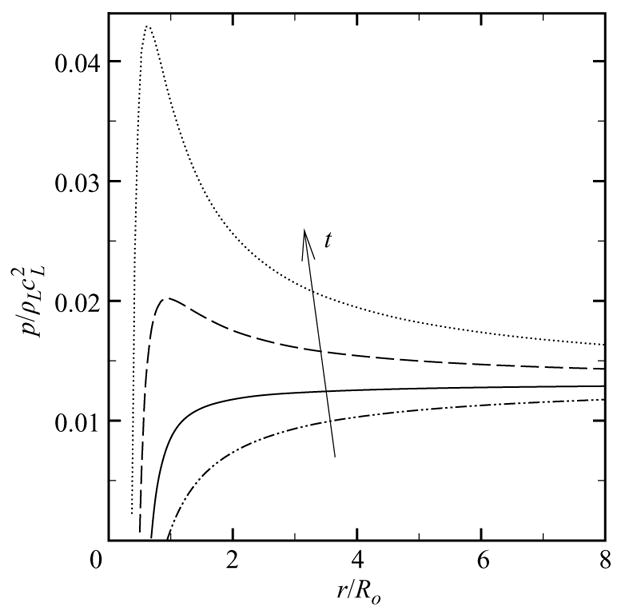
Pressure in the liquid as a function of distance at different times using (3.4) for Rayleigh collapse (ps/po = 353). Dashed-dotted line: t/(Ro/cL) = 2.88; solid line: t/(Ro/cL) = 6.17; dashed line: t/(Ro/cL) = 7.19; dotted line: t/(Ro/cL) = 7.60.
4. Bubble properties at collapse
4.1. Collapse time
The collapse time of a bubble depends on the pressure ratio driving the collapse. For the spherical collapse of a cavitation bubble, the Rayleigh collapse time may be estimated (Brennen 1995):
| (4.1) |
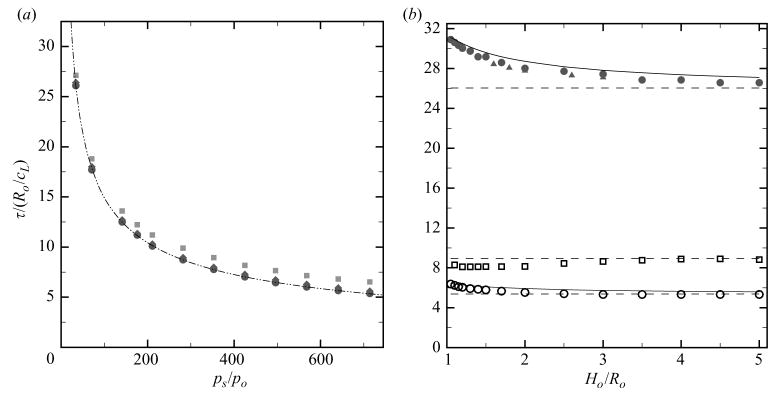
Figure 10 shows the collapse time as a function of the pressure ratio for free-field collapse and as a function of the initial stand-off distance for collapse near a wall. In the latter plot, the top data set corresponds to cavitation conditions (ps/po = 34), while the bottom set relates conditions representative of shock wave lithotripsy (ps/po = 353 for shock-induced collapse, ps/po = 714 for Rayleigh collapse); the experiments of Vogel, Lauterborn & Timm (1988) and the model of Rattray (1951), which is a first-order correction for (non-spherical) Rayleigh collapse near a wall,
Figure 10.
Collapse time for shock-induced (squares) and Rayleigh (circles) collapse. (a) Free-field collapse. Diamonds: solution from the Rayleigh–Plesset equation for spherical collapse; dashed-dotted line: . (b) Collapse near a wall. Triangles: experiments by Lindau & Lauterborn (2003); solid line: τr; dashed line: τc. The filled symbols denote cavitation conditions (ps/po = 34) and the open symbols indicate shock wave lithotripsy conditions (shock-induced collapse: ps/po = 353; Rayleigh collapse: ps/po = 714).
| (4.2) |
are also included. From a series of high-speed photographs, Vogel et al. (1988) calculate a prolongation factor, k1, that depends on the initial stand-off distance and ranges between 1 and 1.3. Thus, for the bubble collapse near a wall, t12 = 2τck1, where t12 is the time between the generation of the bubble and the collapse, which is determined by measuring the time between the acoustic signal of each event. The experimental collapse time is computed by using the tabulated data in Lindau & Lauterborn (2003). Because the bubble pressure is initially assigned atmospheric value in the simulations, a scaling factor of is used for the experimental Rayleigh collapse under cavitation conditions. The time origin in shock-induced collapse is taken as the time when the shock first hits the bubble. Since the bubble volume is not always spherical in the simulations, the minimum volume determines the collapse time.
In free-field collapse, the present Rayleigh collapse results agree with the spherical collapse time to within a few per cents and follow a trend. The collapse time for shock-induced collapse is approximately one time unit greater than that of the corresponding Rayleigh collapse. This effect accounts for the time taken by the shock wave to propagate over the span of the bubble; if the collapse time is taken as the average between the collapse time when the shock first hits the bubble and that when the shock ends its diffraction about the bubble, the collapse time of Rayleigh collapse and shock-induced collapse are approximately equal. For a high pressure ratio, the delay in shock-induced collapse is of the same order as the collapse time, thus emphasizing that the time taken by the shock to propagate over the bubble may not be negligible.
The presence of a wall retards the flow of liquid filling the void created by the collapsing bubble, so that the overall collapse is slower, and is communicated to the bubble by the reflection of the expansion wave released by the initial Riemann problem. Consequently, the pressure driving the collapse is reduced locally as the expansion propagates over the bubble, thus leading to a longer collapse time. This phenomenon would also occur in incompressible simulations, in which the effect is felt instantaneously due to the effective infinite speed of propagation of the wave. The present results of Rayleigh collapse near a wall agree with the experiments of Vogel et al. (1988) under cavitation conditions to within 1 % difference, despite the fact that the bubble is filled with non-condensable gas in the simulations; the model of Rattray (1951) overpredicts the results. In shock-induced collapse, shock reflection off the wall results in pressure doubling, so that the effective pressure ratio driving the collapse is the same as for Rayleigh collapse with ps/po = 714. Close to the wall, the pressure doubles almost instantaneously, so that the delay between shock-induced and Rayleigh collapse near a wall is of approximately two time units, in agreement with the results observed in free-field collapse (one time unit accounts for the shock propagating over a bubble diameter). For large Ho/Ro, after first impacting the bubble, the shock must travel twice the stand-off distance before interacting with the bubble again, at which point the bubble has already started its collapse due to the initial compression caused by the incoming shock. The pressure doubling thus only affects a small portion of the collapse. Therefore, as the initial stand-off distance increases, the collapse time tends to that of free-field shock-induced collapse with ps/po = 353. Since the shock Mach number is close to unity, the collapse of bubbles farther away than Ho/Ro ≈ 4.5 are unaffected by pressure doubling. This analysis shows that the time taken by the shock to propagate through the bubble is not negligible compared to the collapse time and that the bubble dynamics are sensitive to the transient nature of shock–bubble interaction.
4.2. Maximum jet velocity
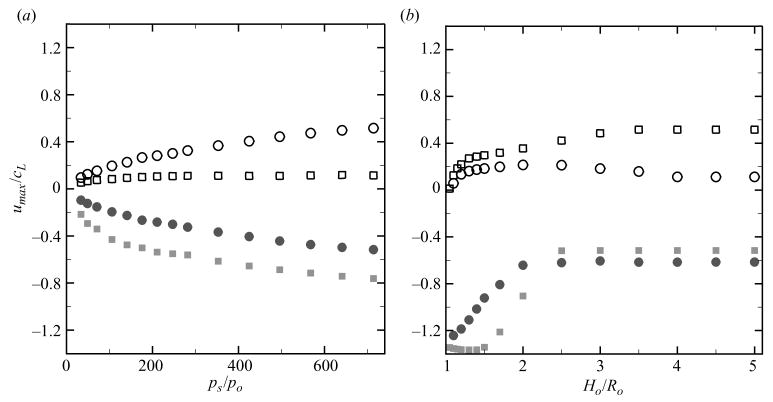
The maximum jet velocity, vj, is an important quantity in non-spherical bubble collapse. As described in § 5.1, when the jet hits the distal side, which moves at some velocity vd, a water-hammer pressure with significant potential for damage is generated. In the present study, the maximum jet velocity is independent of the initial bubble radius because the shock has no length scale; if the shock had a finite width (e.g. as in shock wave lithotripsy), the jet velocity and other bubble properties would depend on the relative size of the bubble compared to the pulse (see § 6 and Johnsen & Colonius 2008). Figure 11 shows the maximum velocity of the jet and distal side for shock-induced and Rayleigh collapse in a free field and near a wall.
Figure 11.
Maximum interfacial velocity for Rayleigh (circle) and shock-induced (square) collapse. The open symbols denote the distal side and the filled symbols refer to the jet: (a) free-field collapse; (b) collapse near a wall. Shock-induced collapse: ps/po = 353; Rayleigh collapse: ps/po = 714.
In free-field Rayleigh collapse, there is no jetting. As expected, the velocity of the proximal (jet) and distal sides increases with the initial pressure ratio, and vj = − vd by symmetry. In free-field shock-induced collapse, |vj | ≥ |vd | and high jet velocities are achieved: for pressure ratios representative of shock wave lithotripsy, vj ≈ 1000 m s−1. The velocity difference is used in the calculation of the water-hammer pressure (§ 5.1). The maximum jet velocity is observed one time unit approximately (for all pressure ratios) before the minimum volume is reached because of the finite time taken by the jet to decelerate as it is about to impact the distal side.
When a wall is present, the velocities (jet and distal side) asymptote to the values of free-field shock-induced and Rayleigh collapse with pressure ratios of ps/po = 353 and ps/po = 714, respectively, for large Ho/Ro. Near the wall, the jet velocity increases dramatically and reaches values beyond 2000 m s−1. These results are close to those obtained in the simulations of Jamaluddin et al. (2005), but overpredict the experiments of Philipp et al. (1993), who measured jet velocities up to 800 m s−1 for ps/po = 600, compared to approximately 1100 m s−1 in the simulations. However, in the experiments the shock is followed by an expansion, so that this discrepancy could be explained by the fact that the bubble dynamics depend on the relative size between the bubble and the pulse width. A lower jet velocity is achieved in Philipp et al. because the bubble is not small compared to the pulse width, as explained by Johnsen & Colonius (2008). The maximum (near the wall) and asymptotic (far from the wall) jet velocities are similar in Rayleigh and shock-induced collapse, though the range 1.1 ≲ Ho/Ro ≲ 2.0 shows discrepancies. The velocities of the distal side are similar for Rayleigh and shock-induced collapse at small Ho/Ro, since the pressure doubling occurs almost instantaneously there, but then diverge for larger stand-off distances, since the shock does not have time to reflect back to the bubble and thus affect the collapse. This effect is consistent with that observed in § 4.1.
The discrepancies in velocity illustrate that the dynamics of shock-induced collapse differ from those of Rayleigh collapse, because of both the transient nature of the shock–bubble interaction and the non-sphericity of the collapse.
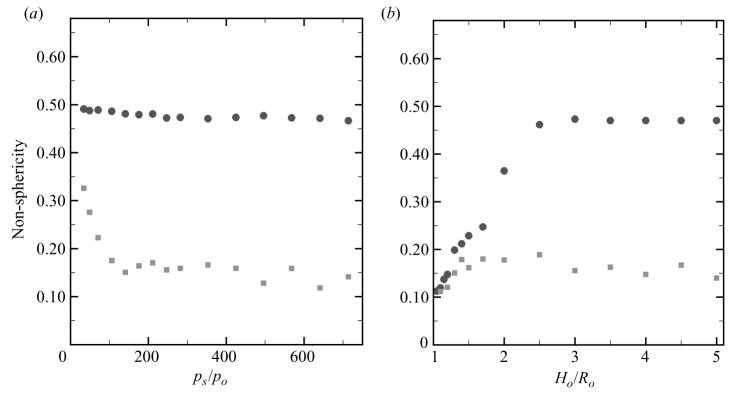
4.3. Non-sphericity and jet size
As shown in § 3.1, the bubble achieves its most non-spherical shape at collapse. The maximum non-sphericity depends greatly on the pressure ratio for shock-induced collapse and on the initial stand-off distance for Rayleigh collapse near a wall, as shown in figure 12. As explained in § 2.3, instabilities develop even during free-field Rayleigh collapse, so that the bubble does not remain completely spherical. The bubble non-sphericity is a difficult quantity to compute numerically, as illustrated by the scatter in the results of free-field shock-induced collapse. Nevertheless, the overall behaviour is expected, as a collapse driven by a larger pressure ratio or closer to the wall leads to a more non-spherical shape. This quantity is even more difficult to measure experimentally because of limitations in resolution. An alternative measure of non-sphericity is the sum of the maximum velocities achieved by the jet and distal side, vj + vd. From the results shown in figure 11, this quantity increases with increasing pressure ratio or decreasing stand-off distance, which both imply a higher level of non-sphericity; on the other hand, a value of zero is achieved in the symmetric Rayleigh collapse.
Figure 12.
Maximum bubble non-sphericity for shock-induced (squares) and Rayleigh (circles) collapse. The non-sphericity is given by the ratio of the projected bubble area to the length of the perimeter normalized by the average radius; a value of 0.5 corresponds to a spherical collapse. The maximum value is achieved at collapse: (a) free-field collapse; (b) collapse near a wall. Shock-induced collapse: ps/po =353; Rayleigh collapse: ps/po = 714.
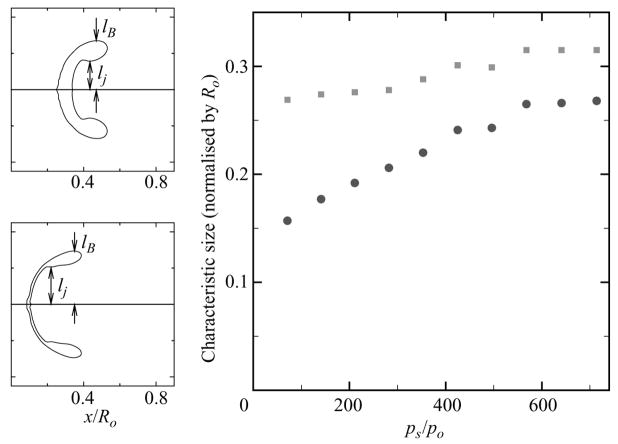
The characteristic size of the jet is of importance in order to determine the flow regime that occurs within the jet. Because high curvatures and small scales are achieved, viscous and surface tension effects may be important. Figure 13 shows the outline of the bubble for two different pressure ratios (ps/po = 71 and 282) across the shock and the jet size, lj, and the height of the bubble, lB, as a function of the pressure ratio across the shock for free-field shock-induced collapse. The characteristic size of the jet is taken as the length between the x-axis and the point where the jet outline first becomes horizontal, and the bubble height is the distance between the centreline and the topmost part of the bubble at that instant, as shown schematically in figure 13. In both cases, this behaviour occurs just before the bubble achieves its minimum volume. The shape of the bubble at that time depends on the pressure ratio across the shock: for a higher pressure ratio, the jet is wider, as in the experiments of Bourne & Field (1992) and in contrast to the results for lower pressure ratios, which exhibit higher curvatures and a more prominent vortex ring structure similar to the shock–bubble interaction in gases of Haas & Sturtevant (1987). As the pressure ratio across the shock increases, both the width of the jet and the height of the bubble increase, such that the aspect ratio of the bubble becomes more elongated in the vertical direction in figure 13 as ps/po is increased.
Figure 13.
Characteristic lengths in free-field shock-induced collapse. The characteristic size of the jet is taken as the length between the x-axis and the point where the jet outline first becomes horizontal, and the bubble height is the distance between the centreline and the topmost part of the bubble at that instant: (a) Jet outline. Top: ps/po = 71 at t/(Ro/cL) = 20.1; bottom: ps/po = 282 at t/(Ro/cL) = 11.0. (b) Characteristic lengths as a function of pressure ratio across the shock. Circles: jet size, lj; squares: bubble height, lB.
The Reynolds and Weber numbers are measures of the ratio of the inertial forces to the viscous and surface tension forces, respectively. Based on the maximum jet velocities achieved in figure 11 and on the jet size shown in figure 13, Reynolds numbers in the range 8.80 × 10² to 3.37 × 10³ and Weber numbers in the range 6.79 × 10³ to 5.79× 10⁴ are achieved for a bubble with a 10 μm radius. However, at the instant shown in figure 13, the jet has already decelerated to approximately 0.7 vj,max, so that the effective Reynolds number may be in the range 2.50 × 10² to 1.04 × 10³ and the effective Weber number may be in the range 2.04 × 10³ to 1.74 × 10⁴. Based on these values, viscosity and surface tension are not expected to play an important role in the jet dynamics or the generation of the water hammer. Since the thermal diffusivity is an order of magnitude smaller than viscosity, thermal diffusion can similarly be neglected. The mass diffusivity between water and air is several orders of magnitude smaller than the thermal diffusivity, so that binary diffusion is negligible as well. Finally, for spherical collapse, the mass rate of evaporation is ρv4πR2Ṙ (Brennen 1995), where ρv is the saturated vapour density; thus, the mass flux is ρvṘ. Since there is no vapour initially in the bubble and since Ṙ < 0 during collapse, no liquid evaporates, so that phase change is not a factor during collapse.
4.4. Shock formation
It is observed in Ohl et al. (1999) that a smaller amplitude ‘tip-bubble shock’ precedes the water-hammer shock in Rayleigh collapse near a wall, though Lindau & Lauterborn (2003) correct this claim by stating that this shock is actually a portion of the water-hammer shock. It is shown in this section that such a shock wave may be caused by the unsteady piston-like advance of the jet. For a piston advancing at some velocity, Ẋ (t), the shock formation time can be computed by solving the equation (Thompson 1984):
| (4.3) |
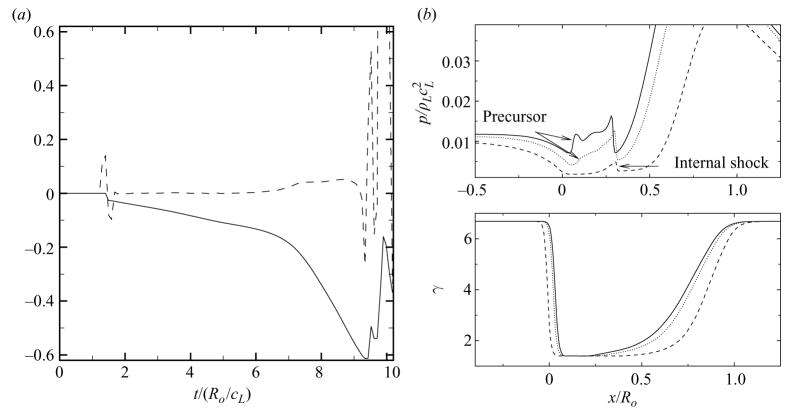
Here, the jet plays the role of the piston, for which the jet velocity in free-field shock-induced collapse with ps/po = 353 (from figure 8) is used. Figure 14 plots the jet velocity and the left-hand side of (4.3) as a function of time, along with profiles of pressure and γ along the centreline. The left-hand side of (4.3) is computed by setting Ẋ equal to the jet velocity and by differentiating it numerically with respect to time to obtain Ẍ and .
Figure 14.
Formation of the precursor shock in free-field shock-induced collapse. (a) History of the jet velocity (solid line) and of the left-hand side of equation 4.3 (dashed line). (b) Pressure (top) and γ (bottom) profiles along the centreline. Dashed line: t/(Ro/cL) = 9.24; dotted line: t/(Ro/cL) = 9.52; solid line: t/(Ro/cL) = 9.61.
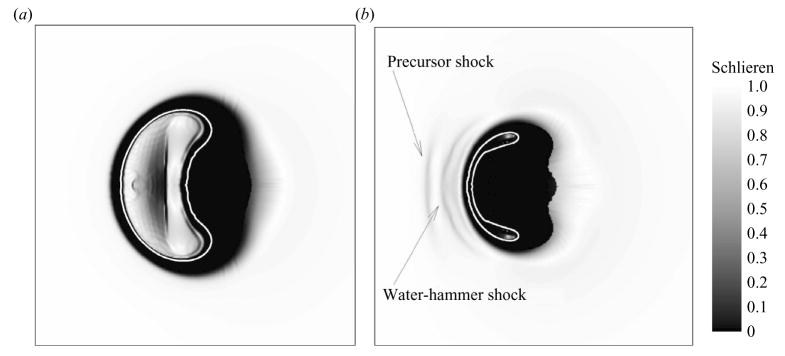
The shock formation time is obtained when the left-hand side of (4.3) equals zero. In the left plot of figure 14, the initial transient is neglected, so that the shock formation time is approximately t/(Ro/cL) = 9.19. To confirm this, the pressure profiles are considered. The internal transmitted shock (which is trapped inside the bubble) is the most visible protrusion within the bubble at t/(Ro/cL) = 9.24; because of the interference of this shock, it is difficult to discern the shock formed by the piston-like motion of the jet. However, at t/(Ro/cL) = 9.52, this latter shock is visible, and its strength increases rapidly. Thus, the ‘tip-bubble shock’ observed by Ohl et al. (1999) may in fact be this precursor shock. Figure 15 shows numerical Schlieren contours (i.e. a function of the norm of the density gradient) to illustrate the emission of the precursor shock. The precursor shock precedes the stronger water-hammer shock generated upon impact of the jet onto the distal side; after some time, a single front is distinguishable (Sankin et al. 2005).
Figure 15.
Numerical Schlieren contours of the precursor shock in free-field shock-induced collapse (ps/po = 353); dark regions correspond to large density gradients. The thin white outline denotes the approximate interface location (γ = 1.42 contour). (a) t/(Ro/cL) = 7.75; (b) t/(Ro/cL) = 8.40.
5. Shock propagation
5.1. Water-hammer pressure
When a high-speed liquid impacts a solid, a water-hammer pressure is generated and obeys the equation (Huang, Hammitt & Mitchell 1973):
| (5.1) |
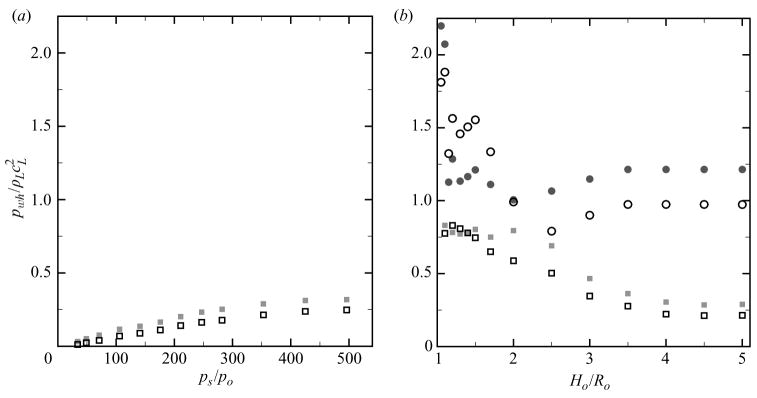
where ρS is the solid density and cS is the sound speed in the solid. In the problems of interest, the re-entrant jet always first impacts the distal side of the bubble, which consists of water and moves at a velocity vd. Thus, the right-hand side of (5.1) reduces to ρLcL|vj − vd |/2. The jet may hit the wall afterwards, but its velocity is greatly reduced by the impact. Figure 16 shows the water-hammer pressure computed based on (5.1) and measured in the simulations for free-field shock-induced collapse, and shock-induced and Rayleigh collapse near a wall. Results for free-field Rayleigh collapse are not included because no jet is generated.
Figure 16.
Water-hammer pressure for shock-induced (square) and Rayleigh (circles) collapse. The empty symbols denote the values computed from (5.1) and the filled symbols are the values measured in the simulations: (a) free-field collapse; (b) collapse near a wall. Shock-induced collapse: ps/po = 353; Rayleigh collapse: ps/po = 714.
As expected, the water-hammer pressure increases with increasing pressure ratio for free-field shock-induced collapse. The agreement between the theory and the simulation is good initially; discrepancies may be due to compressibility effects. However, the theory underpredicts the measured water-hammer pressure. In the case of collapse near a wall, the maximum water-hammer pressure occurs at small Ho/Ro because the velocity difference is largest. The agreement between the values measured in the simulations with the theory is acceptable in shock-induced collapse, though the theory is underpredicted again. In Rayleigh collapse near a wall, the re-entrant jet forms and impacts the distal side until Ho/Ro ≈ 2.5; beyond this distance, the emitted shock wave is caused by the compression of the gas, because the jet does not penetrate the bubble sufficiently to impact the distal side. The maximum value is achieved near the wall, where pwh,max ≈ 1.49 GPa, in agreement with Jamaluddin et al. (2005).
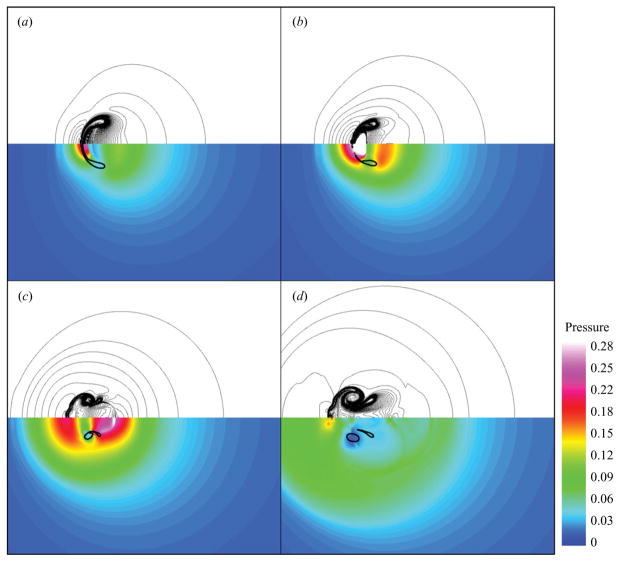
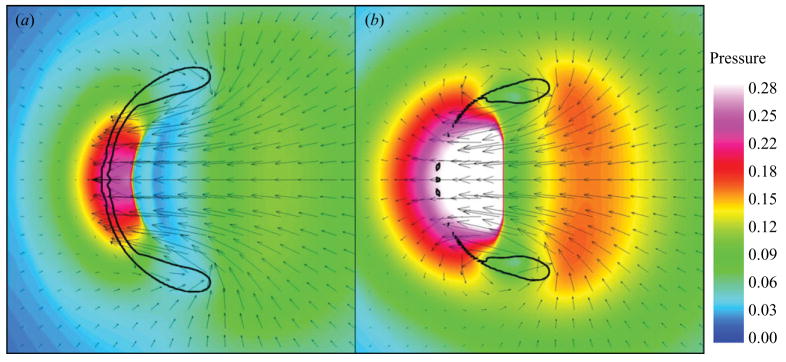
For the present range of Ho/Ro, the jet always impacts the distal side first and subsequently decelerates. Hence, the water-hammer shock is always generated within the liquid and then propagates radially outwards. These findings suggest that the main mechanism responsible for the emission of a strong shock during non-spherical bubble collapse is the water-hammer event. This behaviour is illustrated in figure 17. The generation of the water-hammer shock is clearly visible. After the jet impacts the distal side, the bubble takes the form of a vortex ring, which convects downstream in the direction of shock propagation. A blown-up version of the first two frames of figure 17 with the velocity vectors are shown in figure 18. It is difficult to determine the instant at which jet impact takes place because of the smeared interface, but it is clear from the vectors that high-velocity liquid is drawn into the jet region and collides with the distal side that moves at a much lower velocity. The high pressure (generated by the water hammer) is localized along the thin bubble region over which the jet has impacted the distal side. The water-hammer shock propagating upstream in the jet region is very sharp. The velocity vectors clearly show that the bubble takes the shape of a vortex ring after jet impact. The numerical dissipation leads the interface to seemingly dissolve. The gas compression shock mentioned in Ohl et al. (1999) is difficult to distinguish from the water-hammer shock in the present case.
Figure 17.
Water-hammer shock in free-field shock-induced collapse (ps/po = 353) at times (a) t/(Ro/cL) = 8.49, (b) t/(Ro/cL) = 8.68, (c) t/(Ro/cL) = 9.05, (d) t/(Ro/cL) = 9.52. Top: density lines; bottom: pressure contours non-dimensionalized by (approximate interface location: γ = 1.42 contour).
Figure 18.
Pressure contours non-dimensionalized by (approximate interface location: γ = 1.42 contour) and velocity vectors showing the water-hammer shock in free-field shock-induced collapse (ps/po = 353) at times (a) t/(Ro/cL) = 8.49, (b) t/(Ro/cL) = 8.68.
If a bubble is close enough or attached to a wall, the jet may hit it directly. This is the case in the experiments of Tomita & Shima (1986), Vogel et al. (1989) and Philipp & Lauterborn (1998), where values of Ho/Ro < 1, i.e. the bubble is attached to the wall, are considered; however, the initial shape of bubbles for which Ho/Ro < 1 is not spherical, so that it is not clear how to make comparisons between such bubbles and initially spherical bubbles. As observed in figure 11, the jet greatly decelerates after impacting the distal side. Thus, the distal side would have to be extremely close to the wall in order for the jet to directly hit the wall at a very high speed.
5.2. Radiated energy
Motivated by experimental observations that non-spherical collapse leads to longer rebounds (Kreider 2008), the energy radiated at collapse is investigated. Vogel et al. (1989) report that the average energy loss of a cavitation bubble during the first collapse is 84 %, and that up to 90 % of that fraction is due to the emission of sound. The energy balance for a spherical bubble in a compressible liquid is given by (Herring 1941)
| (5.2) |
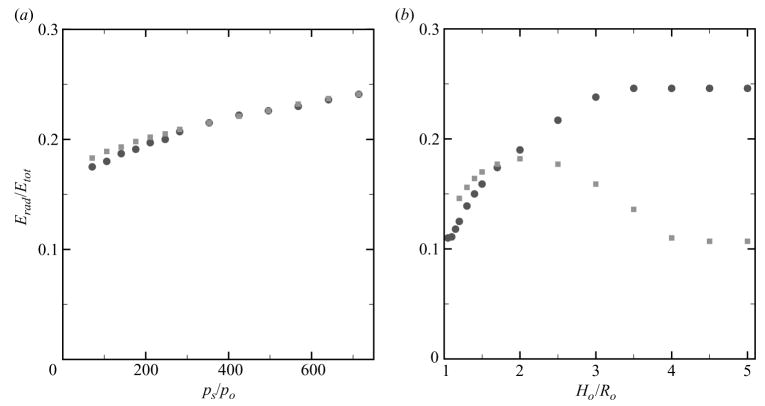
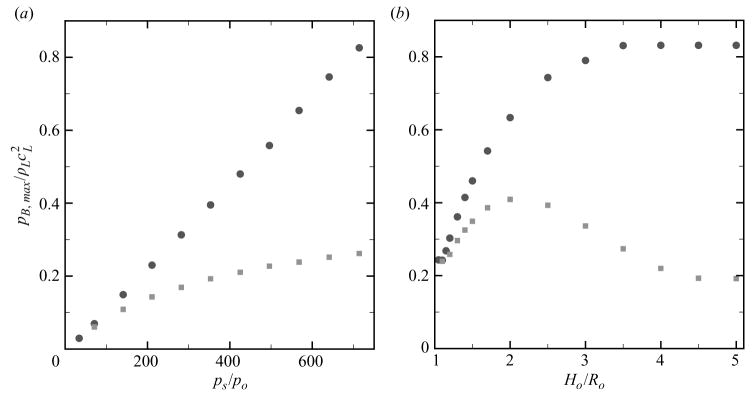
The left-hand side of the equation represents conservation of energy for incompressible motion. Thus, changes in this value due to the right-hand side are caused by energy radiation due to the compressibility of the liquid; the right-hand side is denoted Erad. Recalling that [dp/dt]R = − 3γp(R)Ṙ/R, the right-hand side consists of a correction of order O(Ṙ/cL) to the incompressible expression.† The first term on the right-hand side is a correction to the kinetic energy and the second term is a correction to the work done by the bubble. Figures 19 and 20 show the fraction of the normalized radiated energy, Erad/Etot, where , and the maximum average bubble pressure at collapse for shock-induced and Rayleigh collapse in a free field and near a wall. Because the collapse is not purely spherical in the simulations, the radius, R, is taken as the average radius computed from (3.1) and the interface velocity, Ṙ, is obtained by differentiating R with respect to time. Though (5.2) is strictly valid for spherical bubble dynamics only, the equation is applied to non-spherical collapse by evaluating each term as an average over the volume and is considered to determine trends in the results.
Figure 19.
Fraction of the radiated energy for shock-induced (squares) and Rayleigh (circles) collapse: (a) free-field collapse; (b) collapse near a wall. Shock-induced collapse: ps/po = 353; Rayleigh collapse: ps/po = 714.
Figure 20.
Maximum average bubble pressure for shock-induced (squares) and Rayleigh (circles) collapse: (a) free-field collapse; (b) collapse near a wall. Shock-induced collapse: ps/po = 353; Rayleigh collapse: ps/po = 714.
In free-field collapse, even though the dynamics of collapse and the average bubble pressure depend significantly on the pressure ratio, the energy radiated in shock-induced collapse is very close to that radiated during Rayleigh collapse. This suggests that the pressure driving the collapse, ps/po, is the parameter that governs the amount of radiated energy and that the details of the collapse are unimportant. In collapse near a wall, the radiated energy and the average bubble pressure increase with the initial stand-off distance, which is consistent with the experiments of Vogel et al. (1989), though much lower. This trend may appear somewhat contradictory, in that energy is expected to go into the jet formation (Brennen 2002). However, this behaviour can be explained by the fact that the collapse becomes more spherical farther away from the wall, as shown in § 4.3. For a given pressure ratio, a spherical collapse achieves a smaller radius and therefore a higher pressure, so that more energy is radiated. As a result, the rebound is smaller than for non-spherical collapse, where the bubble loses less energy, and is therefore capable to rebound to a greater size (Kreider 2008).
5.3. Wall pressure
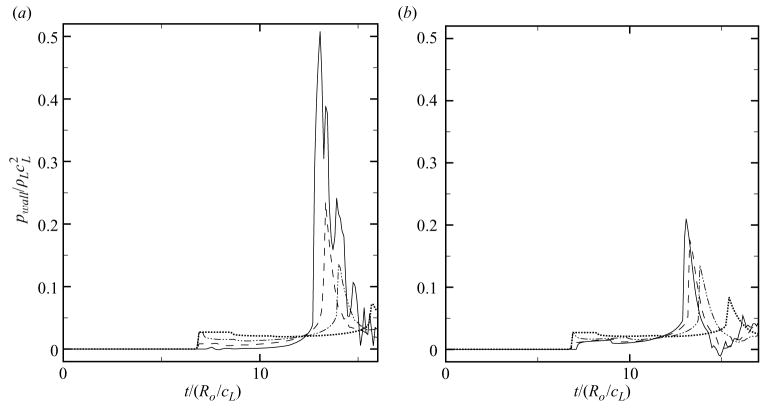
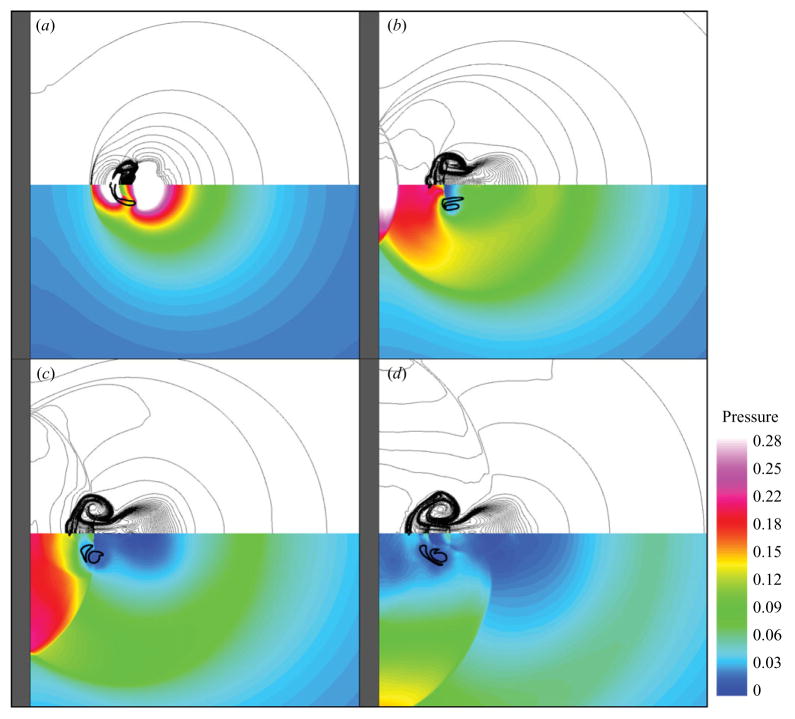
As a measure of the damage potential of bubble collapse, the pressure along the wall is considered. Figure 21 shows the history of the wall pressure at different locations along the wall (s/Ro = 0, 1, 2, 4), for two different initial stand-off distances in shock-induced collapse near a wall (ps/po = 353, Ho/Ro = 1.2, 2.0). The two situations show similar features. The pressure is initially atmospheric and suddenly increases when the shock reflects off the wall at t/(Ro/cL) ≈ 7. Because the bubble interferes with the incoming shock, a small portion is reflected as an expansion, while the main shock diffracts about the bubble. Thus the shock in the shadow of the bubble is not as strong and is slightly delayed; the bubble shields the wall to some extent, which depends on the initial stand-off distance. After the shock reflects off the bubble, inverts its phase and hits the wall again, the wall pressure decreases. Then, a large and sharp pressure rise occurs due to the impact of the water-hammer shock. The subsequent increases and decreases are caused by later reflections of the water-hammer shock between the wall and the bubble. Significant tension may be achieved due to the impact of the expansion waves resulting from the shock reflection off the low impedance bubble. For small Ho/Ro, the distal side barely moves, as shown in § 4.2, and the bubble is very close to the wall. Thus, the wall pressure increases sharply along the centreline (s = 0) due to the water-hammer shock, but the measurements off-axis decrease rapidly because the reflection occurs at a small angle. On the other hand, when the bubble is initially farther from the wall, the decrease in the wall pressure off-axis is smaller. This highlights the fact that the water-hammer shock is not planar, but propagates radially outwards from its origin. Furthermore, as observed in the contour plots of the previous sections, the water-hammer shock is stronger in the direction of propagation of the jet; even though the shock propagates radially outwards, its strength is not uniform. Figure 22 shows density lines and pressure contours for selected frames after the collapse, in order to provide a visual understanding of the process. The generation of the water-hammer shock and multiple wave reflections between the wall and the bubble are clearly visible and suggest extensive regions of high pressure. The bubble takes the shape of a vortex ring after collapse and convects towards the wall.
Figure 21.
History of the wall pressure at different locations along the wall for shock-induced collapse near a wall (ps/po = 353): (a) Ho/Ro = 1.2; (b) Ho/Ro = 2.0. Solid line: s/Ro = 0.0; dashed line: s/Ro = 1.0; dashed-dotted line: s/Ro = 2.0; dotted line:s/Ro = 4.0.
Figure 22.
Collapse and shock propagation in shock-induced collapse near a wall with ps/po = 353, Ho/Ro = 1.5 at times (a) t/(Ro/cL) = 7.93, (b) t/(Ro/cL) = 8.58, (c) t/(Ro/cL) = 8.96, (d ) t/(Ro/cL) = 9.42. Top: density lines; bottom: pressure contours non-dimensionalized by (approximate interface location: γ = 1.42 contour).
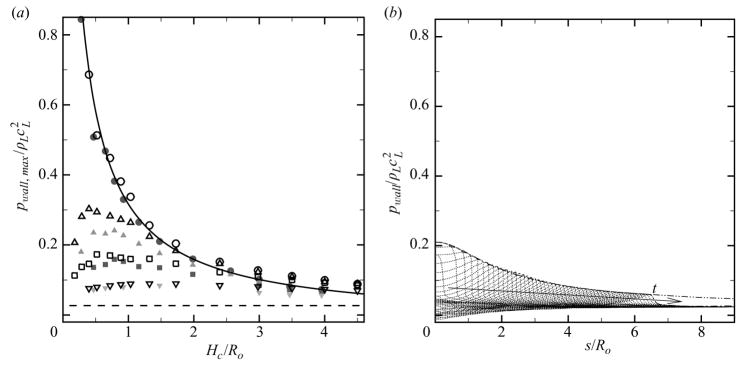
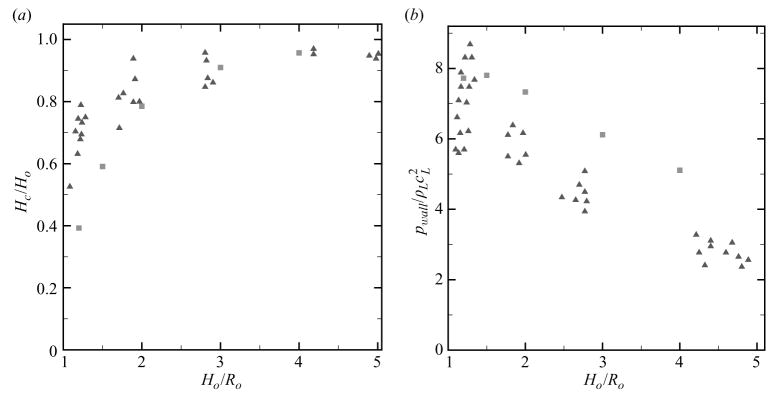
The maximum value of the wall pressure is thus of interest when estimating the potential damage. Figure 23 shows the maximum wall pressure at different radial locations along the wall (s/Ro = 0.0, 1.0, 2.0, 4.0) as a function of the location of the bubble at collapse and the wall pressure as a function of radial coordinate along the wall (Ho/Ro = 2.0) for shock-induced collapse with ps/po = 353. In the latter plot, several pressure profiles are shown, in addition to the maximum recorded pressure at any position. The pressure is highest along the centreline and decays as 1/r, where r denotes the radial distance from the location of the collapse, Hc. During collapse, the bubble moves towards the wall, so that this displacement must be taken into account; this migration leads to higher wall pressures than expected based on the stand-off distance (Tomita & Shima 1986). Values up to 2.3 GPa consistent with the results of Jamaluddin et al. (2005) are achieved. Off the axis, the pressure is lower for bubbles very close to the wall; this may be explained by the fact that for such bubbles the shock reflects off the wall at a small angle. By extrapolating the 1/r relationship observed in figure 23, a bubble needs to be located within Hmax/Ro ≈ 7.9 to generate a pressure as large as that of the incoming shock wave. Hence, if bubbles are located within this distance from the wall, the presence of a bubble amplifies the shock pressure locally. To further quantify the extent of the potential damage, the analysis of Johnsen & Colonius (2008) is applied. The wall pressure can be expressed as
Figure 23.
Wall pressure for shock-induced collapse with ps/po = 353. (a) Maximum wall pressure as a function of the location of the bubble at collapse (s/Ro = 0.0: circles; s/Ro = 1.0: triangles; s/Ro = 2.0: squares; s/Ro = 4.0: diamonds). Solid line: 1/r; dashed line: initial shock; open symbols: equivalent Rayleigh collapse near a wall (ps/po = 714). (b) Wall pressure as a function of the radial coordinate along the wall (Ho/Ro = 2.0). Dotted line: instantaneous pressure profiles; dashed line: maximum value of the profiles; dasheddotted line: equation 5.3.
| (5.3) |
where s is the radial distance from the centreline, Hc is the distance from the collapse location to the wall for a particular Ho/Ro and c1 and c2 are constants that can be determined if two pressure measurements are known. Equation (5.3) matches the results in figure 23 closely and confirms the fact that the shock resulting from the collapse of a bubble far away from the wall (large Hc) looks essentially planar. The radius of the area over which the wall pressure is larger than that of the pulse is computed by extrapolating the function in (5.3): a value of Lr/Ro ≈ 6.3 is achieved, where Lr is the radial distance over which the wall pressure due to the bubble collapse is larger than that due to the shock, meaning that the area over which the pressure due to bubble collapse is larger than that of the incoming shock is almost 40 times larger than the initial projected area of the bubble for these parameters.
Wall pressure results for shock-induced collapse only are shown in the current work. Results for the ‘cavitation’ case with ps/po = 34 are not included, because the present model does not capture the behaviour of such a bubble accurately at collapse. The behaviour during collapse is well captured, as illustrated by the results in § 3.1 since the effects of the inertia of the bubble contents and of phase change are small. In the simulations, the bubble is filled only with non-condensable gas, whose amount does not change. From Rayleigh–Plesset analysis, the compression of the non-condensable gas arrests the collapse and causes rebound. In nature, a cavitation bubble about to undergo Rayleigh collapse contains mainly vapour at its maximum radius and only a small amount of non-condensable gas. During the collapse, the vapour condenses. Thus, the minimum radius is larger in the simulations than it would be for a vapour bubble of the same initial radius, which contains far less non-condensable gas at collapse. For a bubble with little gas contents undergoing spherical collapse, the radius and bubble pressure at collapse can be computed from the Rayleigh–Plesset equation (Brennen 1995):
| (5.4) |
where pGo is the partial pressure of the gas and pv is the vapour pressure. As an example, the equilibrium radius of a bubble is approximately 10 μm and its maximum radius is approximately 1 mm in shock wave lithotripsy. If the bubble only consists of gas at equilibrium, the partial pressure of the gas at maximum radius is then approximately 10−6 × patm, at which point the bubble mainly consists of vapour. This leads to a minimum radius of Rmin/Ro ≈ 2 × 10⁻⁵. In the present simulations, the bubble consists of gas at ambient pressure initially (i.e. at pGo = patm ), which then leads to a larger minimum radius (Rmin/Ro ≈ 0.1) and therefore to a much lower bubble pressure at collapse. For these reasons, simulations of Rayleigh collapse near a wall with ps/po = 34 using the present method show significant discrepancies in the subsequent wall pressures, compared to existing experiments with cavitation bubbles, and are not shown here for conciseness.
6. Comparisons to the experiments of Shima et al. (1984)
For validation purposes, comparisons with the experiments of Shima et al. (1984), in which a shock generated by an imploding bubble interacts with a pre-existing gas bubble located near a lucite wall, are carried out. The simulations are set up such that they match the experimental settings as closely as possible. The amplitude of the incoming shock in the simulations is set to a constant value of 2.5 MPa, so that, due to pressure doubling, a value of 5.0 MPa is measured at the wall, as in the experiments. No attempt is made to model the 1/r decrease in the amplitude of the shock in the experiments, which occurs because the shock is generated by a collapsing bubble. Based on the pressure traces shown in Shima et al. (1984), the expansion is modelled by an exponentially decaying function with approximately the same half-width as in the experiments (15 μs for a 1 mm-radius bubble).
The main difference between the simulations and the experiments lies in the assumption that the wall is rigid, i.e. that it perfectly reflects incoming waves. The effect of the finite impedance of the wall in the present work may be estimated as follows. In the experiment, the wall is made of lucite, which has an acoustic impedance twice as large as that of water. Thus, the effective pressure ratio driving the collapse is (5/3)ps/po upon shock reflection, since the collapse time is large compared to the time of propagation of the shock. As shown in Johnsen & Colonius (2008), the wall pressure increases linearly with ps/po for a lithotripter pulse, so that the present results may overpredict the actual pressure by approximately a factor of one-sixth. Though coupling between the fluid and solid mechanics would have to be implemented to exactly reproduce the experiments, partially reflecting boundary conditions (e.g. based on characteristics) may be used to model the finite impedance of the solid.
Figure 24 shows a comparison between the shock-induced collapse simulations and the experiments of Shima et al. (1984); the distance between the wall and the bubble at collapse and the wall pressure (averaged over the area of the hydrophone used in the experiments) are plotted. A net velocity towards the wall is induced by the passage of the shock, thus prompting the bubbles to migrate in the direction of shock propagation. The wall has little effect on bubbles far away from it. A bubble initially close to the wall feels its effect more significantly and migrates towards it by a larger amount. The simulations underpredict the distance of the bubble from the wall at collapse, Hc, for small Ho/Ro, or, alternately, they overpredict the displacement (|Ho − Hc|). As shown in § 5.3, the wall pressure decreases with initial stand-off distance far from the wall. Near the wall, the pressure is not as high because it is averaged over a large area; the angle between the emitted shock and the reflections is smaller, thus leading to lower pressures at farther distances along the wall. Nevertheless, the present results show the same trend as the experiments of Shima et al. (1984); the wall pressure is overpredicted by approximately 20 % for large Ho/Ro.
Figure 24.
Comparison of shock-induced collapse near a wall with ps/po = 25 between the present simulations (squares) and the experiments by Shima et al. (1984) (triangles): (a) Distance between the wall and the bubble at collapse; (b) wall pressure averaged over the area of the hydrophone used in the experiment.
Overall, the agreement with the experiments is reasonable and within the bounds of the approximations made in the simulations to try to reproduce the experiments. Taking into account the previous estimate that the finite impedance of lucite would yield wall pressures approximately one-sixth less than those measured for a perfectly reflecting wall, the agreement becomes far better. In addition the bubble dynamics, and therefore the wall pressure, are sensitive to the width of the incoming pulse (Johnsen & Colonius 2008); a larger pulse width implies that the bubble is subjected to a high pressure for a longer time. This phenomenon is illustrated in table 2, which lists the distance between the wall and the bubble at collapse and the wall pressure as a function of the pulse width. Though the location at collapse does not vary significantly, the wall pressure may differ by a factor of two from a half-width of 10 to 20 μs.
Table 2.
Dependence of distance between the wall and the bubble at collapse and pressure on the pulse half-width for shock-induced bubble collapse near a wall (ps/po = 25, Ho/Ro = 1.5).
| Pulse half-width (μs) | 10.0 | 12.5 | 15.0 | 20.0 |
| Hc/Ho | 0.65 | 0.61 | 0.59 | 0.58 |
| pwall (MPa) | 4.15 | 6.18 | 7.80 | 10.8 |
To the authors’ knowledge, this work constitutes the first computational study that presents quantitative comparisons to and good agreement with experiments of non-spherical bubble collapse for both the collapse (based on the location of the bubble at collapse and the earlier comparisons of displacements and collapse times) and the propagation of the shock emitted upon collapse (based on the wall pressure). This validation provides confidence in the other results of the present study for which no experimental data is available.
7. Conclusions
A high-order accurate shock- and interface-capturing scheme was used to simulate the shock-induced and Rayleigh collapse of a gas bubble in a free field and near a wall, in order to investigate the dynamics and potential damage of non-spherical bubble collapse. Collapse times, bubble displacements, interfacial velocities and surface pressures were quantified as a function of the pressure ratio driving the collapse and of the initial bubble stand-off distance; these quantities were compared to available theory and experiments, and showed good agreement overall.
In non-spherical bubble collapse, a re-entrant jet forms in the direction of shock propagation in shock-induced collapse and towards the wall in Rayleigh collapse near a wall. In shock-induced collapse, the finite speed of propagation of the shock is shown to affect the bubble dynamics; for the higher shock strengths considered in the present study, the time taken by the shock to propagate through the bubble (and to the wall in some cases) is not negligible compared to the collapse time. For instance, if the bubble is located far away from a wall, the reflected incoming shock interacts with it late during its collapse, leading to a slower and less energetic collapse than that of a bubble initially located close to the wall.
Several types of shock waves are observed during the collapse. A precursor shock forms due to the unsteady piston-like advance of the re-entrant jet. Because of high velocities, the impact of the jet upon the distal side of the bubble generates a strong water-hammer pressure shock in the liquid, which propagates radially outwards; the resulting shock decays as 1/r. This phenomenon may lead to very high wall pressures. Bubbles within a certain stand-off distance generate as high a pressure as the incoming shock, and the extent of this high pressure may range up to several initial radii along the wall; hence, the presence of a bubble within this stand-off distance amplifies the shock locally.
The present results represent the first study in which quantitative comparisons between numerical simulations and experiments of single-bubble collapse have been made, both in terms of the bubble collapse and the shock propagation; while reasonable agreement has been achieved, several modelling assumptions should be relaxed to carry out more comprehensive future studies. Foremost, the inclusion of phase change is necessary to consider cavitation bubble collapse. In addition, surface tension and viscous effects may be important for small bubbles. An extension of the method to three dimensions, though trivial, would allow the simulation of many related problems in different geometries, and, in order to accurately predict the damage due to bubble collapse, the mechanics of the solid should be coupled to the fluid dynamics.
Acknowledgments
The authors wish to thank W. Kreider and M. Bailey for sharing their experimental results and initiating the study of the energy radiation upon collapse, and K. Ando for helpful discussions on phase change. This work was supported by NIH Grant PO1 DK043881 and ONR Grant N00014-06-1-0730.
Footnotes
Cole (1948) suggests to discard terms linear in Ṙ/cL. However, this would lead to the cancellation of the entire right-hand side, thus recovering the incompressible energy balance.
References
- Abgrall R. How to prevent pressure oscillations in multicomponent flow calculations: a quasi conservative approach. J Comput Phys. 1996;125:150–160. [Google Scholar]
- Ball GJ, Howell BP, Leighton TG, Schofield MJ. Shock-induced collapse of a cylindrical air cavity in water: a free-Lagrange simulation. Shock Waves. 2000;10:265–276. [Google Scholar]
- Benjamin TB, Ellis AT. The collapse of cavitation bubbles and the pressure thereby produced against solid boundaries. Phil Trans R Soc Lond A. 1966;260:221–240. [Google Scholar]
- Best JP. The formation of toroidal bubbles upon the collapse of transient cavities. J Fluid Mech. 1993;251:79–107. [Google Scholar]
- Best JP, Kucera A. A numerical investigation of non-spherical rebounding bubbles. J Fluid Mech. 1992;245:137–154. [Google Scholar]
- Blake JR, Taib BB, Doherty G. Transient cavities near boundaries. Part 1 Rigid boundary. J Fluid Mech. 1986;170:479–497. [Google Scholar]
- Bourne NK, Field JE. Shock-induced collapse of single cavities in liquids. J Fluid Mech. 1992;244:225–240. [Google Scholar]
- Brennen CE. Cavitation and Bubble Dynamics. Oxford University Press; 1995 . [Google Scholar]
- Brennen CE. Fission of collapsing cavitation bubbles. J Fluid Mech. 2002;472:153–166. [Google Scholar]
- Chang CH, Liou MS. A robust and accurate approach to computing compressible multiphase flow: stratified flow model and AUSM+-up scheme. J Comput Phys. 2007;225:840–873. [Google Scholar]
- Cocchi JP, Saurel R, Loraud JC. Treatment of interface problems with Godunov-type schemes. Shock Waves. 1996;5:347–357. [Google Scholar]
- Cole R. Underwater Explosions. Princeton University Press; 1948 . [Google Scholar]
- Fujikawa S, Akamatsu T. Effects of the non-equilibrium condensation of vapour on the pressure wave produced by the collapse of a bubble in a liquid. J Fluid Mech. 1980;97:481–512. [Google Scholar]
- Gottlieb S, Shu CW. Total variation diminishing Runge–Kutta schemes. Math Comput. 1998;67:73–85. [Google Scholar]
- Haas JF, Sturtevant B. Interaction of weak shock waves with cylindrical and spherical gas inhomogeneities. J Fluid Mech. 1987;181:41–76. [Google Scholar]
- Hansson I, Kedrinskii V, Mørch KA. On the dynamics of cavity clusters. J Phys D: Appl Phys. 1982;12:1725–1734. [Google Scholar]
- Harlow F, Amsden A. Tech Rep. Los Alamos National Labs; 1971. Fluid dynamics. LANL Monograph LA-4700. [Google Scholar]
- Herring C. Tech Rep. National Defense Research Committee; 1941. Theory of the pulsations of the gas bubble produced by an underwater explosion. NDRC Division 6 Report C4-sr20. [Google Scholar]
- Hickling R, Plesset MS. Collapse and rebound of a spherical bubble in water. Phys Fluids. 1964;7:7–14. [Google Scholar]
- Hu XY, Khoo BC, Adams NA, Huang FL. A conservative interface method for compressible flows. J Comput Phys. 2006;219:553–578. [Google Scholar]
- Huang YC, Hammitt FG, Mitchell TM. Note on shock-wave velocity in high-speed liquid–solid impact. J Appl Phys. 1973;44:1868–1869. [Google Scholar]
- Jamaluddin AR, Ball GJ, Leighton TJ. Free-Lagrange simulations of shock/bubble interaction in shock wave lithotripsy. Shock Waves: Proceedings of the 24th Intl Symp. on Shock Waves; Beijing, China: International Shock Wave Institute; 2005. [Google Scholar]
- Johnsen E. PhD thesis. California Institute of Technology; 2007. Numerical simulations of non-spherical bubble collapse. [DOI] [PMC free article] [PubMed] [Google Scholar]
- Johnsen E, Colonius T. Implementation of WENO schemes for compressible multicomponent flow problems. J Comput Phys. 2006;219:715–732. [Google Scholar]
- Johnsen E, Colonius T. Shock-induced collapse of a gas bubble in shockwave lithotripsy. J Acoust Soc Am. 2008;124:2011–2020. doi: 10.1121/1.2973229. [DOI] [PMC free article] [PubMed] [Google Scholar]
- Joseph DD. Fluid Dynamics of Viscoelastic Liquids. Springer; 1989 . [Google Scholar]
- Klaseboer E, Fong SW, Turangan CK, Khoo BC, Szeri AJ, Calvisi ML, Sankin GN, Zhong P. Interaction of lithotripter shockwaves with single inertial cavitation bubbles. J Fluid Mech. 2007;593:33–56. doi: 10.1017/S002211200700852X. [DOI] [PMC free article] [PubMed] [Google Scholar]
- Kling CL, Hammitt FG. A photographic study of spark-induced cavitation bubble collapse. Trans ASME D: J Basic Engng. 1972;94:825–833. [Google Scholar]
- Kornfeld M, Suvorov L. On the destructive action of cavitation. J Appl Phys. 1944;15:495–506. [Google Scholar]
- Kreider W. PhD thesis. University of Washington; 2008. Gas–vapor bubble dynamics in therapeutic ultrasound. [Google Scholar]
- Kumar S, Brennen CE. Nonlinear effects in the dynamics of clouds of bubbles. J Acoust Soc Am. 1991;89:707–714. doi: 10.1121/1.1894630. [DOI] [PubMed] [Google Scholar]
- Lauterborn W, Bolle H. Experimental investigations of cavitation-bubble collapse in the neighbourhood of a solid boundary. J Fluid Mech. 1975;72:391–399. [Google Scholar]
- Lindau O, Lauterborn W. Cinematographic observation of the collapse and rebound of a laser-produced cavitation bubble near a wall. J Fluid Mech. 2003;479:327–348. [Google Scholar]
- Nagrath S, Jansen K, Lahey RT, Jr, Akhatov I. Hydrodynamic simulation of air bubble implosion using a level set approach. J Comput Phys. 2006;215:98–132. [Google Scholar]
- Niederhaus JHJ, Greenough JA, Oakley JG, Ranjan D, Anderson MH, Bonazza R. A computational parameter study for the three-dimensional shock–bubble interaction. J Fluid Mech. 2008;594:85–124. [Google Scholar]
- Nourgaliev RR, Dinh TN, Theofanous TG. Adaptive characteristics-based matching for compressible multifluid dynamics. J Comput Phys. 2006;213:500–529. [Google Scholar]
- Ohl CD, Ikink R. Shock-wave-induced jetting of micron-size bubbles. Phys Rev Lett. 2003;90:1–4. doi: 10.1103/PhysRevLett.90.214502. [DOI] [PubMed] [Google Scholar]
- Ohl CD, Kurz T, Geisler R, Lindau O, Lauterborn W. Bubble dynamics, shock waves and sonoluminescence. Phil Trans R Soc Lond A. 1999;357:269–294. [Google Scholar]
- Philipp A, Delius M, Scheffczyk C, Vogel A, Lauterborn W. Interaction of lithotripter-generated shock waves with air bubbles. J Acoust Soc Am. 1993;93:2496–2509. [Google Scholar]
- Philipp A, Lauterborn W. Cavitation erosion by single laser-produced bubbles. J Fluid Mech. 1998;361:75–116. [Google Scholar]
- Plesset MS. Cavitating flows. In: Bretschneider CI, editor. Topics in Ocean Engineering. Gulf Publishing Company; 1969. [Google Scholar]
- Plesset MS, Chapman RB. Collapse of an initially spherical vapour cavity in the neighbourhood of a solid boundary. J Fluid Mech. 1971;47:283–290. [Google Scholar]
- Popinet S, Zaleski S. Bubble collapse near a solid boundary: a numerical study of the influence of viscosity. J Fluid Mech. 2002;464:137–163. [Google Scholar]
- Rattray M. PhD thesis. California Institute of Technology; 1951. Perturbation effects in cavitation bubble dynamics. [Google Scholar]
- Rayleigh Lord. On the pressure developed in a liquid during the collapse of a spherical cavity. Phil Mag. 1917;34:94–98. [Google Scholar]
- Samtaney R, Pullin DI. On initial-value and self-similar solutions of the compressible Euler equations. Phys Fluids. 1996;8:2650–2655. [Google Scholar]
- Sankin GN, Simmons WN, Zhu SL, Zhong P. Shock wave interaction with laser-generated single bubbles. Phys Rev Lett. 2005;95:034501. doi: 10.1103/PhysRevLett.95.034501. [DOI] [PMC free article] [PubMed] [Google Scholar]
- Shima A, Tomita Y, Takahashi K. The collapse of a gas bubble near a solid wall by a shock wave and the induced impulsive pressure. Proc Inst Mech Engng. 1984;198C:81–86. [Google Scholar]
- Shu CW. Tech Rep. NASA Langley Research Center; 1997. Essentially non-oscillatory and weighted essentially non-oscillatory schemes for hyperbolic conservation laws. ICASE Report No. 97-65. [Google Scholar]
- Shyue KM. An efficient shock-capturing algorithm for compressible multicomponent problems. J Comput Phys. 1998;142:208–242. [Google Scholar]
- Thompson PA. Compressible-Fluid Dynamics. Maple Press Company; 1984 . [Google Scholar]
- Thompson KW. Time-dependent boundary conditions for hyperbolic systems, II. J Comput Phys. 1990;89:439–461. [Google Scholar]
- Tomita Y, Shima A. Mechanisms of impulsive pressure generation and damage pit formation by bubble collapse. J Fluid Mech. 1986;169:535–564. [Google Scholar]
- Toro EF, Spruce M, Speares W. Restoration of the contact surface in the HLL-Riemann solver. Shock Waves. 1994;4:25–34. [Google Scholar]
- Turangan CK, Jamaluddin AR, Ball GJ, Leighton TG. Free-Lagrange simulations of the expansion and jetting collapse of air bubbles in water. J Fluid Mech. 2008;598:1–25. [Google Scholar]
- Vogel A, Lauterborn W, Timm R. Acoustic transient generation by laser-produced cavitation bubbles near solid boundaries. J Acoust Soc Am. 1988;84:719–731. [Google Scholar]
- Vogel A, Lauterborn W, Timm R. Optical and acoustic investigations of the dynamics of laser-produced cavitation bubbles near a solid boundary. J Fluid Mech. 1989;206:299–338. [Google Scholar]


