Abstract
Co-adsorption kinetics of human low density lipoprotein (LDL) and serum albumin (HSA) on hydrophilic/hydrophobic gradient silica surface were studied using Total Internal Reflection Fluorescence (TIRF) and autoradiography. Two experimental systems were examined: (1) fluorescein-labeled LDL (FITC-LDL) adsorption from a FITC-LDL + HSA solution mixture onto the octadecyldi-methylsilyl (C18)-silica gradient surface, and (2) the FITC-LDL adsorption onto the HSA pre-adsorbed on the C18-silica gradient surface. Experiments with fluorescein-labeled albumin (FITC-HSA) and unlabeled LDL have been performed in parallel. The adsorption kinetics of FITC-LDL onto the hydrophilic silica was found to be transport-limited and not affected by co-adsorption of HSA. A slower adsorption kinetics of lipoprotein onto the silica with pre-adsorbed HSA layer resulted from a slow appearance of LDL binding sites exposed by the process of HSA desorption. In the region of increasing surface density of C18 groups, the FITC-LDL adsorption rate fell below the transport-limited adsorption rate, except in the very early adsorption times. Pre-adsorption of HSA onto the C18-silica gradient region resulted in a significant decrease of both the FITC-LDL adsorption rate and adsorbed amount. The lowest FITC-LDL adsorption was found in the region of C18 self-assembled monolayer, where the pre-adsorbed HSA layer almost completely eliminated lipoprotein binding.
1 Introduction
Spontaneous accumulation of proteins at interfaces is an example of protein interfacial activity [1, 3]. Adsorption of blood proteins onto surfaces of biomaterials remains as a big problem in hemocompatibility [2]. The adsorbed protein layer can induce the activation of coagulation cascade, platelet adhesion, and thrombus formation. There are twelve plasma proteins whose concentrations > 1 mg/mL and whose adsorption to surfaces is driven by their high plasma concentration [4, 5]. Among the twelve are the two lipoproteins: high (HDL) and low density lipoproteins (LDL). The lipoproteins transport water insoluble lipids in the circulation. The structure of lipoproteins consists of an apolar core surrounded by polar and amphiphilic components [6]. Interest in lipoproteins primarily arises from their association with coronary artery disease. Popular interpretation of LDL as “bad” and HDL as “good” lipoprotein is based on their use as risk markers for atherogenesis and coronary artery disease. A link between an atherosclerotic plaque formation and arterial thrombosis involves lipoprotein(a), Lp(a). Lp(a) is a variant of LDL that contains in its structure an additional protein, apolipopro-tein(a), that is homologous to plasminogen [7–9]. Interestingly, a promotion of the procoagulant state is not limited to Lp(a) inhibition of tissue-type plasminogen activator (tPA); it has been shown that both surface-adsorbed LDL or Lp(a) are able to promote the procoagulant state [10]. Hence the interest in adsorption of LDL onto biomaterial surfaces.
Improving blood compatibility of biomaterials has often been attempted through materials surface modifications. Many of modifications aimed at reducing or eliminating protein adsorption [2]. For example, water wettable surfaces typically adsorb less proteins [1]. Unlike water wettable surfaces, biomaterials with hydrophobic surfaces have been shown to adsorb proteins strongly. We have utilized the so-called “wettability gradient” surfaces, originally described by Elwing [11–14], as protein adsorption tools to evaluate the effect of biomaterial surface hydrophobicity on protein adsorption. For example, we have shown that the adsorption of human serum albumin (HSA), highest plasma concentration protein, increases with increasing surface density of octadecyldimethylsilyl (C18) groups [14]. The albumin adsorption affinity levels off at approximately 16–25 C18 surface groups per HSA molecule; albumin “sees” a surface with the C18 surface density higher than 25 groups/HSA molecule as generically hydrophobic.
Several research groups, including ours, studied the interfacial behavior of human lipoproteins [15–20]. In our previous work [21, 22], we investigated the effect of surface wettability on the adsorption of LDL from a single protein solution using the spatially-resolved total internal reflection fluorescence (TIRF) and scanning force microscopy (SFM) techniques. We found that the LDL adsorption kinetics rate and the apparent binding affinity decrease with increasing surface hydrophobicity. Interestingly, this affinity decrease was largely due to the changes in the adsorption, rather than desorption rates [21].
The aim of the present study was to investigate the effect of HSA on the adsorption of LDL in relation to the wettability of the adsorbent surface. We used the one-dimensional surface density gradient of octadecyldimethylsilyl groups (C18-silica gradient surface) with a several millimeters long region of increasing surface density of C18 groups positioned between a clean silica and a self-assembled C18 monolayer (C18 SAM). The advantage of using the gradient surface is that one can evaluate both protein adsorption and desorption rates as a function of the C18 group surface density under otherwise identical experimental conditions.
2 Materials and Methods
2.1 Isolation of Human Low Density Lipoprotein
Fifteen mL of blood was drawn from each donor and plasma of ten different donors was pooled. Low density lipoprotein (LDL) was isolated from human blood using the method of ultracentrifugation flotation [23]. The purity of LDL fraction was checked by polyacrylamide gel electrophoresis (1-D PAGE, Phast, Pharmacia). A modified Lowry method [24, 25] was used to determine the concentration of the protein component of LDL. Bovine serum albumin (BSA, protein standard, Sigma) and the solutions of known concentrations of LDL (courtesy of Dr. L. Wu, University of Utah) were used as the protein calibration standards. The total concentration of the LDL in solution was estimated by assuming that there are 25 % of protein and 75 % of lipid in each LDL particle [26].
2.2 Labeling of proteins
Fluorescein isothiocyanate isomer I (FITC, Aldrich) was covalently bound to LDL or human serum albumin (HSA, crystalline, ICN Biomedicals Inc.) following the method of Coons et al [27]. The degree of protein labeling was determined from the absorbances measured at 280 and 496 nm [28]. The degrees of labeling for FITC-LDL and FITC-HSA were 1.5 and 0.9, respectively. 125I-labeled LDL was prepared by using a modified iodine monochloride (ICl, Al-drich) iodination [29]. The same method was used in 125I labeling of HSA. The 125I-labeled proteins were used within one week.
2.3 Preparation of C18-silica surface gradient
The C18-silica surface gradient was prepared by a two phases diffusion method [11]. A high density solvent used was a solution mixture of 125 mL dichloromethane (density, d = 1.325 g/cm3, EM Science), 1 mL pyridine (J.T. Baker) and 2 mL octadecyldimethylchlorosilane (ODS, Aldrich). The mixture was layered below a low density solvent, 150 mL p-xylene (d = 0.86 g/cm3, Fluka), in a container with six clean silica plates (size 2.5 by 7.5 cm). The silanization reaction was allowed to proceed for 4 h. After 4 h, the solvents were drained and the modified silica plates were rinsed by dichloromethane, ethanol and deionized water. In order to determine the water contact angle as a function of the gradient position one of the modified silica plates from each batch was characterized using the Wilhelmy plate method [30].
2.4 Protein adsorption experiments
Protein adsorption experiments were performed using the dual channel, spatially resolved TIRF technique described elsewhere [12]. In this technique, two parallel experiments are performed using the same C18-silica gradient surface. The concentrations of protein solutions used in the experiments were made equal to the 1/100 of their respective concentrations in normal plasma (cLDL = 0.04 mg/mL, cHSA = 0.4 mg/mL). The protein solution in Dulbecco phosphate buffer (DPBS, 0.05 M phosphate, 0.147 NaCl, 0.90 mM CaCl2, 0.88 mM MgCl2, 2.70 mM KCl, pH 7.4) was flowed into the flow channel from the hydrophilic end with the rate of 0.84 mL/min initially displacing the buffer solution. The adsorption-desorption cycle included 11 min of adsorption and another 11 of desorption time. The fluorescence was measured using a CCD photon detector [12]. The fluorescence signal-to-noise ratio was improved by “binning” the CCD along the wavelength axis [31]. The fluorescence intensity profile along the C18-silica gradient was recorded each second. Three hundreds of these 1 s fluorescence intensity profiles were continuously recorded and combined into an ‘adsorption’ image (384 pixels along the gradient 3 300 seconds). The whole adsorption-desorption cycle was represented by four such ‘adsorption’ images: in first two images the process of adsorption was recorded, and the second two contained the information about the desorption process. The analysis of the adsorption was preceded by a background fluorescence subtraction routine and a “flat-fielding” of the laser intensity profile [12]. The whole procedure resulted in a reproducible fluorescence intensity between identical experiments and an uniform dynamic range of fluorescence intensity in all adsorption experiments.
The two sets of TIRF adsorption experiments were performed:
(1) co-adsorption of LDL and HSA using the following binary mixtures:
(i) FITC-LDL + HSA, or
(ii) LDL + FITC-HSA, and
(2) LDL adsorption onto HSA pre-adsorbed C18-silica gradient surface:
(i) FITC-LDL adsorption onto HSA pre-adsorbed C18-silica gradient surface, and
(ii) LDL adsorption onto FITC-HSA pre-adsorbed C18-silica gradient surface.
The HSA pre-adsorption was performed by incubating the TIRF flow cell with labeled or unlabeled HSA for 1.5 h prior to the start of the LDL adsorption.
The TIRF experiments were quantified using autoradiography. The autoradiography experiments were carried out with 125I-labeled protein using conditions that were otherwise identical to the conditions of TIRF experiments [32, 33]. The gradient surface used in each autoradiography experiment came from the same batch used in the parallel TIRF experiments. The protein solution containing a 1:4 ratio of 125I labeled and unlabeled protein had the same final protein concentration as in the TIRF experiment. The following protein solutions (all in DPBS) were used in the autoradiography experiments: (1) 125I-LDL, (2) mixture of 125I-LDL and HSA, (3) mixture of 125i-HSA and LDL, and (4) 125I-HSA. After the adsorption-desorption cycle, the adsorbed 125I-labeled proteins on the C18-silica gradient surface was fixed with 3 mL freshly prepared 0.6 % glutaraldehyde solution in DPBS. A plate with a set of known amounts of 125I labeled proteins was prepared separately in order to serve as an autoradiography calibration standard for the quantitation of adsorbed protein as previously described [32, 33].
3 Results and Discussion
3.1 Characterization of the C18 gradient surface
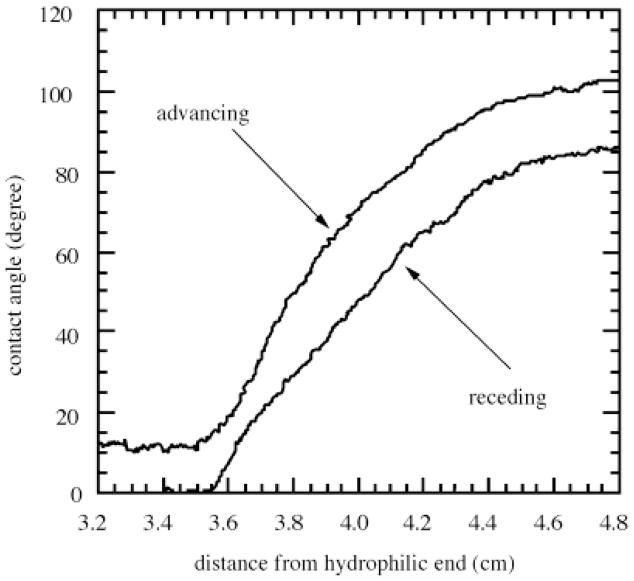
Water contact angles measured on a C18-silica gradient surface are shown in Fig. 1 as a function of the distance from the hydrophilic end. At distances greater than 4.7 cm was the hydrophobic C18 self-assembled monolayer, while at distances less than 3.5 cm was the hydrophilic silica surface. On the C18 SAM surface the advancing water contact angle (θadv) was 104° and the receding water contact angle(θrec) was 75°. The contact angle hysteresis, Δ θ = θadv − θrec = 29° indicating that the C18 SAM surface contained some defects. On the hydrophilic silica, the advancing water contact angle was 4° and the receding water contact angle was 0°. Between the distances of 3.5 and 4.7 cm the advancing contact angle changed smoothly from 4° to 104° indicating the wettability gradient region (Fig 1). The Cassie equation [34] was used to calculate the fractional surface coverage of C18 chains, Θ/Θmax(C18), by assuming the contact angle of defect-free C18 SAM, θ = 112° [35], and θsilica = 0° [14]:
| (1) |
Fig. 1.
Dynamic water contact angles measured on C18 silica gradient using the Wilhelmy plate technique
The following three positions along the gradient surface were chosen in the analysis of adsorption kinetics to represent the hydrophobic, wettability transition and hydrophilic regions: 1) hydrophobic region, θadv = 104°, with a fractional surface coverage of C18 groups, Θ/Θmax(C18) = 0.90, 2) wettability transition region, θadv = 50°, with the fractional surface coverage was Θ/Θmax (C18) = 0.25, and 3) hydrophilic silica, θadv = 0°, with no C18 groups present.
3.2. Adsorption of FITC-LDL and FITC-HSA onto the C18-silica gradient surface
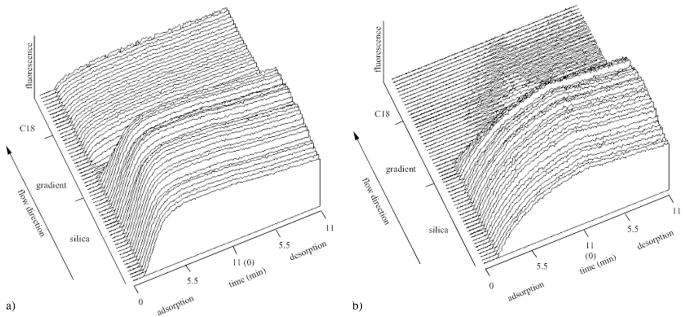
The LDL + HSA co-adsorption is shown in a form of a three-dimensional (3-D) plots, (e. g., as surface wettability vs. time vs. fluorescence intensity) in Figs. 2 and 3. The two markers indicate the beginning and the end of the C18 gradient region. The co-adsorption between FITC-LDL and unlabeled HSA is shown in Fig 2a. Overall, the FITC-LDL adsorption from the mixture was found to be very similar to the previously observed FITC-LDL adsorption from single protein solution [21].
Fig. 2.
The three-dimensional TIRF adsorption pattern (fluorescence intensity vs. position along the gradient vs. adsorption time) of the FITC-LDL adsorption from the FITC-LDL + HSA solution mixture onto the C18 gradient surface (a), and the FITC-LDL adsorption onto the pre-adsorbed HSA layer on the C18 gradient surface (b). The adsorption process during the first 11 min was followed by a desorption process in the second 11 min segment
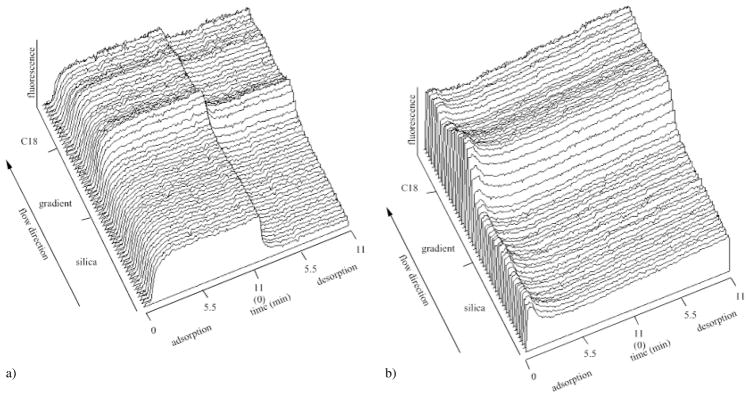
Fig. 3.
The three-dimensional TIRF adsorption pattern (fluorescence intensity vs. position along the gradient vs. adsorption time) of the FITC-HSA adsorption from the LDL + FITC-HSA solution mixture ((a), compare with Fig. 2a). The lower panel shows the desorption of pre-adsorbed FITC-HSA during the adsorption/desorption cycle of LDL ((b), compare with Fig. 2b)
The adsorption of FITC-LDL onto an HSA pre-adsorbed C18 gradient surface is shown in Fig 2b. The lipoprotein adsorption onto the HSA pre-adsorbed hydrophilic silica appears to be slower than the respective adsorption on silica from either FITC-LDL [21] or FITC-LDL + HSA solutions (Fig. 2a). The adsorption onto the pre-adsorbed HSA layer in the C18 gradient region was much slower and effectively diminished. A very low adsorption FITC-LDL onto the pre-adsorbed HSA on the C18 SAM surface was found (Fig. 2b).
The adsorption of FITC-HSA to the C18-silica gradient surface from the FITC-HSA + LDL binary solution mixture is shown in Fig. 3a. The relatively fast increase of albumin adsorption onto the silica is followed by a fast desorption in the buffer solution. The desorption of FITC-HSA slowed down as the surface wettability decreased (Fig. 3a). The desorption kinetics of the pre-adsorbed FITC-HSA which run concurrently with the LDL adsorption/desorption cycle (Fig. 2b) is shown in Fig. 3b.
3.3. Comparison of FITC-LDL adsorption along the wettability gradient
A linear adsorption rate of FITC-LDL, previously observed on silica [21], was found to be caused by a relatively slow flux of LDL particles to the surface. In the case of transport-limited adsorption the flux of lipoprotein molecules to surface, dA/dt, can be found using the so-called “Leveque” equation [36, 37]:
| (2) |
where Γ is the gamma function, q is the experimental volumetric flow rate (0.84 mL/min), b is the thickness of the TIRF flow cell (0.05 mm), w is the width of the TIRF flow cell (0.5 mm), l is the distance from the entrance of the flow chamber to the observation spot (2.8 cm), DLDL is diffusion coefficient of LDL (1.8 × 10⁻⁷ cm2/sec) [21], and cLDL is bulk concentration of LDL (0.04 mg/mL LDL).
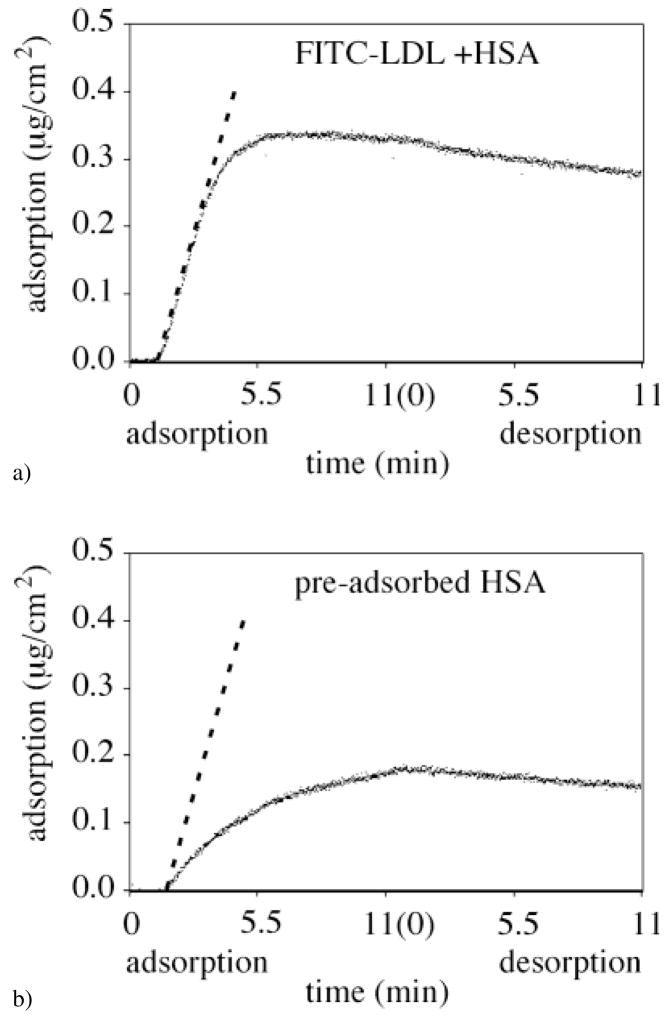
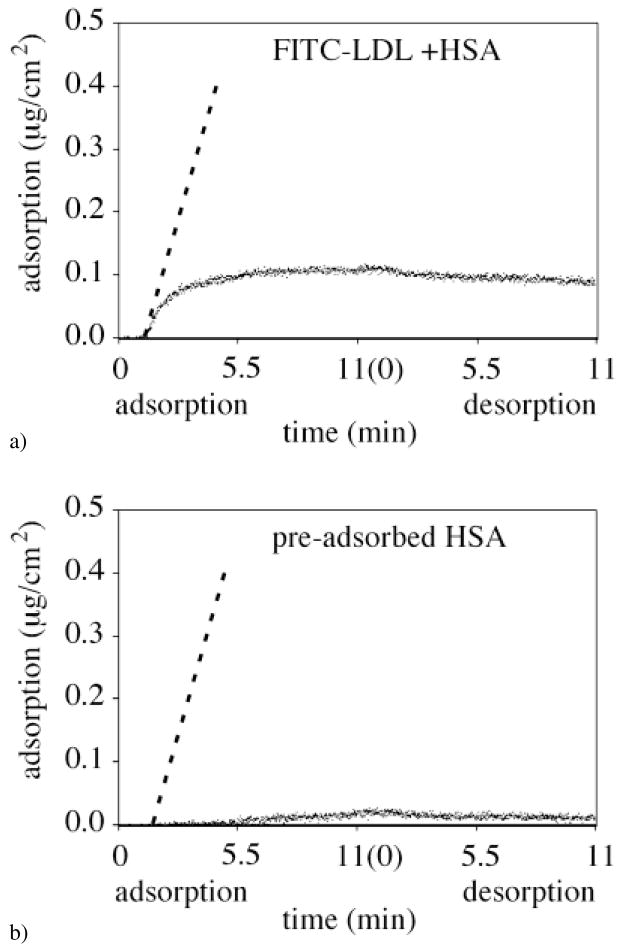
Even in the case of co-adsorption of FITC-LDL and HSA on silica, the initial FITC-LDL adsorption rate was found to coincide with the calculated flux of LDL (Fig. 4a, the calculated dA/dt slope is shown as dashed line). One concludes that the LDL adsorption was still transport-limited in spite of the presence of HSA co-adsorbing from the binary mixture (Fig. 4a). Two minutes after initial adsorption, the FITC-LDL adsorption from the binary mixture solution reached a steady-state adsorption level of ΓLDL = 0.35 μg/cm2. For the FITC-LDL adsorption onto the pre-adsorbed HSA layer on silica surface (Fig. 4b), the initial adsorption rate was no longer limited by transport, but by the availability of binding sites. Furthermore, the LDL adsorption did not attain the steady-state level during the 11 min of the adsorption time and was below the level of 0.35 μg/cm2. In this case, the likely explanation for the slow increase of the FITC-LDL adsorbed amount with time is that pre-adsorbed HSA molecules effectively blocks LDL adsorption and only desorption of pre-adsorbed HSA from silica (Fig. 3b) reveals slowly the binding sites for the LDL adsorption.
Fig. 4.
FITC-LDL adsorption/desorption kinetics onto the hydrophilic silica region of the C18-silica gradient surface (θadv = 0°) in the case of (a) co-adsorption with HSA, and (b) adsorption onto pre-adsorbed HSA. The dashed line indicates the flux of the FITC-LDL molecules to the surface calculated using Eq. 2
Figure 5 shows the effect of HSA on FITC-LDL adsorption in the wettability gradient region (θadv = 50°). The initial slope of FITC-LDL adsorption from the binary FITC-LDL + HSA solution mixture appeared to be transport-limited only at the very early adsorption times (dA/dt slope is indicated with a dashed line), then it became adsorption-limited and finally reached a steady-state adsorption level at approximately ΓLDL = 0.1 μg/cm2 (Fig. 5a). A very slow LDL adsorption was observed onto the pre-adsorbed HSA in the wettability gradient region (Fig. 5b).
Fig. 5.
FITC-LDL adsorption/desorption kinetics onto the wettability gradient region of the C18-silica gradient surface (θadv = 50°, fractional surface coverage of C18 groups, Θ/Θmax(C18) = 0.25) in the case of (a) co-adsorption with HSA, and (b) adsorption onto pre-adsorbed HSA. The dashed line indicates the flux of the FITC-LDL molecules to the surface calculated using Eq. 2
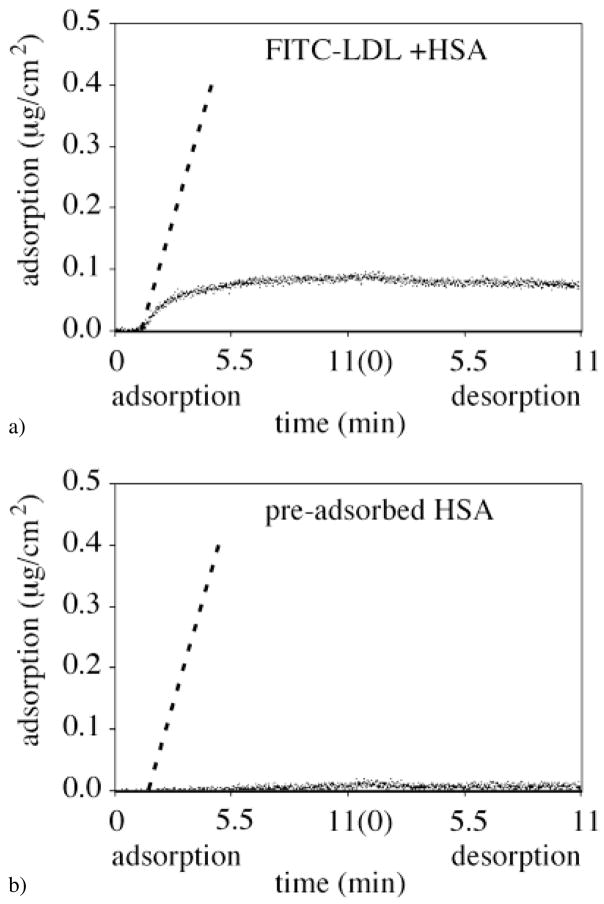
Figure 6 illustrates the FITC-LDL adsorption onto the C18 self-assembled monolayer region (θadv = 104°) from the binary FITC-LDL + HSA mixture (Fig. 6a) and onto the pre-adsorbed HSA (Fig. 6b). The initial slope of FITC-LDL adsorption from the binary mixture appeared to be adsorption-limited at the very early adsorption times. The adsorption reached a steady state level of approximately ΓLDL = 0.08 μg/cm2 (Fig. 6a). A very low FITC-LDL adsorption onto the HSA pre-adsorbed C18 SAM surface was observed (Fig. 6b).
Fig. 6.
FITC-LDL adsorption/desorption kinetics onto the hydrophobic C18 self-assembled monolayer region of the C18-silica gradient surface (θadv = 104°, fractional surface coverage of C18 groups, Θ/Θmax(C18) = 0.90) in the case of (a) co-adsorption with HSA, and (b) adsorption onto pre-adsorbed HSA. The dashed line indicates the flux of the FITC-LDL molecules to the surface calculated using Eq. 2
3.4 Analysis of lipoprotein adsorption kinetics
We have shown previously that a simple adsorption model [38], when modified by the probability factors for finding either the silica or the C18 binding site, could accurately account for the observed LDL adsorption kinetics along the C18-silica gradient [21 39]:
| (3) |
where Θ/Θmax(C18) is the probability of finding a C18 site along the gradient and (1 − Θ/Θmax(C18)) is the probability of finding a silica site and, respectively. Θ is the C18 surface coverage calculated from Eq. 1 from the experimental water contact angles, and Θmax(C18) is the maximum C18 surface coverage. kon and koff are the intrinsic adsorption and desorption rate constants, Γmax is the adsorbed amount at the maximum surface coverage, Γ(t) is the adsorbed amount per unit surface at time t, (1 − Gamma; (t)/Gamma;max) is the fraction of unoccupied adsorption sites, and c(0,t) is the protein concentration right next to the adsorbing surface. Equation 3 simply adds the LDL adsorption on the hydrophobic (subscript (C18)) and hydrophilic (subscript (sil)) surface sites, respectively, after weighting each adsorption process according to the probability of finding a given adsorption site. We have found that the two sets of rate constants (kon(sil), koff(sil) and kon(C18), koff(C18)) were sufficient to predict FITC-LDL adsorption along the C18-silica gradient from a single protein solution by using Eq. 3 [21].
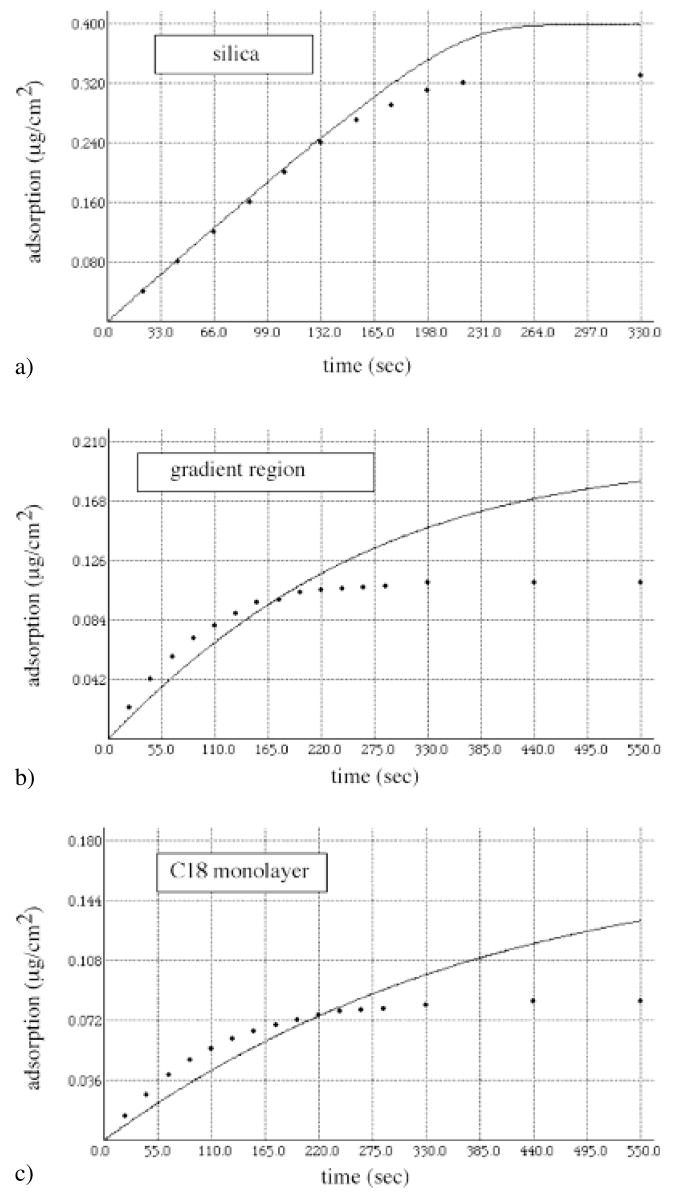
It is instructive to compare the FITC-LDL adsorption from the single protein solution with the adsorption from the binary solution mixture of FITC-LDL + HSA. This comparison is shown in Figs 7a–c. The solid lines in Figs. 7a–c represent the LDL adsorption from the single protein solution as predicted by the model (Eq 3) [21]; the dots represent the results abstracted from the FITC-LDL + HSA co-adsorption experiments (i. e. from Figs 4a, 5a and 6a). The differences in FITC-LDL + HSA and FITC-HSA adsorption vary for the three positions along the C18-silica gradient. In the case of hydrophilic silica (Fig. 7a), the only difference appears to be in the steady-state level of the FITC-LDL adsorption, which is lower in the case of adsorption from the binary solution mixture. HSA is a smaller molecule and is likely to reach the surface much faster than LDL (Fig. 3a) [5]. In the binary solution mixture HSA is also present at much higher concentration than FITC-LDL. However, the HSA adsorption affinity for hydrophilic silica is probably weaker (Fig. 3a) than the binding of LDL (for silica KLDL = 6.5 · 109 M−1 [21]). It is interesting to note that the LDL adsorption from the binary mixture onto silica only shows a decreased level of steady-state adsorption and not any competitive exchange of adsorbed HSA (or LDL) with newly arriving LDL (or HSA) protein molecules. The absence of any competitive exchange is an indication that the desorption rates for both proteins are quite similar. Furthermore, the FITC-LDL adsorption rate constant is still large enough compared with the flux of FITC-LDL to the surface so that the FITC-LDL adsorption remains transport-limited. As expected, the deviation from the transport-limited rate starts earlier in the case of LDL + HSA co-adsorption than in the case of LDL adsorption from single protein solution (Fig. 7a).
Fig. 7.
Comparison between the experimental FITC-LDL adsorption kinetics from a binary solution mixture (FITC-LDL + HSA)(dots) and the prediction of the LDL adsorption from the single protein solution based on the model (Eq. 3)(solid lines). (a) hydrophilic silica region (θadv = 0°), (b) C18 gradient region (θadv = 50°, Θ/Θmax(C18) = 0.25), and (c) hydrophobic C18 self-assembled monolayer (θadv = 1048, Θ/Θmax(C18) = 0.90)
A more intriguing adsorption results were observed in the wettability gradient region (θadv = 50°) and in the case of C18 SAM surface (θadv = 104°) (Fig. 7b–c). In both cases, the ad-sorption of FITC-LDL from the binary solution mixture is initially faster than the respective FITC-LDL adsorption from the single protein solution (but still slower than, or equal to, dA/dt; Eq 2). This peculiar effect is obviously related to the state of adsorbed HSA. We have found that HSA binds to hydrophobic C18-modified silica surface with a much higher affinity than LDL (K HSA(C18) > 2.59 · 109M−1 vs. KLDL(C18) = 4.9 · 108M−1) [14]. The higher affinity of HAS alone can not explain the initially faster FITC-LDL adsorption rate. We hypothesize that the HSA adsorption onto the C18 SAM transiently exposes a new binding site onto which the FITC-LDL particle binds. According to this hypothesis the HSA adsorption results in the two different populations of adsorbed HSA molecules: one that is transiently capable of binding FITC-LDL in early adsorption time, and other that blocks the FITC-LDL adsorption. Recall that the initial LDL adsorption rate from binary mixture was faster than the adsorption rate in absence of HSA and was also identical to dA/dt, Eq. 2. The hypothesis also implies that a widely accepted assumption of proteins adsorption up to a saturating monolayer does not have to be always valid: it is possible that during their co-adsorption protein molecules adsorb to the underlying surface and to each other. The absence of FITC-LDL adsorption to the pre-adsorbed HSA layer suggest that a longer HSA residence time at the hydrophobic C18 SAM surface eliminates these transiently exposed FITC-LDL binding sites.
4 Summary
The primary goal of using C18-silica gradient surface was to screen the effect of surface hydrophobicity on the co-adsorption of LDL and HSA. The results from two sets of adsorption experiments of FITC-LDL adsorption onto the C18 gradient surface are described: (1) FITC-LDL adsorption from the LDL and HSA solution mixture, and (2) FITC-LDL adsorption onto the HSA pre-adsorbed on the C18-silica gradient surface. Experiments with FITC-HSA were performed in parallel. It was found that FITC-LDL preferred to be adsorbed on the hydrophilic silica surface. The LDL transport-limited adsorption kinetics onto negatively charged silica was not diminished by the co-adsorption of HSA. The adsorption of lipoprotein onto the HSA pre-adsorbed silica surface, however, was slower than the transport-limited adsorption rate, a feature attributed to a slow exposure of lipoprotein binding sites by the process of HSA desorption.
In the region of increasing surface density of C18 groups, the FITC-LDL adsorption was slower than the transport-limited adsorption rate, except in the very early adsorption times. The pre-adsorption with HSA resulted with a significant decrease of the FITC-LDL adsorption rate and the adsorbed amount. FITC-LDL showed the least adsorption onto the C18 SAM region which, when pre-coated with HSA, almost completely eliminated its binding.
Comparison between the FITC-LDL adsorption from single protein and binary mixture (LDL + HSA) solutions in the wettability gradient and C18 SAM surface regions revealed an interesting effect of HSA co-adsorption: the FITC-LDL adsorption rate was initially faster in the case of co-adsorption with HSA that from the FITC-LDL single protein solution. We speculate that adsorbed HSA molecules transiently expose a binding site onto which LDL molecules can bind.
Acknowledgments
This work was supported by the NIH grant HL44538 and the Center for Biopolymers at Interfaces, University of Utah. The authors gratefully thank Dr. Lily Wu (University of Utah) for help in isolating human lipoproteins. They also thank all blood donors for providing the source of LDL.
References
- 1.Andrade JD. Surface and Interfacial Aspects of Biomedical Polymers 2. In: Andrade JD, editor. Protein Adsorption. Plenum Press; New York: 1985. pp. 1–79. [Google Scholar]
- 2.Andrade JD, Hlady V. Adv. Polym Sci. 1986;79:1. [Google Scholar]
- 3.Malmsten M, editor. Biopolymers at Interfaces. M. Dekker, Inc; New York: 1998. p. 656. [Google Scholar]
- 4.Schwick HG, Haupt H. In: The plasma proteins: structure, function, and genetic control. Putnam FW, editor. New York: 1985. pp. 1–168. [Google Scholar]
- 5.Andrade JD, Hlady V. Ann. N Y Acad Sci. 1987;516:158. doi: 10.1111/j.1749-6632.1987.tb33038.x. [DOI] [PubMed] [Google Scholar]
- 6.Gotto AM Jr, editor. Plasma Lipoproteins. Elsevier; Amsterdam: 1987. p. 405. [Google Scholar]
- 7.Utermann G. Science. 1989;246:904. doi: 10.1126/science.2530631. [DOI] [PubMed] [Google Scholar]
- 8.Miles LA, Fless GM, Levin EG, Scanu AM, Plow EF. Nature. 1989;339:301. doi: 10.1038/339301a0. [DOI] [PubMed] [Google Scholar]
- 9.Hajjar KA, Gavish D, Breslow JL, Nachman RL. Nature. 1989;339:303. doi: 10.1038/339303a0. [DOI] [PubMed] [Google Scholar]
- 10.Simon DI, Fless GM, Scanu AM, Loscalzo J. Biochemistry. 1991;30:6671. doi: 10.1021/bi00241a006. [DOI] [PubMed] [Google Scholar]
- 11.Elwing H, Welin S, Askendahl A, Nilsson U, Lundstrom I. J Colloid Interface Sci. 1987;119:203. [Google Scholar]
- 12.Hlady V. Appl. Spectroscopy. 1991;45:246. [Google Scholar]
- 13.Golander C-G, Lin Y-L, Hlady V, Andrade JD. Colloids and Surfaces. 1990;49:289. doi: 10.1016/0927-7765(93)01114-7. [DOI] [PMC free article] [PubMed] [Google Scholar]
- 14.Lin Y-L, Hlady V. Colloids and Surfaces B: Biointerfaces. 1994;2:481. doi: 10.1016/0927-7765(94)80056-1. [DOI] [PMC free article] [PubMed] [Google Scholar]
- 15.Breemhaar W, Brinkman E, Ellens DJ, Beugeling T, Bantjes A. Biomaterials. 1984;5:269. doi: 10.1016/0142-9612(84)90071-1. [DOI] [PubMed] [Google Scholar]
- 16.Shen BW. J Biol Chem. 1985;260:1032. [PubMed] [Google Scholar]
- 17.Dong DE, Andrade JD, Coleman DL. J Biomed Mater Res. 1987;21:683. doi: 10.1002/jbm.820210602. [DOI] [PubMed] [Google Scholar]
- 18.Hlady V, Rickel J, Andrade JD. Colloids and Surfaces. 1989;34:171. [Google Scholar]
- 19.Poot A, Beugeling T, van-Aken WG, Bantjes A. J Biomed Mat Res. 1990;24:1021. doi: 10.1002/jbm.820240805. [DOI] [PubMed] [Google Scholar]
- 20.Healy KE, Ducheyne P. ASAIO Trans. 1991;37:M150. [PubMed] [Google Scholar]
- 21.Ho C-H, Hlady V. In: Protein at Interfaces 1994. Brash J, Horbett T, editors. ACS; Washington, D.C: 1997. pp. 371–384. [Google Scholar]
- 22.Ho C-H, Britt DW, Hlady V. J Molecular Recognition. 1997;9:444. doi: 10.1002/(sici)1099-1352(199634/12)9:5/6<444::aid-jmr281>3.0.co;2-i. [DOI] [PubMed] [Google Scholar]
- 23.Mills GL, Cane PA, Weech PK. In: A guidebook to lipoprotein technique, Laboratory techniques in biochemistry and molecular biology. Burkon RH, van Knippenberg PH, editors. Elsevier; Amsterdam: 1976. p. 18. [Google Scholar]
- 24.Lowry OH, Rosebrough NJ, Farr AL, Randall RJ. J Biol Chem. 1951;193:265. [PubMed] [Google Scholar]
- 25.Peterson GL. Anal Biochem. 1977;83:346. doi: 10.1016/0003-2697(77)90043-4. [DOI] [PubMed] [Google Scholar]
- 26.Soutar AK, Myant NB. In: International Review of Biochemistry, Chemistry of Macromolecules IIB. Offed RE, editor. University Park Press; Baltimore: 1987. p. 55. [Google Scholar]
- 27.Coons AM, Crech HJ, Jones RN, Berliner EJ. J Immunology. 1942;45:59. [Google Scholar]
- 28.Wells AF, Miller CE, Nadel MK. Appl. Microbiol. 1966;14:271. doi: 10.1128/am.14.2.271-275.1966. [DOI] [PMC free article] [PubMed] [Google Scholar]
- 29.Shepherd J, Bedford DK, Mogan HG. Clin Chim Acta. Vol. 66 1976. [Google Scholar]
- 30.Andrade JD, Smith LM, Gregonis DE. In: Surface and Interfacial Aspects of Biomedical Polymers. Andrade JD, editor. Plenum; New York: 1985. pp. 249–292. [Google Scholar]
- 31.Epperson PM, Bonner Denton M. Anal. Chem. 1989;61:1513. [Google Scholar]
- 32.Ho CH, Hlady V, Nyquist G, Andrade JD, Caldwell KD. J Biomed Mater Res. 1991;25:423. doi: 10.1002/jbm.820250402. [DOI] [PubMed] [Google Scholar]
- 33.Lin YS, Hlady V, Janatova J. Biomaterials. 1992;13:449. doi: 10.1016/0142-9612(92)90100-3. [DOI] [PubMed] [Google Scholar]
- 34.Cassie ABD, Baxter S. Trans. Faraday Soc. 1944;40:546. [Google Scholar]
- 35.Ulman AJ. J Mat Ed. 1989;11:205. [Google Scholar]
- 36.Lok BK, Cheng Y-L, Robertson CR. J Colloid Interface Sci. 1983;91:87. [Google Scholar]
- 37.Lok BK, Cheng Y-L, Robertson CR. J Colloid Interface Sci. 1983;91:104. [Google Scholar]
- 38.Corsel JW, Willems GM, Kop JMM, Cuypers PA, Hermens WT. J Colloid Interface Sci. 1986;111:544. [Google Scholar]
- 39.Hlady V, Ho C-H, Britt DW. In: Interfacial Dynamics. NK, editor. M. Dekker Inc; New York: 1999. pp. 405–418. [Google Scholar]


