

Abstract
Background
A more accurate taxonomy of small intestinal (SI) neuroendocrine tumors (NETs) is necessary to accurately predict tumor behavior, prognosis and define therapeutic strategy. We identified a panel of such markers implicated in tumorogenicity, metastasis, and hormone production and hypothesized that transcript levels of MAGE-D2, MTA1, NAP1L1, Ki-67, Survivin, FZD7, Kiss1, NRP2, and CgA could be used to define primary SI NETs and predict the development of metastases.
Methods
Seventy three clinically and World Health Organization (WHO) pathologically classified NET samples (primary: n=44; liver metastases: n=29) and 30 normal human Enterochromaffin (EC) cell preparations were analyzed using real-time PCR. Transcript levels were normalized to three NET house-keeping genes, ALG9, TFCP2 and ZNF410, using GeNorm. A predictive gene-based model was constructed using supervised learning algorithms from the transcript expression levels.
Results
Primary SI NETs could be differentiated from normal human EC cell preparations with 100% specificity and 92% sensitivity. Well-differentiated NETs (WDNETs), well-differentiated neuroendocrine carcinomas (WDNECs), and poorly differentiated NETs (PDNETs) were classified with specificities of 78%, 78%, and 71% respectively, while poorly differentiated neuroendocrine carcinomas (PDNECs) were misclassified as either WDNETs or PDNETs. Metastases were predicted in all cases with 100% sensitivity and specificity.
Conclusions
Gene expression profiling and supervised machine learning can be used to classify SI NET subtypes and accurately predict metastasis. Application of this technique will facilitate accurate molecular pathological delineation of NET disease, better define its extent and facilitate the assessment of prognosis as well as providing a guide to identification of an appropriate strategy for individualized patient treatment.
Keywords: algorithm, gene, neuroendocrine, predict, real-time PCR
Introduction
The precise pathological classification of small intestinal (SI) neuroendocrine tumors (NETs) is important since individual histopathological subtypes are associated with distinct clinical behavior 1. However, the difficulty of definitive histopathological assessment of specific tumors has limitations and in some circumstances does not provide a completely reliable prediction of behavior. Nevertheless, current pathological classifications of lesions remain the basis for the identification of tumor type, prediction of biological behavior and delineation of treatment strategy. The classification criteria adopted by the World Health Organization (WHO) in 2000 for NETs utilizes size, proliferative rate, localization, differentiation, and hormone production 2. A distinction is made between well differentiated NETs (WDNETs) (benign behavior or uncertain malignant potential), well differentiated neuroendocrine carcinomas WDNECs (low-grade malignancy), poorly differentiated neuroendocrine tumors (PDNETs) medium-grade malignancy, and poorly differentiated (usually small cell) neuroendocrine carcinomas (PDNECs) of high-grade malignancy. This system has not been widely adopted and alternatives have been proposed although all rely upon parameters that are open to observer variation and interpretation.
Diagnostic pathology has traditionally relied on macro- and microscopic histology and tumor morphology as the basis for tumor classification. Current classification frameworks, however, are not validated and are unable to accurately discriminate among tumors with similar histopathologic features, which may vary substantially in clinical course and in response to treatment 3. This reflects either incorrect classification or the fact that an individual lesion may evolve into a different type of NET pattern or that there may exist within one tumor more than one phenotype 4. The recognition of these limitations has led to an interest in modifying the basis of tumor classification from a purely morphologic stratification to a system that includes molecular parameters predictive of biological behavior. The myriad of genes and their permutations and commutations in neoplastic lesions has, however, proved difficult to investigate and conventional analysis renders the assessment of the relevance of changes intricate and complex to quantify. The advent of machine learning offers a logical approach for developing sophisticated, automatic, and objective algorithms for the analysis of high-dimensional and multimodal biomedical data. In several studies, Support Vector Machines (SVM), a variant of the supervised learning algorithm, have been used to predict the grading of astrocytomas 5 with a >90% accuracy, and prostatic carcinomas with an accuracy of 74–80% 6. A similar predictive tool, Decision Trees, has also been demonstrated to have utility (70–90%) in predicting the prognosis of metastatic breast cancer 7 as well as colon cancer 8.
The effectiveness of such mathematical tools is, however, dependent upon selection of the appropriate variables (genes/biomedical data e.g. serum hormone levels) which, in any classification model, is a crucial requirement that determines the success of a predictive algorithm. While microarray-based approaches have been employed in classifying leukemia subtypes 9 and endocrine tumors 10, identifying a reliable selection of gene candidates is difficult due to the high opportunity for errors arising from the intrinsic “curse of dimensionality”, variability present in any microarray readout, as well as the complexity (difficulty) of finding appropriate normalization standards 11. Real time-PCR is considered the gold standard to validate microarray-data. Such an approach is highly reproducible, has a greater dynamic range than microarray technology and can detect small changes in data, and is easy to introduce into a clinical laboratory 12. In this study, we hypothesized that transcript levels of a panel of markers that we and others have implicated in tumorogenicity, metastasis, and hormone production of NETs - MAGE-D2, MTA1, NAP1L1, Ki-67, Survivin, FZD7, Kiss1, NRP2, and CgA 13–19 - could be used to classify primary SI NETs and predict the development of metastases. We performed extensive transcript-level analysis and implemented supervised learning algorithms to construct a model using the regulatory genotype (adhesion, migration, proliferation, apoptosis, metastasis and hormone secretion) that underlies SI NET subtypes for the development of a predictive gene-based model.
Materials and Methods
Collection of Samples
A total of 53 clinically annotated SI NETs (frozen biobank, all tumors classified as functional; tissues microdissected, >80% pure neoplastic cells) and 13 normal human EC cell preparations (obtained from FACS sorting normal mucosa; >98% pure EC cells 20) were collected for real-time PCR analysis. The clinical data set contained primary SI NETs (n=36), and liver metastases from corresponding primary tumor types (n=17). Tumors were pathologically classified according to the WHO standards as WDNET (n=18), WDNEC (n=9), PDNET (n=7), PDNEC (n=2). Metastatic (MET) tissue (all collected from liver specimens) from the corresponding tumor types was classified in the similar fashion: WDNET MET (n=6), WDNEC MET (n=8), and PDNEC MET (n=3). No samples of PDNET metastases were collected. All patients were enrolled according to protocols approved by the institutional review board of Yale University.
Real-time PCR
RNA was extracted (TRIZOL®, Invitrogen, USA) 21 from the training set consisting of 36 primary tumors, 17 liver metastases, and 13 normal human EC cell preparations. Additional RNA was extracted from the independent test set consisting of normal EC cell preparations (n=17), localized SI NETs (n=8), and malignant SI NETs (n=12). All tumor samples were described as functional NETs. Transcript levels of the 9 identified marker genes (MAGE-D2, MTA1, NAP1L1, Ki-67, Survivin, FZD7, Kiss1, NRP2, and CgA 13, 14) were measured using Assays-on-Demand™ products and the ABI 7900 Sequence Detection System according to the manufacturer’s suggestions 21. Cycling was performed under standard conditions (TaqMan® Universal PCR Master Mix Protocol) and raw ΔCT values normalized using geNorm22 and expression of the novel house-keeping genes, ALG9, TFCP2 and ZNF41023. Normalized data were natural log (ln)-transformed for compression.
Predictive Analysis
Transformed data were imported into Partek® Genomic Suite 24. Principal Component Analysis (PCA) was used to visualize patterns present in the data and determine whether or not individual tumor subtypes as well as normal EC cell transcript profiles could be differentiated. Additionally, mean expression values (M) and Standard Deviations (SD) of each marker gene were measured in tumor subtypes and normal EC cell preparations. Subsequently, Analysis of Variance (ANOVA) was performed to identify gene expressions that were significantly (p<0.05) changed between normal EC cell preparations and primary tumor tissues, as well as between normal EC cell preparations and specific tumor types. Classification was performed using supervised learning algorithms – Support Vector Machines (SVM), Decision Tree, and Perceptron 25. Feature Selection (FS) was used to chose the best subset of features for the robust learning models 26.
Feature Selection
When applied to biology, this algorithm removes the most redundant features from a data set which enhances the generalization capability, accelerates the learning process and improves model interpretability 26. We used a “greedy forward” selection approach to select the most relevant subset 26.
Principal Component Analysis
This exploratory technique is used to describe the structure of high dimensional data by reducing its dimensionality to uncorrelated principal components (PCs) that explain most variations in the data 27. PCA mapping was visualized in a 3-dimentional space where X-, Y-, and Z-axis represent 1st, 2nd, and 3rd PCs respectively.
Analysis of Variance
A two-class unpaired algorithm was implemented with tumor types and normal EC cell preparations defining the two groups. There were no missing values in our dataset therefore imputation was unnecessary. Geometric Fold Change (FC) was calculated as the ratio of geometric means of the Tumor Group and the Normal Group. Genes with expression p<0.05 (between normal and tumor) were considered significantly changed.
Support Vector Machines
This algorithm attempts to classify the data by increasing the margin between the n data sets 28. Radial basis function was used as a kernel and a 10-fold cross-validation was used to measure the sensitivity of classification 28. Previous studies have utilized this method to predict the grading of astrocytomas 5 with a >90% accuracy, and prostatic carcinomas with an accuracy of 74–80% 6.
Decision Tree
This is a predictive model that maps observations about an item to a conclusion about its target value 29. The leaves of the tree represent classifications and branches represent conjunctions of features that devolve into the individual classifications. A 10-fold cross-validation was used to measure the efficiency of this technique 30. In previous studies this approach was effective (70–90%) in predicting prognosis of metastatic breast cancer 7 as well as colon cancer 8.
Perceptron
This is a linear classifier that forms a feed forward neural network and maps an input variable to a binary classifier 25. Three data scans were used to generate the decision boundaries that explicitly separate data into classes. A learning rate of 0.05 (this constant regulates the speed of learning. A lower learning constant improves the classification model at the expense of the time it takes to process the variable) was used 31. This algorithm was used to distinguish between localized tumors and the corresponding metastases. This methodology has previously been shown to be effective in predicting malignancy of breast cancer 31.
Results
1. Gene Expression Profiling in the Primary Tumor
To determine whether primary SI NETs, normal EC cell preparations, and respective metastases could be differentiated, PCA was used to reduce real-time PCR expressions of the 9 marker genes into three PCs that reflect most of the variance in the dataset. In primary SI NETs and normal EC cell preparations, 31.7% of the variance was represented by PC#1, 26.5% by PC#2, and 17.4% by PC#3; overall 75.6% of the variance was represented by all 3 PCs (Figure 1A). In metastases, 40.4% of the variance was represented by PC#1, 19.9% by PC#2, and 12.9% by PC#3; overall 73.2% of the variance in the data was represented by all 3 PCs (Figure 1C). The distance between the centroids (“centers of mass”) for each tumor subtype in the three dimensions represents the relative similarity of their regulatory signatures (transcript expression levels). As assessed by this method, the individual tumor subtypes, normal EC cell preparations, and SI NET metastases have distinct regulatory signatures. PCA analysis also identified clusters of related gene expressions, which are associated with the cosine of the angle between individual expression vectors 32. Thus, in primary SI NETs, related gene clusters are as follows: 1) CgA, NRP2, NAP1L1, FZD7; 2) MAGE-D2, MTA1, Kiss1; 3) Ki-67, Survivin (Figure 1B). In corresponding metastases, the related groups are: 1) NAP1L1, FZD7, CgA, Survivin, Ki-67, Kiss1; 2) MTA1, MAGE-D2, NRP2 (Figure 1D).
Figure 1. Principal Component Analysis of primary Small Intestinal Neuroendocrine Tumors, metastases and normal EC cells.
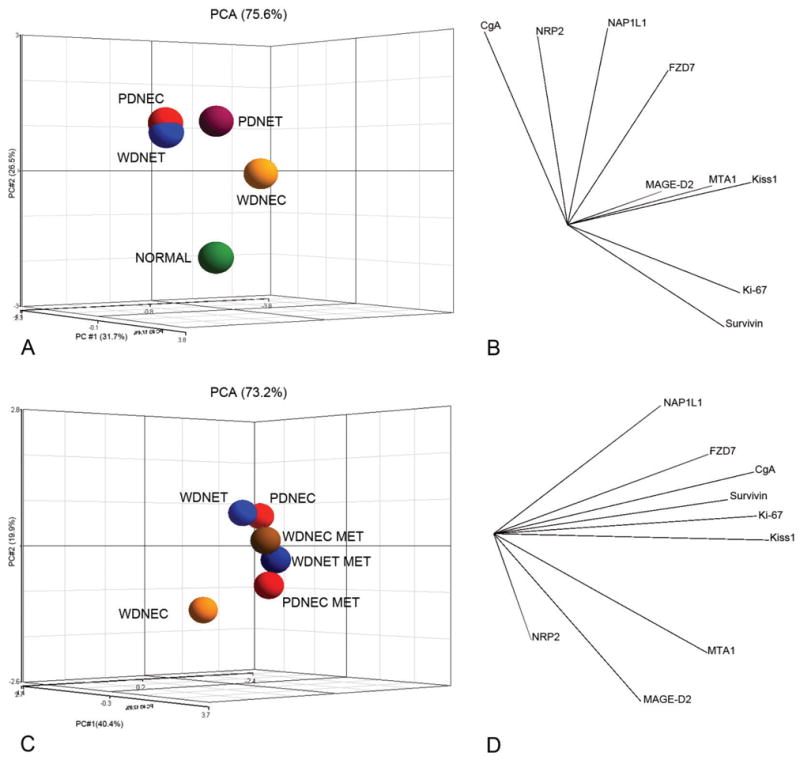
Ln-normalized real-time PCR expressions of MAGE-D2, MTA1, NAP1L1, Ki-67, Survivin, FZD7, Kiss1, NRP2, and CgA were reduced to 3 Principal Components representing 75.6% of variance in primary tumor subtypes and normal EC cell preparations (1A) and 73.2% of variance in primary tumor subtypes and their corresponding metastases (1C). Average expression for the samples was superimposed and the resulting distance of separation between individual species is inversely equivalent to the similarity measure (greater distance = less similarity). In primary tumors and normal EC cells, three groups of genes with similar expression patters were observed 1) CgA, NRP2, NAP1L1, FZD7; 2) MAGE-D2, MTA1, Kiss1; 3) Ki-67, Survivin (1B). In corresponding metastases, only two groups were identified: 1) NAP1L1, FZD7, CgA, Survivin, Ki-67, Kiss1; 2) MTA1, MAGE-D2, NRP2 (1D). The correlation between the marker genes is inversely equivalent to the cosine of the angle between individual expression vectors (greater angle = less similarity). This analysis demonstrates that profiles of normal EC cells, primary NET subtypes, and metastases could be distinguished by the expressions of selected marker genes.
In the next analysis, the mean expression level of each marker gene in primary tumor subtypes and normal EC cell preparations was calculated. Mean transcript expressions in normal EC cell preparations of CgA (MNormal = −9.2, SD = 4.2), Ki-67 (MNormal = −4.5, SDNormal = 1.1), Kiss1 (MNormal = −4.0, SDNormal = 3.2), NAP1L1 (MNormal = −8.3, SDNormal = 1.1), NRP2 (MNormal = −9.3, SD = 3.8), and Survivin (MNormal = −6.0, SDNormal = 1.0) were significantly (p<0.01) different from primary tumors (Table 1). To evaluate the reproducibility of the real-time PCR approach, measurement of target transcript expression levels was re-evaluated in a subset of samples (n=35). The data from the was highly correlated (R2=0.93, p=0.001) demonstrating this approach was both highly reproducible and robust.
Table 1.
ANOVA results across Small Intestinal Neuroendocrine Tumor subtypes and normal EC cells.
| All Tumors-Normal | WDNET-Normal | WDNEC-Normal | PDNET-Normal | PDNEC-Normal | ||||||
|---|---|---|---|---|---|---|---|---|---|---|
| Gene | p | FC | p | FC | p | FC | p | FC | p | FC |
| CgA | 1.3×10⁻⁴ | 17.7 | 1.05×10⁻⁴ | 28.3 | 0.03 | 8.3 | 0.01 | 13.5 | NS | 20.5 |
| FZD7 | 0.05 | 3.6 | 0.02 | 5.9 | NS | −1.1 | NS | 5.5 | NS | 6.9 |
| Ki-67 | 1.1×10⁻³ | −3.5 | 0.01 | −3.0 | 0.02 | −3.5 | 2.7×10⁻³ | −5.5 | NS | −3.7 |
| Kiss1 | 0.02 | −3.9 | 0.05 | −3.7 | NS | −4.5 | NS | −4.4 | NS | −1.8 |
| MAGE-D2 | NS | 1.2 | NS | −1.6 | 6.4×10⁻⁴ | 5.3 | NS | 1.6 | NS | −1.8 |
| MTA1 | NS | −1.2 | NS | −1.5 | NS | 1.1 | NS | 1.1 | NS | −1.6 |
| NAP1L1 | 4.7×10⁻⁵ | 13.7 | 4.1×10⁻⁶ | 24.8 | NS | 2.9 | 7.4×10⁻⁴ | 17.3 | 0.01 | 26.9 |
| NRP2 | 2.2×10⁻⁸ | 39.5 | 1.6×10⁻⁶ | 31.5 | 2.3×10⁻⁵ | 33.7 | 1.9×10⁻⁶ | 82.08 | 5.0×10⁻³ | 47.1 |
| Survivin | 0.01 | −3.5 | 0.04 | −3.1 | NS | −3.1 | 0.02 | −5.1 | NS | −5.07 |
WDNET = Well Differentiated Neuroendocrine Tumors, WDNEC = Well Differentiated
Neuroendocrine Carcinomas, PDNET = Poorly Differentiated Neuroendocrine Tumors, PDNEC = Poorly Differentiated Neuroendocrine Carcinomas
NS = Non-significant (p≥0.05), FC = Fold Change
We then utilized ANOVA to measure the change in transcript levels across tumor subtypes and normal EC cell preparations (Table 1). Only transcripts with p<0.05 and absolute FC≥2.0 were considered differentially expressed. CgA, FZD7, Ki-67, NAP1L1, NRP2, and Survivin were significantly altered in WDNETs compared to normal EC cell preparations. Transcript levels of CgA, Ki-67, MAGE-D2, and NRP2 were significantly changed in WDNECs. PDNETs displayed alternatively expressed levels of CgA, Ki-67, NAP1L1, NRP2, and Survivin. Finally, PDNECs were different only in expressions of NAP1L1 and NRP2.
To determine if the distribution of the primary tumor subtypes and normal EC cell preparations could be linearly separated, correlation coefficients for each marker gene pair were computed (Figure 2). Of note, MTA1:MAGE-D2, MTA1:Kiss1, FZD7:NAP1L1, and Survivin:Ki-67 correlation pairs were determined to be highly linear (R2 > 0.50). Additionally, distribution of WDNETs, WDNEC, and PDNETs was linear as determined by the pair-wise expressions of Kiss1:Survivin, FZD7:NAP1L1, Survivin:MTA1, and MTA1:MAGE-D2. These findings indicate that a linear classifier could be further applied to the dataset.
Figure 2. Similarity Matrix using Pearson Correlation of the marker gene expressions in primary Small Intestinal Neuroendocrine Tumors and normal EC cells.

Ln-normalized real-time PCR expressions of MAGE-D2, MTA1, NAP1L1, Ki-67, Survivin, FZD7, Kiss1, NRP2, and CgA were plotted onto X- and Y-axis to determine the presence or absence of linear relationships between individual gene pairs and to identify whether tumor subtype differentiation was expression-dependant. Expression levels of transcript pairs MTA1:MAGE-D2, MTA1:Kiss1, FZD7:NAP1L1, and Survivin:Ki-67 pairs were highly correlated (R2 > 0.50). Additionally, distribution of WDNETs, WDNEC, and PDNETs is linearly correlated to the expressions of Kiss1:Survivin, FZD7:NAP1L1, Survivin:MTA1, and MTA1:MAGE-D2. This suggests an expression-dependant correlation between the selected marker genes and primary tumor subtypes.
2. Prediction of Malignancy
Differentiating between Normal EC cell preparations and Primary SI NETs
SVM performed best in differentiating normal EC cell preparations (n=13) and the primary SI-NETs (n=36). Feature selection identified NAP1L1, FZD7, Kiss1 and MAGE-D2 as the best variables for the classification model. Scatter plots of the SI NETs and normal EC cells colorized to the density of the samples produced differential zones that depended on the individual gene expressions (Figure 3). SVM predicted SI NETs with the 100% sensitivity and 92% specificity (Figure 3). 77% of normal EC cell preparations were predicted accurately and the class specificity was 100% (Table 2).
Figure 3. Density Map of distributions between normal EC cells and Small Intestinal Neuroendocrine Tumors.
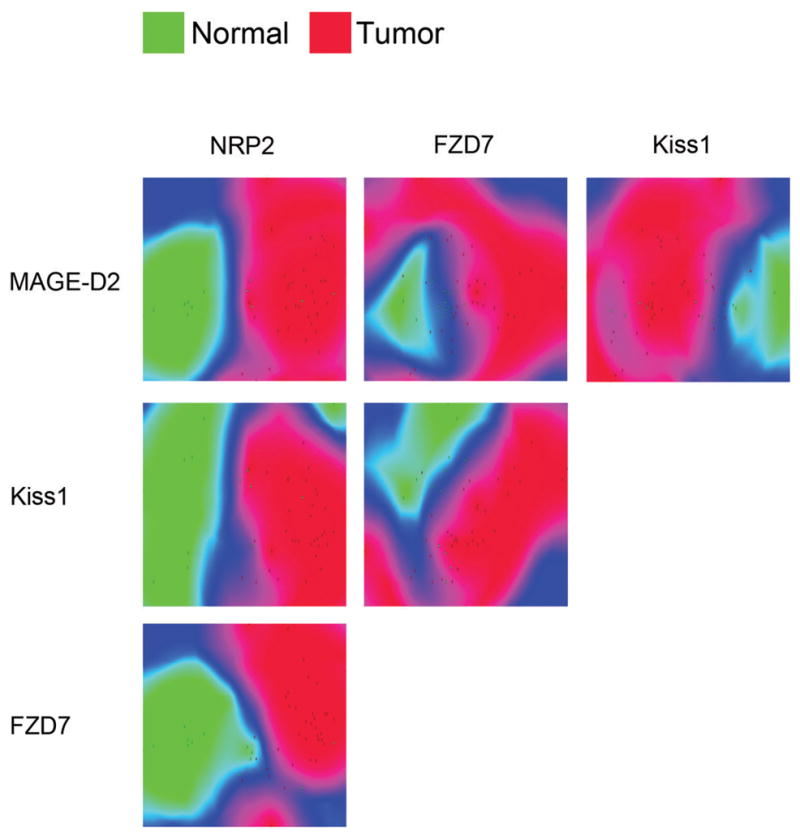
Expression levels of NRP2, MAGE-D2, Kiss1, and FZD7 transcripts as identified by the Feature Selection algorithm were plotted on the X- and Y-axis. Normal and neoplastic samples were scattered according to their respective gene pair expressions. Distribution densities based on average Euclidean distance (difference in expression) between samples were colorized green (normal) and red (neoplastic). Blue areas indicate a region of transition between normal and neoplastic groups. The distinct separation between normal EC cells and primary small intestinal tumors indicates the utility of the selected transcripts as malignancy markers.
Table 2.
Class predictions produced by the Support Vector Machines classification model using transcript expression levels of NAP1L1, FZD7, Kiss1, and MAGE-D2.
| True Normal | True Tumor | Class Precision | |
|---|---|---|---|
| Pred. Normal | 10 | 0 | 100% |
| Pred. Tumor | 3 | 36 | 92% |
| Class Recall | 77% | 100% |
Pred. = Predicted
Prediction of Primary SI NET Subtypes
A Decision Trees classification performed best using Ki-67 and NAP1L1 as identified by FS. WDNETs were predicted with 78% sensitivity, WDNECs – 78%, PDNETs – 71%, and PDNECs were misclassified as either WDNETs or PDNETs (Figure 4). The prediction specificities for WDNETs, WDNECs, and PDNETs, were 82%, 64%, and 63% respectively (Table 3).
Figure 4. Decision Tree classifying primary Small Intestinal Neuroendocrine Tumors.

Expression levels of NAP1L1 and Ki-67 were identified as principle discriminators in the Decision Tree classifier using Feature Selection. The model was constructed by correlating values of NAP1L1 and Ki-67 to primary tumor subtypes. Percentages in parenthesis indicate the occurrence frequencies of primary small intestinal neuroendocrine tumor subtypes.
Table 3.
Class predictions produced by the Decision Trees classification model using transcript expression of Ki-67 and NAP1L1.
| True WDNET | True WDNEC | True PDNET | True PDNEC | Class Precision | |
|---|---|---|---|---|---|
| Pred. WDNET | 14 | 1 | 1 | 1 | 82% |
| Pred. WDNEC | 3 | 7 | 1 | 0 | 64% |
| Pred. PDNET | 1 | 1 | 5 | 1 | 63% |
| Pred. PDNEC | 0 | 0 | 0 | 0 | 0% |
| Class Recall | 78% | 78% | 78% | 0% |
WDNET = Well Differentiated Neuroendocrine Tumors, WDNEC = Well Differentiated
Neuroendocrine Carcinomas, PDNET = Poorly Differentiated Neuroendocrine Tumors, PDNEC = Poorly Differentiated Neuroendocrine Carcinomas
Pred. = Predicted
Prediction of Metastases of Primary SI NET Subtypes
ANOVA was performed to identify differentially expressed transcripts in primary SI NET subtypes and corresponding metastases (Table 4). Significant gain of Kiss1 (p<0.005) was associated with all tumor subtypes.
Table 4.
ANOVA results across Small Intestinal Neuroendocrine Tumor subtypes and corresponding metastases.
| WDNET-WDNET MET | WDNEC-WDNEC MET | PDNEC-PDNEC MET | ||||
|---|---|---|---|---|---|---|
| Gene | p | FC | p | FC | p | FC |
| Kiss1 | 5.7×10⁻⁷ | 52.8 | 1.2×10⁻⁷ | 81.2 | 0.004 | 41.6 |
| MAGE-D2 | 5.2×10⁻³ | 5.6 | NS | −1.04 | 0.03 | 10.4 |
| CgA | 0.02 | 9.08 | 0.01 | 12.4 | 0.08 | 21.1 |
| Ki-67 | NS | 2.7 | 0.02 | 3.7 | NS | 1.5 |
| MTA1 | 0.02 | 2.8 | NS | 1.1 | NS | 4.4 |
| Survivin | NS | 4.02 | 0.05 | 4.4 | NS | 6.1 |
| FZD7 | NS | 1.7 | 1.8×10⁻³ | 27.2 | NS | 1.2 |
| NAP1L1 | NS | 1.1 | 0.01 | 12.05 | NS | −1.9 |
| NRP2 | NS | 1.2 | NS | −1.6 | NS | −1.4 |
WDNET = Well Differentiated Neuroendocrine Tumors, WDNEC = Well Differentiated
Neuroendocrine Carcinomas, PDNET = Poorly Differentiated Neuroendocrine Tumors, PDNEC = Poorly Differentiated Neuroendocrine Carcinomas, MET = Metastasis
FC = Fold Change, NS = Non-significant (p≥0.05)
To predict the metastasis of primary WDNETs, MAGE-D2, NAP1L1, and Kiss1 (as identified by FS) were used in SVM to construct a classifier. WDNETs and WDNET METs were predicted with 100% sensitivity and specificity. To visualize metastatic potential of primary tumors, samples were plotted in correlation with the selected gene expression levels and distribution densities were colorized to outline the separation of primary and metastatic samples (Figure 5A). WDNET could be predicted to metastasize if transcript levels of 1) NAP1L1 > −2.71 and Kiss1 > −2.50; 2) NAP1L1 > −3.82 and MAGE-D2 > −4.42; 3) MAGE-D2 > −3.21 and Kiss1 > −2.12.
Figure 5. Density Map of distributions between primary Small Intestinal Neuroendocrine Tumors and their metastases.
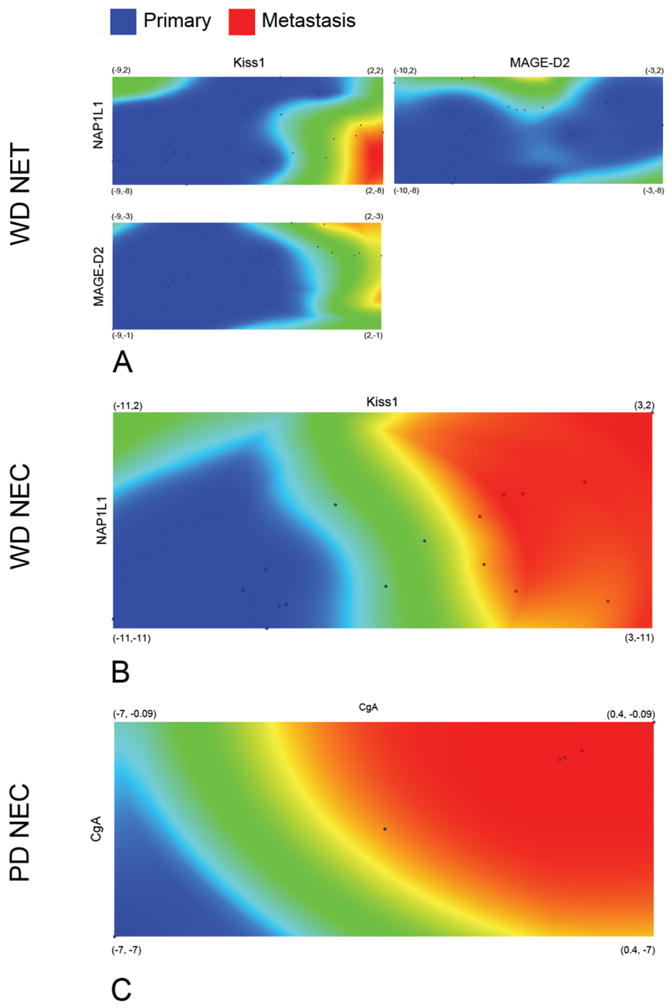
Expression levels of Kiss1, NAP1L1, MAGE-D2, and CgA transcripts as identified by the Feature Selection algorithm were plotted on the X- and Y-axis. Primary Small Intestinal Neuroendocrine tumor subtypes - well differentiated NETs (WDNETs), well differentiated neuroendocrine carcinomas (WDNECs), poorly differentiated carcinomas (PDNECs), and respective metastases (METs) were scattered according to their respective gene pair expressions (6A–C). Distribution densities based on the average Euclidean distance (difference in expression) between samples were colorized blue (primary tumors) and red (metastases). Green areas indicate a region of transition between primary tumor subtypes and respective metastases. The distinct separation primary small intestinal neuroendocrine tumor subtypes and the respective metastases indicate the utility of the selected transcripts as metastasis markers.
A Perceptron classifier was used to predict metastases of WDNECs and PDNECs. NAP1L1 and Kiss1 were specific to WDNEC METs and CgA was specific to PDNEC METs, as determined by the FS algorithm. Metastases of all primary tumors were predicted with the sensitivity of 100% and specificity of 100%. Metastatic potential of primary tumors was visualized by plotting expressions of featured genes and colorizing the distribution densities of primary tumors and their metastases (Figure 5B, 5C). WDNECs were predicted to metastasize with values of NAP1L1 > −5.28 and Kiss1 > −2.83, while PDNECs could be predicted to metastasize when CgA > −3.5.
Model Validation
To validate the predictive model, real-time PCR was used to measure the marker gene transcript expression in an independent set of SI NETs (n=37) consisting of normal EC cell preparations (n=17), localized SI NETs (n=8), and malignant SI NETs (n=12). All WDNETs were considered as “localized” while other tumor subtypes were considered “malignant”. Assessment of linearly correlated transcript pairs identified a pattern similar to the training set whereas MTA1:MAGE-D2, MTA1:Kiss1, FZD7:NAP1L1, and Survivin:Ki-67 transcript pairs were highly correlated (R2>0.50). The trained SVM model was applied to differentiate normal EC cell preparations from neoplasia with 76% accuracy. The Decision tree model predicted localized and malignant NETs with 63% and 83% accuracy respectively (Figure 6). Furthermore, the F-test statistic was computed to confirm that the classification results of the training and the independent sets were not significantly different. The p-values for normal, localized, and malignant subgroups were 0.84, 0.25, and 0.80 respectively.
Figure 6. Evaluation of the classifier performance in the test and training sets.

Normal EC cells (green) were cross-validated with the 77% accuracy and predicted in an independent test set with 76% accuracy (p = 0.84). Localized NETs (blue) were cross-validated with 78% accuracy and predicted with 63% accuracy in the test set (p = 0.25). Malignant NETs (red) were cross-validated with 83% accuracy and predicted with 83% accuracy in an independent set (p = 0.80).
Discussion
The critical issue in SI NETs is the prediction of biological aggression of an individual tumor since this defines treatment and predicts prognosis. Classically, this “calculation” has been based upon an amalgam of tumor size, extent of spread, histological classification, genetic background and assessment of proliferative markers (Ki-67 and mitotic index) 33. This approach has yielded data that are often not reproducible, may be inaccurate in certain tumors and is based upon pattern recognition. Given the recent advances in the identification of the molecular signatures of individual types of neoplasia and the utility of novel artificial intelligence techniques for analyzing complex data, we sought to re-evaluate SI NET neoplasia since current strategies are notoriously difficult in this particular tumor type.
We analyzed transcript levels of genes with known or suspected roles in NET neoplasia (MAGE-D2, MTA1, NAP1L1, Ki-67, Survivin, FZD7, Kiss1, NRP2, and CgA) and applied supervised machine learning algorithms to assess their prognostic power in primary SI NET subtypes and corresponding metastases. Our analysis demonstrated that primary SI NETs could be differentiated from normal human EC cells with 100% specificity and 92.3% sensitivity. WDNETs, WDNECs, and PDNETs were differentiated with specificities of 77.8%, 77.8%, and 71.4% using the same methodology, while PDNECs were misclassified as either WDNETs or PDNETs. The likelihood of metastases was predicted with 100% sensitivity and specificity. Furthermore, we applied the model to an independent set of SI NETs and demonstrated that normal EC cell preparations could be differentiated from neoplasia with 76% accuracy, while localized and malignant SI NETs could be predicted with 63% and 83% accuracy respectively.
Current pathological classification frameworks are not validated and are unable to consistently discriminate among tumors with similar histopathologic features, which may vary substantially in either their clinical course or response to treatment 3. Although supervised machine learning algorithms incorporating clinical, histopathological, and molecular data have been used to classify unknown astrocytomas 5, prostatic carcinomas 6, metastatic breast cancer 7, and colon cancer 8, no attempts have been made to apply similar methodology to gastrointestinal NETs. We have determined that the SVM classifier performed best while differentiating normal EC cells and SI NETs. This presumably represents the clear demarcation of molecular signatures characteristic to the normal and neoplastic samples as measured by real-time PCR. The seemingly homogeneous distribution of primary SI NET histological subtypes as defined by marker gene levels, did not present a clear distinction and the SVM classification performed poorly under these conditions. Decision Trees, on the other hand, performed well in classifying primary SI NET subtypes. In particular, only NAP1L1 (nucleosome assembly protein 1-like) and Ki-67 (marker of proliferation) were selected by the FS algorithm to be the most relevant transcripts for this classification model. In the Decision Tree, the root position of NAP1L1 and its subsequent properties in distinguishing WDNETs, WDNECs, PDNETs, and PDNECs suggests that it functions as the prime component of the decision process. This is consistent with our previous studies that identified this mitotic regulatory gene to be implicated in malignant progression of the SI NETs as well as appendiceal tumors 13, 34. Ki-67 levels were only indicative of PDNETs. This observation is consistent with numerous reports that the expression of the human Ki-67 protein is associated with cell proliferation 35 and can be used as a malignancy marker in prostatic cancer 36, adult-type granulosa cell tumor of the ovary15, and mesothelial proliferations 37. Immunohistochemical assessment of NETs has identified Ki-67 as the best predictor of survival in neuroendocrine tumors 38. The Decision Trees misclassified PDNECs as either WDNET or PDNET. This was most likely due to the fact that the genes we used as classifiers were largely NET-specific 13, 14 and many of these lesions have a variable phenotype with adenocarcinomatous elements and often lack overt or consistent neuroendocrine features 39. The small sample size of this group in our current study does not permit further analysis of this subgroup and is an important issue that requires further investigation.
SVM classifier performed best differentiating primary WDNETs and their metastases.. However, WDNECs, PDNECs, and their metastases were homogeneously separated in two-dimensional space, suggesting a distinct gene transcription between the primary tumors and their metastases. Perceptron performed best under these conditions, which is consistent with the requirements (discrete homogeneity) for this neural network 25. The FS algorithm determined NAP1L1, MAGE-D2, and Kiss1 to be implicated in the metastasis of WDNETs, NAP1L1 and Kiss1 in the metastasis of WDNECs, and CgA in the metastasis of PDNECs. Transcript levels of Kiss1, the metastasis suppressing gene, were significantly elevated in all metastases of primary SI NETs. Although previous studies have noted a loss of Kiss1 in human breast cancer 40, and metastatic melanoma 41, there has been a report of a gain of Kiss1 in the highly metastatic human bladder T24T cells when compared to the poorly metastatic parental T24 line 42. Our observations suggest the possibility that Kiss1 has a function other than metastasis suppression or may in fact be a metastasis promoter in SI NETs. An alternative explanation may be contamination with hepatocytes during dissection of the hepatic metastases. A comparison of Kiss1 levels demonstrated these were ~20x higher (p=0.0013, 2-tailed Mann-Whitney test) in normal hepatic tissue compared to normal small intestinal mucosa. It is therefore possible that tissue from the surrounding environment (liver) with high Kiss1 transcripts may be included in the metastatic samples and contribute to the elevated Kiss1 levels noted. In our investigations of the neoplastic EC cell line KRJ-I 43, we noted a 4.5-fold down regulation of Kiss1 transcript (unpublished observations). To examine the utility of the classification algorithm, we examined gene expression in KRJ-I and determined this was a WDNET – confirming the initial histology of the tumor 44.
Validation of the predictive model in an independent set of normal EC cell preparations and SI NETs has confirmed that the model is robust and reproducible. Transcript pairs (MTA1:MAGE-D2, MTA1:Kiss1, FZD7:NAP1L1, and Survivin:Ki-67) in an independent set were linearly correlated (R2>0.50), identical to those of the training set. Although there was no significant statistical difference (p>0.2) between the classification accuracy of the training and independent sets, localized tumors in an independent set were classified at a lower accuracy rate. This can be attributed to a smaller sample size of this subgroup within the independent set. It is important to note, however, that the model has performed best for the neoplastic tissue suggesting that the present marker gene panel is a good indicator of malignancy. This is supported by a subset analysis we performed where transcripts of genes shown to predict metastasis (MAGE-D2, NAP1L1, Kiss1, and CgA) were excluded from the training and independent sets. The re-trained SVM model and the resulting classifier was applied to the independent set and identified to accurately classify only 2/17 (12%) samples as normal EC cells. This indicates that the metastasis-predicting gene expression is crucial in differentiating between normal and tumor samples.
This study offers an illustration of how gene expression profiling and supervised machine learning can be used to classify SI NET subtypes and accurately predict metastasis. The use of novel mathematical techniques of gene analysis provides a new tool that can be used to increase the accuracy of prediction of tumor behavior and therefore allow for a rational assessment of treatment strategies and prognosis. This technique of gene expression analysis may also have application in the assessment and delineation of the specific cellular mechanisms involved in NET cell proliferation and provides the opportunity to identify key metabolic sites that can be therapeutically targeted. A large-sample, investigative analysis of tumor type- and tumor grade-specific markers is required to confirm these results. It is, however, likely that the application of this technique or modifications thereof will become a valuable adjunct to current pathological identification and staging techniques in facilitating accurate identification of the biological nature NET disease, and determining its prognosis. Such information will provide the basis for the identification of an appropriate therapeutic strategy for individual tumors (patients) as opposed to the ineffective “one treatment for all tumors” concept, currently utilized.
Acknowledgments
Financial support: NIH R01-CA115285 (I. Modlin)
Footnotes
Financial Disclosure: There are no financial disclosures from any author
References
- 1.Golub TR, Slonim DK, Tamayo P, Huard C, Gaasenbeek M, Mesirov JP, et al. Molecular classification of cancer: class discovery and class prediction by gene expression monitoring. Science. 1999;286(5439):531–7. doi: 10.1126/science.286.5439.531. [DOI] [PubMed] [Google Scholar]
- 2.Kloppel G, Perren A, Heitz PU. The gastroenteropancreatic neuroendocrine cell system and its tumors: the WHO classification. Ann N Y Acad Sci. 2004;1014:13–27. doi: 10.1196/annals.1294.002. [DOI] [PubMed] [Google Scholar]
- 3.Stephenson J. Human genome studies expected to revolutionize cancer classification. JAMA. 1999;282(10):927–8. doi: 10.1001/jama.282.10.927. [DOI] [PubMed] [Google Scholar]
- 4.Halvarsson B, Muller W, Planck M, Benoni AC, Mangell P, Ottosson J, et al. Phenotypic heterogeneity in hereditary non-polyposis colorectal cancer: identical germline mutations associated with variable tumour morphology and immunohistochemical expression. J Clin Pathol. 2007;60(7):781–6. doi: 10.1136/jcp.2006.040402. [DOI] [PMC free article] [PubMed] [Google Scholar]
- 5.Glotsos D, Tohka J, Ravazoula P, Cavouras D, Nikiforidis G. Automated diagnosis of brain tumours astrocytomas using probabilistic neural network clustering and support vector machines. Int J Neural Syst. 2005;15(1–2):1–11. doi: 10.1142/S0129065705000013. [DOI] [PubMed] [Google Scholar]
- 6.Mattfeldt T, Gottfried HW, Wolter H, Schmidt V, Kestler HA, Mayer J. Classification of prostatic carcinoma with artificial neural networks using comparative genomic hybridization and quantitative stereological data. Pathol Res Pract. 2003;199(12):773–84. doi: 10.1078/0344-0338-00496. [DOI] [PubMed] [Google Scholar]
- 7.Zhang H, Yu CY. Tree-based analysis of microarray data for classifying breast cancer. Front Biosci. 2002;7:c63–7. doi: 10.2741/A759. [DOI] [PubMed] [Google Scholar]
- 8.Zhang H, Yu CY, Singer B, Xiong M. Recursive partitioning for tumor classification with gene expression microarray data. Proc Natl Acad Sci U S A. 2001;98(12):6730–5. doi: 10.1073/pnas.111153698. [DOI] [PMC free article] [PubMed] [Google Scholar]
- 9.Cho JH, Lee D, Park JH, Lee IB. New gene selection method for classification of cancer subtypes considering within-class variation. FEBS Lett. 2003;551(1–3):3–7. doi: 10.1016/s0014-5793(03)00819-6. [DOI] [PubMed] [Google Scholar]
- 10.Giordano TJ. Transcriptome analysis of endocrine tumors: Clinical perspectives. Ann Endocrinol (Paris) 2008 doi: 10.1016/j.ando.2008.02.010. [DOI] [PubMed] [Google Scholar]
- 11.Tu IP, Schaner M, Diehn M, Sikic BI, Brown PO, Botstein D, et al. A method for detecting and correcting feature misidentification on expression microarrays. BMC Genomics. 2004;5(1):64. doi: 10.1186/1471-2164-5-64. [DOI] [PMC free article] [PubMed] [Google Scholar]
- 12.Allanach K, Mengel M, Einecke G, Sis B, Hidalgo LG, Mueller T, et al. Comparing microarray versus RT-PCR assessment of renal allograft biopsies: similar performance despite different dynamic ranges. Am J Transplant. 2008;8(5):1006–15. doi: 10.1111/j.1600-6143.2008.02199.x. [DOI] [PubMed] [Google Scholar]
- 13.Kidd M, Modlin IM, Mane SM, Camp RL, Eick G, Latich I. The role of genetic markers--NAP1L1, MAGE-D2, and MTA1--in defining small-intestinal carcinoid neoplasia. Ann Surg Oncol. 2006;13(2):253–62. doi: 10.1245/ASO.2006.12.011. [DOI] [PubMed] [Google Scholar]
- 14.Kidd M, Modlin IM, Mane SM, Camp RL, Shapiro MD. Q RT-PCR detection of chromogranin A: a new standard in the identification of neuroendocrine tumor disease. Ann Surg. 2006;243(2):273–80. doi: 10.1097/01.sla.0000197734.28551.0f. [DOI] [PMC free article] [PubMed] [Google Scholar]
- 15.Leuverink E, Brennan BA, Crook ML, Doherty D, Hammond IG, Ruba S, et al. Prognostic value of mitotic counts and Ki-67 immunoreactivity in adult-type granulosa cell tumour of the ovary. J Clin Pathol. 2008 doi: 10.1136/jcp.2008.056093. [DOI] [PubMed] [Google Scholar]
- 16.Akhtar M, Gallagher L, Rohan S. Survivin: role in diagnosis, prognosis, and treatment of bladder cancer. Adv Anat Pathol. 2006;13(3):122–6. doi: 10.1097/00125480-200605000-00003. [DOI] [PubMed] [Google Scholar]
- 17.Vincan E, Swain RK, Brabletz T, Steinbeisser H. Frizzled7 dictates embryonic morphogenesis: implications for colorectal cancer progression. Front Biosci. 2007;12:4558–67. doi: 10.2741/2410. [DOI] [PubMed] [Google Scholar]
- 18.Martins CM, Fernandes BF, Antecka E, Di Cesare S, Mansure JJ, Marshall JC, et al. Expression of the metastasis suppressor gene KISS1 in uveal melanoma. Eye. 2008 doi: 10.1038/sj.eye.6703090. [DOI] [PubMed] [Google Scholar]
- 19.Caunt M, Mak J, Liang WC, Stawicki S, Pan Q, Tong RK, et al. Blocking neuropilin-2 function inhibits tumor cell metastasis. Cancer Cell. 2008;13(4):331–42. doi: 10.1016/j.ccr.2008.01.029. [DOI] [PubMed] [Google Scholar]
- 20.Modlin IM, Kidd M, Pfragner R, Eick GN, Champaneria MC. The functional characterization of normal and neoplastic human enterochromaffin cells. J Clin Endocrinol Metab. 2006;91(6):2340–8. doi: 10.1210/jc.2006-0110. [DOI] [PubMed] [Google Scholar]
- 21.Kidd M, Eick G, Shapiro MD, Camp RL, Mane SM, Modlin IM. Microsatellite instability and gene mutations in transforming growth factor-beta type II receptor are absent in small bowel carcinoid tumors. Cancer. 2005;103(2):229–36. doi: 10.1002/cncr.20750. [DOI] [PubMed] [Google Scholar]
- 22.Vandesompele J, De Preter K, Pattyn F, Poppe B, Van Roy N, De Paepe A, et al. Accurate normalization of real-time quantitative RT-PCR data by geometric averaging of multiple internal control genes. Genome Biol. 2002;3(7):RESEARCH0034. doi: 10.1186/gb-2002-3-7-research0034. [DOI] [PMC free article] [PubMed] [Google Scholar]
- 23.Kidd M, Nadler B, Mane S, Eick G, Malfertheiner M, Champaneria M, et al. GeneChip, geNorm, and gastrointestinal tumors: novel reference genes for real-time PCR. Physiol Genomics. 2007;30(3):363–70. doi: 10.1152/physiolgenomics.00251.2006. [DOI] [PubMed] [Google Scholar]
- 24.Partek. Partek® Genomics SuiteTM. St. Louis: Partek Inc; 2008. Revision 6.3. [Google Scholar]
- 25.Gallant SI. Perceptron-based learning algorithms. Perceptron-based learning algorithms. 1990;1(2):179–91. doi: 10.1109/72.80230. [DOI] [PubMed] [Google Scholar]
- 26.Peng H, Long F, Ding C. Feature selection based on mutual information: criteria of max-dependency, max-relevance, and min-redundancy. IEEE Transactions on Pattern Analysis and Machine Intelligence. 2005;27(8):1226–38. doi: 10.1109/TPAMI.2005.159. [DOI] [PubMed] [Google Scholar]
- 27.Jolliffe IT. Principle Component Anlysis. Springer; 1986. [Google Scholar]
- 28.Cristianini N, Shawe-Taylor J. An Introduction to Support Vector Machines and other kernel-based learning methods. Cambridge: Cambridge University Press; 2000. [Google Scholar]
- 29.Zhang H, Singer B. Recursive Partitioning in the Health Sciences (Statistics for Biology and Health) Springer; 1999. [Google Scholar]
- 30.Pirooznia M, Yang JY, Yang MQ, Deng Y. A comparative study of different machine learning methods on microarray gene expression data. BMC Genomics. 2008;9 (Suppl 1):S13. doi: 10.1186/1471-2164-9-S1-S13. [DOI] [PMC free article] [PubMed] [Google Scholar]
- 31.Markey MK, Lo JY, Vargas-Voracek R, Tourassi GD, Floyd CE., Jr Perceptron error surface analysis: a case study in breast cancer diagnosis. Comput Biol Med. 2002;32(2):99–109. doi: 10.1016/s0010-4825(01)00035-x. [DOI] [PubMed] [Google Scholar]
- 32.Gabriel KR. The biplot graphic display of matrices with application to principal component analysis. Biometrika. 1971;58(3):453. [Google Scholar]
- 33.Modlin IM, Kidd M, Latich I, Zikusoka MN, Shapiro MD. Current status of gastrointestinal carcinoids. Gastroenterology. 2005;128(6):1717–51. doi: 10.1053/j.gastro.2005.03.038. [DOI] [PubMed] [Google Scholar]
- 34.Modlin IM, Kidd M, Latich I, Zikusoka MN, Eick GN, Mane SM, et al. Genetic differentiation of appendiceal tumor malignancy: a guide for the perplexed. Ann Surg. 2006;244(1):52–60. doi: 10.1097/01.sla.0000217617.06782.d5. [DOI] [PMC free article] [PubMed] [Google Scholar]
- 35.Scholzen T, Gerdes J. The Ki-67 protein: from the known and the unknown. J Cell Physiol. 2000;182(3):311–22. doi: 10.1002/(SICI)1097-4652(200003)182:3<311::AID-JCP1>3.0.CO;2-9. [DOI] [PubMed] [Google Scholar]
- 36.Zhong W, Peng J, He H, Wu D, Han Z, Bi X, et al. Ki-67 and PCNA expression in prostate cancer and benign prostatic hyperplasia. Clin Invest Med. 2008;31(1):E8–E15. doi: 10.25011/cim.v31i1.3136. [DOI] [PubMed] [Google Scholar]
- 37.Taheri ZM, Mehrafza M, Mohammadi F, Khoddami M, Bahadori M, Masjedi MR. The diagnostic value of Ki-67 and repp86 in distinguishing between benign and malignant mesothelial proliferations. Arch Pathol Lab Med. 2008;132(4):694–7. doi: 10.5858/2008-132-694-TDVOKA. [DOI] [PubMed] [Google Scholar]
- 38.Faggiano A, Mansueto G, Ferolla P, Milone F, del Basso de Caro ML, Lombardi G, et al. Diagnostic and prognostic implications of the World Health Organization classification of neuroendocrine tumors. J Endocrinol Invest. 2008;31(3):216–23. doi: 10.1007/BF03345593. [DOI] [PubMed] [Google Scholar]
- 39.Hainsworth JD, Johnson DH, Greco FA. Poorly differentiated neuroendocrine carcinoma of unknown primary site. A newly recognized clinicopathologic entity. Ann Intern Med. 1988;109(5):364–71. doi: 10.7326/0003-4819-109-5-364. [DOI] [PubMed] [Google Scholar]
- 40.Lee JH, Welch DR. Suppression of metastasis in human breast carcinoma MDA-MB-435 cells after transfection with the metastasis suppressor gene, KiSS-1. Cancer Res. 1997;57(12):2384–7. [PubMed] [Google Scholar]
- 41.Mitchell DC, Stafford LJ, Li D, Bar-Eli M, Liu M. Transcriptional regulation of KiSS-1 gene expression in metastatic melanoma by specificity protein-1 and its coactivator DRIP-130. Oncogene. 2007;26(12):1739–47. doi: 10.1038/sj.onc.1209963. [DOI] [PubMed] [Google Scholar]
- 42.Seraj MJ, Harding MA, Gildea JJ, Welch DR, Theodorescu D. The relationship of BRMS1 and RhoGDI2 gene expression to metastatic potential in lineage related human bladder cancer cell lines. Clin Exp Metastasis. 2000;18(6):519–25. doi: 10.1023/a:1011819621859. [DOI] [PubMed] [Google Scholar]
- 43.Kidd M, Eick GN, Modlin IM, Pfragner R, Champaneria MC, Murren J. Further delineation of the continuous human neoplastic enterochromaffin cell line, KRJ-I, and the inhibitory effects of lanreotide and rapamycin. J Mol Endocrinol. 2007;38(1–2):181–92. doi: 10.1677/jme.1.02037. [DOI] [PubMed] [Google Scholar]
- 44.Pfragner R, Wirnsberger G, Niederle B, Behmel A, Rinner I, Mandl A, et al. Establishment of a continuous cell line from a human carcinoid of the small intestine (KRJ-1): Characterization of the effects of 5-azacytidine on proliferation. Int J Oncol. 1996;(8):513–20. doi: 10.3892/ijo.8.3.513. [DOI] [PubMed] [Google Scholar]