ABSTRACT
OBJECTIVE
To compare patterns of practice between graduates of core 2-year family medicine (FM) training programs and those completing an additional postgraduate year (PGY3) of training.
DESIGN
Retrospective cohort study using administrative data from the Ontario Health Insurance Plan.
SETTING
Ontario.
PARTICIPANTS
Graduates of Ontario FM residency programs from 1996 to 2002 who provided insured services in Ontario for 1 or more fiscal years between 1996 and 2004.
MAIN OUTCOME MEASURES
Proportion of physician years of service in which a minimum number of services were provided in each of the following categories: anesthesia, emergency medicine (EM), home visits, hospital visits, nursing home visits, intrapartum obstetrics, palliative care, office-only practice, and rural locations, as well as deciles for proportion of billings for emergency department work and “quasi-specialty” designations based on billing patterns. Results are stratified by type of training and years in practice.
RESULTS
Graduates of PGY3 programs are significantly more likely to practise in a range of nonoffice settings than their counterparts who completed core 2-year FM training programs. Differences were the most marked in areas in which additional training had been undertaken, but also extended to other categories. There was no effect on the proportion practising in rural locations, unless the training was undertaken in a rural setting or in anesthesia. Physicians including EM in their practices were more likely to practise mostly or almost all EM if they had undertaken either EM programs or self-directed programs at non-northern training sites. Very few graduates of any type were classified as belonging to a quasi-specialty group, other than those who completed care of the elderly or palliative care (hospitalist) and anesthesia programs.
CONCLUSION
Completion of a PGY3 program is strongly associated with increased participation in practice outside the office, particularly in the area of the training provided.
RÉSUMÉ
OBJECTIF
Comparer les habitudes de pratique des diplômés des programmes de 2 ans de formation de base en médecine familiale (MF) avec celles des diplômés qui ont complété une année de formation additionnelle (R3).
CONCEPTION
Étude rétrospective de cohortes à l’aide de données administratives du Régime d’assurance santé de l’Ontario.
CONTEXTE
Ontario.
PARTICIPANTS
Les diplômés de programmes de résidence en MF en Ontario de 1996 à 2002 qui ont fourni des services assurés en Ontario pendant 1 ou plusieurs exercices financiers entre 1996 et 2004.
PRINCIPAUX PARAMÈTRES À L’ÉTUDE
Proportion des années de service du médecin durant lesquelles un nombre minimum de services ont été offerts dans chacune des catégories suivantes: anesthésie, médecine d’urgence (MU), visites à domicile, visites à l’hôpital, visites en centres d’accueil, obstétrique intra-partum, soins palliatifs, pratique en cabinet seulement et en milieu rural, ainsi que les déciles de la proportion des facturations pour du travail au service d’urgence et les désignations «quasi spécialité» en se fondant sur les habitudes de facturation.
RÉSULTATS
Les diplômés de programmes de R3 sont considérablement plus enclins à pratiquer dans divers milieux autres que le cabinet en comparaison de leurs collègues qui ont complété des programmes de formation de base de 2 ans en MF. Les différences étaient plus marquées dans les domaines de la formation additionnelle, mais elles s’étendaient aussi à d’autres catégories. Il n’y avait pas d’effet sur la proportion de ceux qui pratiquaient en milieu rural, à moins que la formation ait été suivie en région rurale ou en anesthésie. Les médecins qui incluaient dans leur pratique la MU étaient plus enclins à pratiquer majoritairement ou entièrement en MU s’ils avaient suivi soit des programmes en MU ou des programmes autodirigés dans des centres de formation ailleurs que dans le Nord. Très peu de diplômés, quelle que soit la durée de formation, appartenaient à la catégorie des quasi-spécialités, sauf ceux qui avaient suivi des programmes en soins pour les personnes plus âgées ou en soins palliatifs (hospitaliers) et des programmes en anesthésie.
CONCLUSION
L’achèvement d’un programme de R3 est fortement associé à une participation plus grande à la pratique ailleurs qu’en cabinet, surtout dans le domaine de la formation suivie.
This is the second of 2 related papers* presenting the results of original research undertaken during a review of postgraduate year 3 (PGY3) residency programs in family medicine (FM) in Ontario.1 The objective of this study was to compare the practice patterns of PGY3 FM graduates with graduates of the core FM program. These programs exist in designated areas such as emergency medicine (EM), anesthesia, care of the elderly, and palliative care, as well as a range of other areas of interest defined more loosely as category 2 enhanced skills programs.
There are only a limited number of publications on the practice patterns of PGY3 graduates. Chan (2002) found that PGY3 EM graduates practised primarily EM (more than 50% of all visits took place in emergency departments), but also noted that 34% of all patient visits by those holding Certification in EM from the College of Family Physicians of Canada (CCFP[EM]) were provided in office settings, and that there was a trend toward more office work the longer these physicians were in practice.2 Sansom et al (2001) surveyed family physicians with additional training in anesthesia and found that 87% provided anesthesia services, devoting about 13 to 16 hours per week to these services.3 Chan and Schultz (2005) looked at the practice patterns of all GPs and FPs in Ontario from academic years 1993–1994 to 2001–2002. They found that in general there has been a slow trend away from comprehensive practice, as defined by participation in care in a variety of nonoffice settings.4,5 Providing FM trainees with the skills to provide such services is one of the goals of enhanced skills training programs. We did not identify any previous studies that undertook a comprehensive examination of the practice patterns of graduates of other PGY3 training programs.
METHODS
Ethics approval was granted by the Health Science Research Ethics Board at Queen’s University in Kingston, Ont. Graduates of Ontario FM programs between 1996 and 2002 who provided insured services in Ontario for 1 or more fiscal years between 1996 and 2004 were included in the analysis. Ministry of Health and Long-Term Care (MOHLTC) data on funding of resident training were used to identify and categorize physicians. These years were selected for inclusion because substantial changes in the structure of postgraduate training came into effect for residents graduating in 1995. A number of changes in the designations of funding streams at the MOHLTC were also introduced at this time, which made it difficult to accurately categorize training type before this date.
Many funding categories had small numbers of physicians. These were rolled into a single large category representing most of the category 2 PGY3 programs in the province. Northern program graduates who were not in category 1 programs were left as a separate group. Previously validated algorithms, developed by the Institute for Clinical Evaluative Sciences and the Ontario Physician Workforce Database, were applied to billing data from the Ontario Health Insurance Plan to determine which physicians were providing services in each category.4,5 For physicians identified as providing EM services, the degree to which they included EM as a part of their practices was determined by allocating each active physician into deciles based on the percentage of their total billings for the fiscal year coming from work in the emergency department. They were then grouped into 4 distinct categories: some EM (< 20%), moderate EM (21% to 50%), mostly EM (51% to 80%), and almost all EM (> 80%). “Quasi-specialty” designations are assigned to physicians whose billings for each year meet specified criteria, indicating that they are more likely to be practising as a “specialist” in a defined area rather than as a family practitioner.5 Each fiscal year, a physician contributes to the number of physicians in that year if he or she meets the definition of active physician established by the Institute for Clinical Evaluative Sciences.
Given the natural evolution of physicians’ practice patterns after graduation, data were summarized by time since graduation. Three time periods were selected: the first 2 years of practice, years 3 to 5 in practice (inclusive), and after 6 or more years in practice. Data availability limited the study to graduates of Ontario FM programs who remained in Ontario after completing their training. Data were compiled by the MOHLTC and provided to the research team in Microsoft Excel. R, version 2.4.1, was used to generate summary tables by training type and number of years since graduation. Stata, version 10, statistical software was used for the analyses. Two sample comparison of proportions were used for the paired comparisons in Table 1, χ2 and Fisher exact tests were used for comparison of the distribution across EM categories between groups and over time, and 1-sided comparisons of proportion versus a presumed value of 1% or less were used for the results of the quasi-specialty designations.
Table 1.
Practice patterns of Ontario family medicine graduates (academic years 1995–1996 to 2002–2003) working in Ontario during fiscal years 1996 to 2004: A) First 2 years of practice after residency; B) years 3 to 5 in practice; C) years 6 and more in practice.
| A) | ||||||||||
|---|---|---|---|---|---|---|---|---|---|---|
| PROPORTION OF PHYSICIAN YEARS |
||||||||||
| TYPE OF TRAINING | TOTAL NO. OF PHYSICIAN YEARS | ANESTHESIA | EM | HOME VISITS | HOSPITAL VISITS | NURSING HOME VISITS | OBSTETRICS | OFFICE ONLY | PALLIATIVE CARE | RURAL |
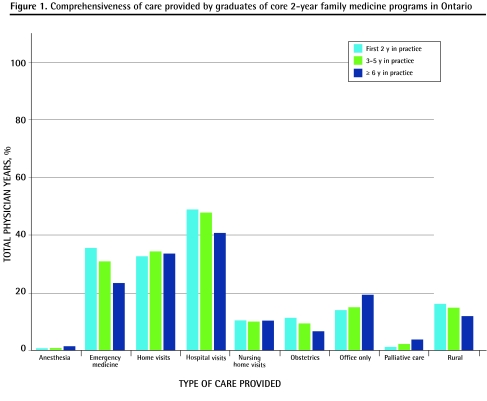
| PGY2 (all) | 2051 | 0.7 | 35.7 | 32.4 | 48.8 | 10.1 | 11.1 | 13.8 | 0.8 | 15.7 |
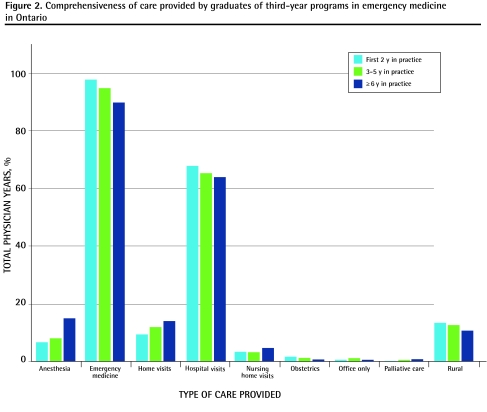
| EM | 347 | 6.3* | 98.6* | 8.1* | 68.3* | 3.2* | 1.7* | 0.3* | 0.0 | 13.8 |
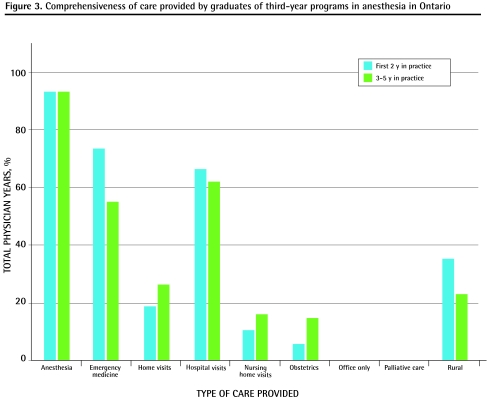
| Anesthesia | 47 | 91.5* | 72.3* | 19.1 | 68.1† | 10.6 | 6.4 | 0.0† | 0.0 | 31.9† |
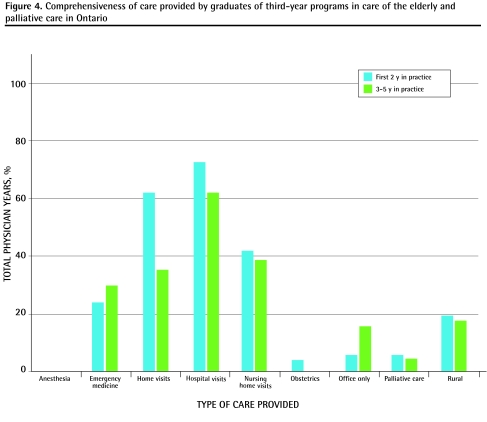
| Elderly or palliative care | 31 | 0.0 | 25.8 | 61.3‡ | 71.0§ | 41.9* | 3.2 | 6.5 | 6.5‡ | 19.4 |
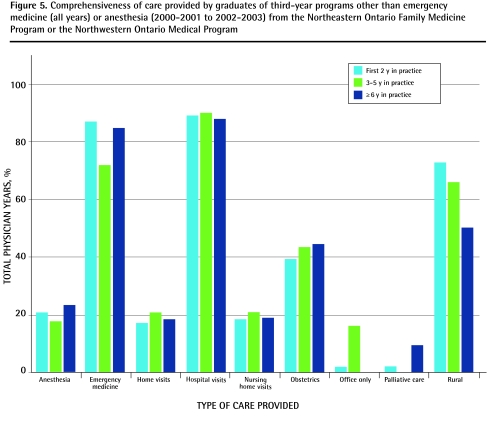
| NOFM or NOMP | 53 | 20.8* | 86.8* | 17.0† | 88.7* | 18.9§ | 39.6* | 1.9§ | 1.9 | 73.6* |
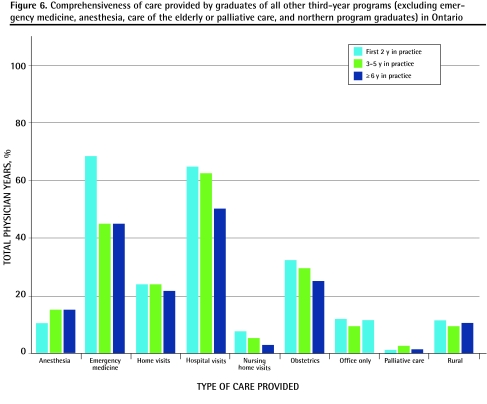
| All others | 224 | 10.7* | 48.2† | 24.1§ | 63.8* | 8.0 | 33.0* | 12.9 | 0.9 | 12.9 |
| B) | ||||||||||
|
PROPORTION OF PHYSICIAN YEARS |
||||||||||
| TYPE OF TRAINING | TOTAL NO. OF PHYSICIAN YEARS | ANESTHESIA | EM | HOME VISITS | HOSPITAL VISITS | NURSING HOME VISITS | OBSTETRICS | OFFICE ONLY | PALLIATIVE CARE | RURAL |
| PGY2 (all) | 2422 | 0.8 | 30.8 | 33.4 | 47.4 | 9.8 | 8.6 | 14.6 | 2.0 | 14.6 |
| EM | 346 | 9.0* | 95.7* | 10.4* | 67.1* | 2.9* | 1.4* | 0.9* | 0.3§ | 11.9 |
| Anesthesia | 34 | 91.2* | 55.9† | 26.5 | 64.7§ | 17.6 | 14.7 | 0.0§ | 0.0 | 23.5 |
| Elderly or palliative care | 24 | 0.0 | 29.2 | 33.3|| | 62.5 | 37.5* | 0.0 | 16.7 | 4.2 | 16.7 |
| NOFM or NOMP | 48 | 16.7* | 72.9* | 20.8 | 79.2* | 20.8§ | 43.8* | 14.6 | 0.0 | 64.6* |
| All others | 246 | 15.0* | 44.7* | 24.4† | 62.6* | 6.9 | 30.9* | 9.4§ | 2.0 | 10.6 |
| C) | ||||||||||
|
PROPORTION OF PHYSICIAN YEARS |
||||||||||
| TYPE OF TRAINING | TOTAL NO. OF PHYSICIAN YEARS | ANESTHESIA | EM | HOME VISITS | HOSPITAL VISITS | NURSING HOME VISITS | OBSTETRICS | OFFICE ONLY | PALLIATIVE CARE | RURAL |
| PGY2 (all) | 1389 | 1.0 | 23.2¶ | 31.7 | 41.2¶ | 10.2 | 6.4¶ | 19.3# | 3.4# | 11.7** |
| EM | 159 | 15.7*†† | 91.2*¶ | 13.8*‡‡ | 66.0* | 3.8† | 0.6† | 0.6* | 1.3‡‡ | 8.2 |
| Anesthesia | Cell numbers too small to report | |||||||||
| Elderly or palliative care | Cell numbers too small to report | |||||||||
| NOFM or NOMP | 22 | 22.7* | 86.4* | 18.2 | 77.3‡ | 18.2 | 45.5* | 0.0§ | 9.1 | 50.0*|| |
| All others | 168 | 14.3 | 44.0 | 22.0 | 51.8|| | 4.2 | 25.0 | 13.7 | 1.8 | 10.7 |
EM emergency medicine, NOFM Northeastern Ontario Family Medicine Program, NOMP Northwestern Ontario Medical Program, PGY2 postgraduate year 2.
Data from the Ontario Ministry of Health and Long-Term Care, April 2006.
P < .0001 compared with PGY2 graduates.
P < .01 compared with PGY2 graduates.
P < .001 compared with PGY2 graduates.
P < .05 compared with PGY2 graduates.
Decreased (P < .05) compared with years 1 and 2 in same program (years 3–5 for anesthesia and elderly or palliative care, years ≥ 6 for all others).
Decreased (P < .0001) compared with years 1 and 2 in same program.
Increased (P < .0001) compared with years 1 and 2 in same program.
Decreased (P < .001) compared with years 1 and 2 in same program.
Increased (P < .001) compared with years 1 and 2 in same program.
Increased (P < .05) compared with years 1 and 2 in same program.
RESULTS
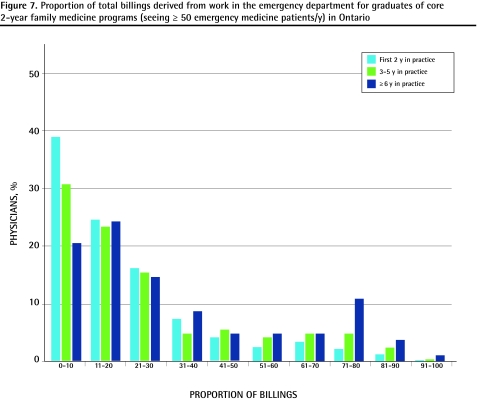
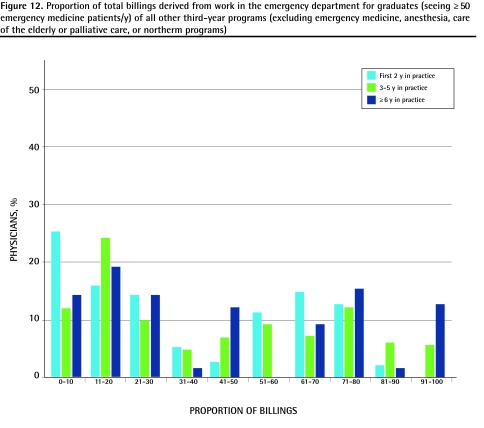
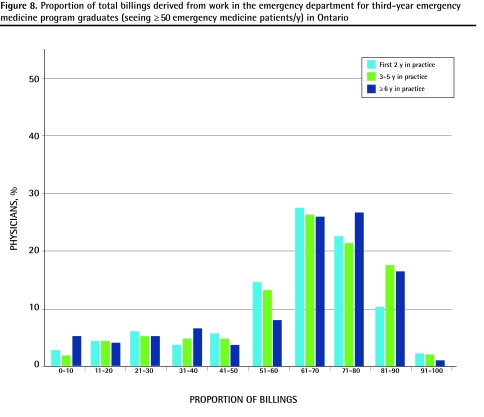
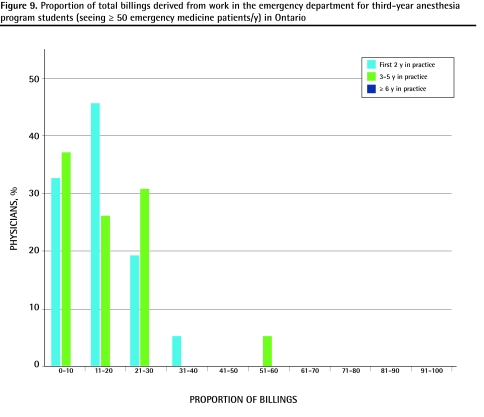
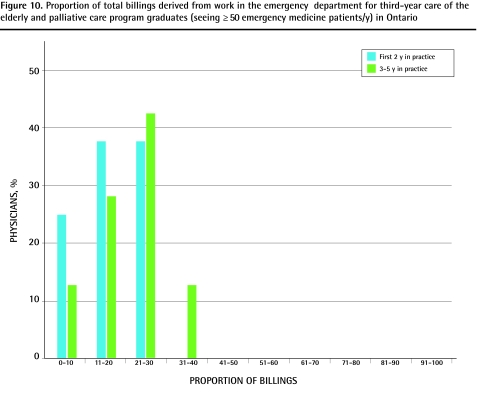
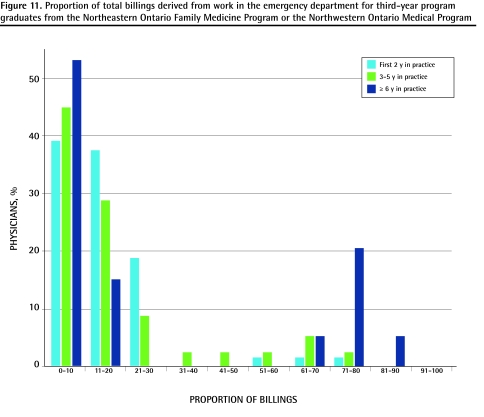
The proportions of graduates in each training category who met the defined service thresholds for each area of practice are summarized in Table 1. Comparisons between PGY3 graduates and core 2-year program graduates as well as changes within programs over time are also reported. These results are also presented graphically in more detail in Figures 1 to 6. Table 2 presents data on the proportion of physicians in each category of EM practice, as well as a comparison of practice distribution among training programs and within training programs over time. Figures 7 to 12 present these results graphically in more detail (by deciles). Table 3 presents the proportions of physician years in each quasi-specialty area by training program. We elected to compare these to an arbitrarily set limit of 1% to determine if there was significant movement away from general practice to more specialized practice.
Figure 1.
Comprehensiveness of care provided by graduates of core 2-year family medicine programs in Ontario
Figure 6.
Comprehensiveness of care provided by graduates of all other third-year programs (excluding emergency medicine, anesthesia, care of the elderly or palliative care, and northern program graduates) in Ontario
Table 2.
Proportion of physician years worked by physicians providing some EM (emergency department billings accounting for 0%–20% of total billings), moderate EM (21%–50%), mostly EM (51%–80%), or almost all EM (81%–100%) care, by type of training: A) First 2 years of practice after residency; B) years 3 to 5 in practice; C) years 6 and more in practice.
| A) | |||||
|---|---|---|---|---|---|
| PROPORTION OF TOTAL PHYSICIAN YEARS BY TYPE OF TRAINING (PROPORTION OF PHYSICIAN YEARS BY AMOUNT OF EM CARE) |
|||||
| TYPE OF TRAINING* | TOTAL NO. OF PHYSICIAN YEARS | SOME EM N = 596 PHYSICIAN YEARS | MODERATE EM N = 285 PHYSICIAN YEARS | MOSTLY EM N = 327 PHYSICIAN YEARS | ALMOST ALL EM N = 55 PHYSICIAN YEARS |
| PGY2 (all) | 733 | 63.4 (78.0) | 26.1 (67.0) | 8.9 (19.9) | 1.6 (21.8) |
| EM | 342 | 7.6 (4.4) | 16.1 (19.3) | 64.3 (67.3) | 12.0 (74.6) |
| Anesthesia | 34 | 76.5 (4.4) | 23.5 (2.8) | 0 (0) | 0 (0) |
| Elderly or palliative care | Cell numbers too small to report | ||||
| NOFM or NOMP | 46 | 76.1 (5.9) | 17.4 (2.8) | 6.5 (0.9) | 0 (0) |
| All others | 108 | 40.7 (7.3) | 21.3 (8.1) | 36.1 (11.9) | 1.9 (3.6) |
| B) | |||||
|
PROPORTION OF TOTAL PHYSICIAN YEARS BY TYPE OF TRAINING (PROPORTION OF PHYSICIAN YEARS BY AMOUNT OF EM CARE) |
|||||
| TYPE OF TRAINING†‡§ | TOTAL NO. OF PHYSICIAN YEARS | SOME EM N = 508 PHYSICIAN YEARS | MODERATE EM N = 274 PHYSICIAN YEARS | MOSTLY EM N = 354 PHYSICIAN YEARS | ALMOST ALL EM N = 104 PHYSICIAN YEARS |
| PGY2 (all) | 745 | 55.0 (80.7) | 25.2 (68.6) | 16.1 (33.9) | 3.7 (26.0) |
| EM | 331 | 6.3 (4.1) | 15.1 (18.2) | 59.9 (55.9) | 18.7 (59.6) |
| Anesthesia | 19 | 63.1 (2.4) | 31.6 (2.2) | 5.3 (0.3) | 0 (0) |
| Elderly or palliative care | Cell numbers too small to report | ||||
| NOFM or NOMP | 35 | 74.3 (5.1) | 14.3 (1.8) | 11.4 (1.1) | 0 (0) |
| All others | 110 | 35.4 (7.7) | 22.8 (9.1) | 28.2 (8.8) | 13.7 (14.4) |
| C) | |||||
|
PROPORTION OF TOTAL PHYSICIAN YEARS BY TYPE OF TRAINING (PROPORTION OF PHYSICIAN YEARS BY AMOUNT OF EM CARE) |
|||||
| TYPE OF TRAINING‡||§ | TOTAL NO. OF PHYSICIAN YEARS | SOME EM N = 198 PHYSICIAN YEARS | MODERATE EM N = 125 PHYSICIAN YEARS | MOSTLY EM N = 176 PHYSICIAN YEARS | ALMOST ALL EM N = 61 PHYSICIAN YEARS |
| PGY2 (all) | 322 | 45.6 (74.2) | 25.7 (65.6) | 22.1 (40.4) | 6.6 (36.1) |
| EM | 145 | 9.6 (7.1) | 15.9 (18.4) | 56.6 (46.6) | 17.9 (42.6) |
| Anesthesia | Cell numbers too small to report | ||||
| Elderly or palliative care | Cell numbers too small to report | ||||
| NOFM or NOMP | 19 | 68.4 (6.6) | 0 (0) | 26.3 (2.8) | 5.3 (1.6) |
| All others | 74 | 32.4 (12.1) | 27.0 (16.0) | 24.3 (10.2) | 16.3 (19.7) |
EM emergency medicine, NOFM Northeastern Ontario Family Medicine Program, NOMP Northwestern Ontario Medical Program, PGY2 postgraduate year 2.
Data from the Ontario Ministry of Health and Long-Term Care, April 2006.
First 2 years of practice: Distribution by type of training significantly different between those completing EM training and all other groups (P < .0001) and between “All others” and all other groups (P < .0001), but not between PGY2 and anesthesia or NOFM/NOMP.
Years 3–5 in practice: Distribution by type of training significantly different between those completing EM training and all other groups (P < .0001) and between “All others” and all other groups (P < .0001 vs EM, PGY2, and NOFM/NOMP; P = .03 vs anesthesia), but not between PGY2 and anesthesia or NOFM/NOMP.
Distribution of amount of EM within a particular type of training program significantly different later in practice (years 3–5 for elderly or palliative care, years ≥ 6 for all others vs years 1 and 2) for PGY2 (P < .001), NOFM/NOMP (P = .02), and “All others” (P = .002), but not for EM or anesthesia.
Over time the relative contribution of training programs other than EM to the “Mostly EM” (P < .0001) and “Almost all EM” (P = .003) categories increases significantly.
Years ≥ 6 in practice: Distribution by type of training significantly different between those completing EM training and all other groups (P < .0001) and between “All others” and all other groups (P < .0001 vs EM, P = .03 vs PGY2, P = .01 vs NOFM/NOMP), but not between PGY2 and NOFM/NOMP.
Figure 7.
Proportion of total billings derived from work in the emergency department for graduates of core 2-year family medicine programs (seeing = 50 emergency medicine patients/y) in Ontario
Figure 12.
Proportion of total billings derived from work in the emergency department for graduates (seeing = 50 emergency medicine patients/y) of all other third-year programs (excluding emergency medicine, anesthesia, care of the elderly or palliative care, or northerm programs)
Table 3.
Proportion of physician years worked by physicians with quasi-specialty designations, by type of training program: A) First 2 years of practice after residency; B) years 3 to 5 in practice; C) years 6 and more in practice.
| A) | ||||||
|---|---|---|---|---|---|---|
| PROPORTION OF PHYSICIAN YEARS (95% CI) |
||||||
| TYPE OF TRAINING | TOTAL NO. OF PHYSICIAN YEARS | HOSPITALIST | SURGERY | SURGICAL ASSISTANT | ANESTHESIA | PSYCHOTHERAPY |
| PGY2 (all) | 2051 | 1.1 (0.7–1.7) | 0 | 0.15 (0.03–0.4) | 0.1 (0.01–0.3) | 0.8 (0.5–1.3) |
| EM | 347 | 0 | 0 | 0.3 (0.01–1.6) | 0.6 (0.1–2.1) | 0 |
| Anesthesia | 47 | 0 | 0 | 0 | 42.6 (28.3–57.8)* | 0 |
| Elderly or palliative care | 31 | 25.8 (11.9–44.6)* | 0 | 0 | 0 | 0 |
| NOFM or NOMP | 53 | 1.9 (0.5–10.1) | 0 | 0 | 5.7 (1.2–15.7)† | 0 |
| All others | 224 | 1.3 0.3–3.9) | 0.9 (0.1–3.2) | 0 | 2.2 (0.7–5.1)‡ | 1.8 (0.5–4.5) |
| B) | ||||||
|
PROPORTION OF PHYSICIAN YEARS (95% CI) |
||||||
| TYPE OF TRAINING | TOTAL NO. OF PHYSICIAN YEARS | HOSPITALIST | SURGERY | SURGICAL ASSISTANT | ANESTHESIA | PSYCHOTHERAPY |
| PGY2 (all) | 2422 | 1.0 (0.1–1.5) | 0.04 (0.001–0.2) | 0.1 (0.01–0.3) | 0.3 (0.1–0.6) | 0.7 (0.4–1.1) |
| EM | 346 | 0 | 0 | 0.3 (0.01–1.6) | 0.9 (0.2–2.5) | 0 |
| Anesthesia | 34 | 0 | 0 | 0 | 41.2 (24.6–59.3)* | 0 |
| Elderly or palliative care | 24 | 16.7 (4.7–37.4)* | 0 | 0 | 0 | 0 |
| NOFM or NOMP | 48 | 0 | 0 | 0 | 4.2 (0.5–14.3)‡ | 0 |
| All others | 246 | 1.2 (0.3–3.5) | 1.6 (0.4–4.1) | 0 | 6.1 (3.5–9.9)* | 0.4 (0.01–2.2) |
| C) | ||||||
|
PROPORTION OF PHYSICIAN YEARS (95% CI) |
||||||
| TYPE OF TRAINING | TOTAL NO. OF PHYSICIAN YEARS | HOSPITALIST | SURGERY | SURGICAL ASSISTANT | ANESTHESIA | PSYCHOTHERAPY |
| PGY2 (all) | 1389 | 1.8 (1.2–2.6)§ | 0 | 0.5 (0.2–1.0) | 0.43 (0.2–0.9) | 0.6 (0.2–1.1) |
| EM | 159 | 1.3 (0.2–4.4) | 0 | 0 | 1.3 (0.2–4.4) | 0 |
| Anesthesia | Cell numbers too small to report | |||||
| Elderly or palliative care | Cell numbers too small to report | |||||
| NOFM or NOMP | 22 | 0 | 0 | 0 | 0 | 0 |
| All others | 168 | 0 | 1.8 (0.4–5.1) | 0 | 10.1 (6.0–15.7)* | 0 |
CI confidence interval, EM emergency medicine, NOFM Northeastern Ontario Family Medicine Program, NOMP Northwestern Ontario Medical Program, PGY2 postgraduate year 2.
Data from the Ontario Ministry of Health and Long-Term Care, April 2006.
Significantly greater than a hypothesized value of ≤ 1% (1-sided test of proportions), P < .0001.
Significantly greater than a hypothesized value of ≤ 1% (1-sided test of proportions), P < .001.
Significantly greater than a hypothesized value of ≤ 1% (1-sided test of proportions), P < .05.
Significantly greater than a hypothesized value of ≤ 1% (1-sided test of proportions), P < .01.
DISCUSSION
There are significant differences between the practice patterns of PGY3 program graduates and those of core program graduates. Graduates of PGY3 programs are more likely to be involved in the delivery of care in nonoffice settings, particularly hospitals. By far most core program graduates also participate in out-of-office care, with only 13.8% initially and less than 20% after 6 years having “office-only” practices. Concerns that have been expressed about substantial diversion into specialized niche practices are largely unfounded, with only a very small number of recent graduates being classified as “quasi-specialists.” The type of training undertaken has a substantial effect on the areas of care included in future practice. Graduates of EM programs are significantly more likely than graduates of any other program to include work in the emergency department as part of their practices, with 98.6% doing so initially. This proportion remains high but drops in later years. Emergency medicine graduates are also more likely to work in hospital settings and provide anesthesia services, but are less likely to provide home visits, nursing home visits, or obstetric services than core program graduates are. About 75% of this group practises mostly EM, but less than 18% is considered to be practising “almost all” EM.
During the first 2 years of practice, we found significantly fewer EM program graduates practising “almost all” EM than did Chan (12% vs 36%).2 Although basic differences in our definitions could account for this (we used proportion of billings rather than proportion of visits), we also used a more liberal definition (> 80% of billings vs > 90% of visits) than Chan, which should have had the opposite effect. Other possible explanations include the substantial changes that occurred in the postgraduate training system and the expansion of the numbers of positions offered over time. Our data also show that core program graduates and graduates of non-EM enhanced skills training programs continue to play important roles in the provision of EM services in Ontario, with more than 70% of physician years identified as coming from these categories. While most of these physicians practise “some” (0% to 20% of billings) or “moderate” (21% to 50%) amounts of EM, by 6 years after residency and beyond they also made up more than half of the “mostly” (51% to 80%) and “almost all” (81% to 100%) EM groups. This is consistent with the findings of Bhimani et al who, in their 2005 survey of emergency departments in southwestern Ontario, found that 70% of physicians practising in the emergency departments they studied were family physicians with no formal additional EM training.6
Graduates of other programs also demonstrated increased involvement in nonoffice care, with the strongest effects being in the areas in which they had trained. All PGY3 graduates were more likely to include hospital inpatient care in their practices initially and, except for graduates of care of the elderly or palliative care programs, to work in the emergency department. Category 2 programs include programs with additional training in obstetrics, and the high rates of participation in this important area of FM is evident—more than a third of PGY3 graduates in these categories included obstetrics in their practices in the first 2 years and more than a quarter were still doing so after 6 years of practice. As is the case with EM, it is important to recognize the essential contributions of core program graduates to this area of service, with approximately two-thirds of those practising obstetrics having no additional formal training. This finding highlights the importance of maintaining adequate educational experiences in intrapartum obstetrics in the core FM training program in addition to providing additional experience through PGY3 opportunities.
There were no statistically significant differences in rural versus urban practice location between graduates of EM, care of the elderly or palliative care, and other category 2 programs and their core program peers. Only anesthesia and category 2 programs offered by the Northeastern Ontario Family Medicine Program and the Northwestern Ontario Medical Program were associated with increased rural practice. This contradicts the findings of previous studies that showed that EM training was significantly associated with a trend toward urban (odds ratio 2.62, 95% confidence interval 1.19 to 5.75) rather than rural (odds ratio 0.30, 95% confidence interval 0.13 to 0.67) practice, and that non-EM additional training resulted in increased rural practice (P < .001).2,7 There are some likely reasons for this. First, we were limited to examining the practices of residents trained in Ontario who remained in Ontario after graduation. Compared with what was reported by Hutton-Czapski and Thurber, our data show less participation in rural practice for core program graduates (15.7% vs 20.9%) and more participation in rural practice for EM graduates (13.8% vs 6.5% early in practice.).7 Our rates (13.8% initially, 8.2% later in practice) are closer to those reported by Chan (10.1%) in his cross-sectional survey of physicians with the CCFP(EM) designation in Ontario in 1999 and 2000, so regional variation could be a factor.2 The effects of large urban medical schools, such as the University of Toronto in Ontario, which are known to produce fewer rural physicians, might explain the lower overall rate of participation in rural practice. In addition, any PGY3 EM graduates seeking work in large urban centres outside of Ontario would have been excluded from the study. The fact that we were comparing 2 fairly homogeneous groups who have relatively greater access to PGY3 training than their counterparts in other regions (Ontario has more PGY3 positions per graduating PGY2 trainee than most other provinces) could also explain the relative lack of effect on location of practice.
Limitations
There are some limitations to our analysis. We were provided with summary information by type of training and year of graduation only and did not have access to individual physician-level data, so were not able to conduct logistic regression analyses to examine the effects of possible confounding variables such as age, sex, or rural location of provider on our outcomes of interest. In addition there was a relatively limited follow-up period, with a maximum of 9 years of practice being possible given the start date for our study cohort. Changes in practice patterns were noted between the earliest and latest practice periods for many of the groups and there is good reason to believe that these trends will continue over time. This is of particular importance when considering how we think about those physicians who place a large emphasis on one area of practice initially (eg, EM program graduates in the “mostly” or “almost all” EM categories or anesthesia program graduates with a quasi-specialty designation in that area). Some have argued that they are not really family physicians, but actually specialists in their areas.8 Our data show that participation in out-of-office care is in fact the norm, rather than the exception, in FM and that work profiles of PGY3 graduates evolve toward more office-based practice over time. As any specified value for the amount of traditional office-based family practice required to be considered a family physician is arbitrary, we think that an inclusive view that embraces all family physicians, regardless of their area of specialization is more appropriate. In addition, it is important to recognize that while receiving additional training is associated with increased participation in certain areas of practice, it is not necessarily causal. As resident interest is the primary driver for participation in these programs, it is quite possible that many of these individuals would pursue their interests even in the absence of additional training.
Conclusion
Participation in PGY3 training is strongly associated with increased participation in care outside the office. This effect is greatest in their areas of specialization, but for many trainees it also extends to other areas, particularly those based in hospitals. While this is not the only possible definition of comprehensiveness of care, it is one that can be measured and that addresses the needs of the public for access to a range of health care services. Access to additional training, particularly resident-driven category 2 programs, might be one way to ensure that comprehensive FM continues to be a vital component of our health care system. While we think that EM program graduates should be thought of as family physicians with a special area of interest, they generally devote most of their time to practising EM, at least in the first 9 years of practice. The need for EM physicians should therefore be an important factor in determining the number of positions offered in this area.
Figure 2.
Comprehensiveness of care provided by graduates of third-year programs in emergency medicine in Ontario
Figure 3.
Comprehensiveness of care provided by graduates of third-year programs in anesthesia in Ontario
Figure 4.
Comprehensiveness of care provided by graduates of third-year programs in care of the elderly and palliative care in Ontario
Figure 5.
Comprehensiveness of care provided by graduates of third-year programs other than emergency medicine (all years) or anesthesia (2000–2001 to 2002–2003) from the Northeastern Ontario Family Medicine Program or the Northwestern Ontario Medical Program
Figure 8.
Proportion of total billings derived from work in the emergency department for third-year emergency medicine program graduates (seeing = 50 emergency medicine patients/y) in Ontario
Figure 9.
Proportion of total billings derived from work in the emergency department for third-year anesthesis program students (seeing = 50 emergency medicine patients/y)
Figure 10.
Proportion of total billings derived from work in the emergency department for third-year care of the elderly and palliative care program graduates (seeing = 50 emergency medicine patients/y) in Ontario
Figure 11.
Proportion of total billings derived from work in the emergency department for third-year program graduates from the Northeastern Ontario Family Medicine Program or the Northwestern Ontario Medical Program
Acknowledgment
This study was funded by the Council of Ontario Universities and the Ontario Ministry of Health and Long-Term Care. The views presented here are those of the authors and not of the Ministry of Health and Long-Term Care or the Council of Ontario Universities. We would like to thank the members of our steering committee for their valuable input: Anna Cain, Marg Harrington, Dr Leslie Flynn, Dr Maureen Topps, Dr David Tannenbaum, Dr Roy Wyman, and Dr Erika Catford.
EDITOR’S KEY POINTS
In recent years there has been a slow trend away from comprehensive family medicine practice, as defined by participation in care in various nonoffice settings. Providing family medicine trainees with the skills to provide such services is among the goals of enhanced skills training programs. This study aimed to explore the practice patterns of graduates of such programs.
The authors found significant differences in the practice patterns of third-year program (PGY3) graduates and those of core program graduates. Graduates of PGY3 programs are more likely to provide care in nonoffice settings, but by far most core program graduates also participate in out-of-office care; only 13.8% initially and less than 20% after 6 years have “office-only” practices. Concerns about substantial diversion into specialized niche practices are largely unfounded, as only a very small number of recent graduates are classified as “quasi-specialists.”
Participation in PGY3 training is strongly associated with increased participation in care outside the office. Access to additional training might be one way to ensure that comprehensive family medicine continues to be a vital component of our health care system.
POINTS DE REPÈRE DU RÉDACTEUR
Au cours des dernières années, on a observé une tendance à s’éloigner lentement de la pratique de la médecine familiale complète, telle que définie par la participation à des soins dans divers milieux ailleurs qu’en cabinet. Les programmes de formation en compétences avancées ont entre autres pour but de donner aux stagiaires en médecine familiale les habiletés voulues pour offrir de tels services. Cette étude vise à explorer les habitudes de pratique des diplômés de ces programmes.
Les auteurs ont observé des différences importantes dans les habitudes de pratique des diplômés de programmes de formation de 3 ans (R3) par rapport aux diplômés des programmes de formation de base. Les diplômés des programmes de R3 sont plus enclins à offrir des soins dans des milieux ailleurs qu’en cabinet mais, de loin, la majorité des diplômés des programmes de base participent aussi aux soins hors cabinet; seulement 13,8 % initialement et moins de 20 % après 6 ans ont des pratiques « exclusivement en cabinet ». Les inquiétudes à propos d’une diversion importante vers des pratiques en niches spécialisées sont largement non fondées, puisque seulement un très petit nombre de récents diplômés sont classifiés comme étant « quasi-spécialistes ».
La formation de 3e année est fortement associée à une plus grande participation à des soins à l’extérieur des cabinets. L’accès à une formation additionnelle pourrait être un moyen d’assurer que la médecine familiale complète continue d’être une composante essentielle de notre système de santé.
Footnotes
Competing interests
Dr Green, Dr Birtwhitle, and Mr MacDonald all received consulting fees from the Ontario Ministry of Health and Long-Term Care and the Council of Ontario Universities to conduct this research.
Contributors
Dr Green, Dr Birtwhistle, and Mr MacDonald all contributed to the study design. Dr Green and Mr Schmelzle performed the key informant interviews and conducted the analysis of survey results. Mr Kane and Dr Green performed the analysis of administrative data. All authors contributed to the drafting and revising of the manuscripts.
*Full text is available in English at www.cfp.ca.
The companion paper on resident and program director perspectives on third-year family medicine programs can be found on page 904.
This article has been peer reviewed.
References
- 1.Green M, Birtwhistle RV, MacDonald K, Schmelzle J. Resident and program director perspectives on third-year family medicine programs. Can Fam Physician. 2009;55:904-5.e1–8. [PMC free article] [PubMed] [Google Scholar]
- 2.Chan BT. Do family physicians with emergency certification actually practise family medicine? CMAJ. 2002;167(8):869–70. [PMC free article] [PubMed] [Google Scholar]
- 3.Sansom R, Doig G, Morris K. A survey of recently trained general practitioner anesthetists in Ontario. Part I: does residency training adequately prepare them for practice. Can J Rural Med. 2001;6(4):263–8. [Google Scholar]
- 4.Chan BT. The declining comprehensiveness of primary care. CMAJ. 2002;166(4):429–34. [PMC free article] [PubMed] [Google Scholar]
- 5.Chan BT, Schulz S. ICES Investigative Report. Toronto, ON: Institute for Clinical Evaluative Sciences; 2005. Supply and utilization of general practitioner and family physician services in Ontario. [Google Scholar]
- 6.Bhimani M, Dickie G, McLeod S, Kim D. Emergency medicine training demographics of physicians working in rural and regional southwestern Ontario emergency departments. Can J Emerg Med. 2007;9(6):449–52. doi: 10.1017/s1481803500015487. [DOI] [PubMed] [Google Scholar]
- 7.Hutton-Czapski P, Thurber AD. Who makes Canada’s rural doctors? Can J Rural Med. 2002;7(2):95–100. [Google Scholar]
- 8.Moore K, Lucky CA. Emergency medicine training in Canada. [Accessed 2009 Jul 16];Can J Emerg Med. 1999 1(1):51–3. doi: 10.1017/s1481803500007077. Available from: www.cjem-online.ca/v1/n1/p51. [DOI] [PubMed] [Google Scholar]


