

Abstract
Background
Given the immuno-modulatory activity of native haemozoin (Hz), the effects of constitutive Hz components on immune response are of interest. Recently, gene expression changes mediated by HNE and the synthetic analogue of Hz, beta-haematin (BH), were identified and implicated a significant role for lipid peroxidation products in Hz's activity. The study presented herein examines gene expression changes in response to 15(S)-hydroxyeicosatetraenoic acid (HETE) in a model macrophage cell line.
Methods
LPS-stimulated RAW 264.7 macrophage-like cells were treated with 40 μM 15(S)-HETE for 24 h, and microarray analysis was used to identify global gene expression alterations. Fold changes were calculated relative to LPS-stimulated cells and those genes altered at least 1.8-fold (p value ≤ 0.025) were considered to be differentially expressed. Expression levels of a subset of genes were assessed by qRT-PCR and used to confirm the microarray results.
Results
Network analysis revealed that altered genes were primarily associated with "lipid metabolism" and "small molecule biochemistry". While several genes associated with PPAR-gamma receptor-mediated signaling were differentially expressed, a number of genes indicated the activation of secondary signaling cascades. Genes related to cytoadherence (cell-cell and cell-matrix), leukocyte extravasation, and inflammatory response were also differentially regulated by treatment, supporting a potential role for 15(S)-HETE in malaria pathogenesis.
Conclusion
These results add insight and detail to 15-HETE's effects on gene expression in macrophage-like cells. Data indicate that while 15-HETE exerts biological activity and may participate in Hz-mediated immuno-modulation, the gene expression changes are modest relative to those altered by the lipid peroxidation product HNE.
Background
Although haem is a vital cofactor for a diverse set of proteins involved in respiration, oxygen transport, and drug detoxification, the accumulation of free haem has deleterious effects. Haem is capable of binding to lipid bilayers, catalyzing lipid peroxidation, inhibiting enzymatic activity, and lysing cells and parasites [1,2]. Many organisms utilize the haem oxygenase pathway to degrade free haem. Blood-feeding Plasmodium parasites, the source of malaria infection, lack such a pathway. Consequently, haem released during haemoglobin catabolism is sequestered as the insoluble crystalline "malaria pigment" (i.e., haemozoin [Hz]). As most of the haem is occluded within the crystal, the parasite is protected.
Hz is composed of five-coordinate Fe (III) protoporphyrin IX dimers covalently bound by reciprocal iron-carboxylate bonds [3]. The remaining propionate side chains of adjacent dimers form hydrogen bonds, resulting in an extended dimeric network producing the Hz crystal. In its native state, Hz is coated by an array of host- and parasite-derived lipids, proteins, and nucleic acids [4]. Analysis of the lipid component identified peroxidation products including a racemic mixture of 5-, 8-, 9-, 11-, 12-, and 15-hydroxyeicosatetraenoic acids (HETEs) and 9- and 13- hydroxyoctadecadienoic acids (HODEs) [5]. Elevated levels of 4-hydroxynonenal (HNE) were also detected in haemozoin-laden monocytes [6] at the highest reported concentration of any biological system to date [7].
Rupture of parasitized red blood cells (RBCs) releases cellular debris, including residual bodies containing Hz, into the host's vasculature and triggers an innate immune response. The typical response of phagocytic cells to such foreign material includes oxidative burst and rephagocytosis, however, phagocytosis of Hz impairs these innate functions [8-10]. It has been suggested that Hz's immunological activity may not stem from the haem moiety but from nonspecific toxins [11], such as lipid peroxidation products, present on its surface and introduced into the cell during phagocytosis
The cellular response to several lipid peroxidation species associated with Hz is well documented and indicates an involvement in malaria pathophysiology. Recently, two components of native Hz were targeted as potential players involved in macrophage dysfunction [12]. Microarray analysis of the response to HNE and Hz's biologically naïve synthetic analogue, β-haematin (BH), indicated a potential role for HNE in malaria pathogenesis. It seemed probable, given HNE-mediated gene expression changes, that other biologically active lipid peroxidation products generated by Hz, including 15-HETE, may be active in the disease's pathogenesis.
Macrophage-like cells treated with 15-HETE exhibited impaired PMA-activated NADPH oxidase and LPS-stimulated inducible nitric oxide synthase (iNOS) activities, mimicking Hz-mediated monocyte immunomodulation [13]. 15-HETE was also reported to enhance vascular permeability/oedema [14] and RBC adherence to endothelia [15], two hallmarks of malarial infection. The present study examined steady-state gene expression changes induced by 15-HETE in activated RAW 264.7 model macrophage cells in the context of a nonspecific malaria toxin that may be involved in disease pathophysiology.
Methods
Cell culture
Murine macrophage-like RAW 264.7 cells (American Type Culture Collection TIB-71, Monassas, VA) were cultured under standard incubation conditions (37°C, 5% CO2) and grown in RPMI supplemented with 10% FBS (Atlanta Biologicals, Atlanta, GA) and 1 μg/mL P/S (Cellgro MediaTech, Herndon, VA). Cells were plated at a density of 4 × 10⁶ cells/well in six well plates and incubated for 24 h prior to treatment.
Cell treatment and RNA isolation
Cells were washed once with Dulbecco's PBS (DPBS) and treated with 40 μM 15(S)-HETE. Immediately following treatment, LPS was added to all wells at a final concentration of 1 μg/mL. After 24 h, cells were washed three times with DPBS and scraped from the wells. Three biological replicates (composed of six pooled wells each) per sample were prepared. Total RNA was isolated using the Versagene RNA purification and DNase treatment kits, following the manufacturer's recommendations.
Microarray analysis
Microarray analysis was performed by the Vanderbilt Microarray Shared Resource. Three biological replicates of each treatment were analyzed for quality (Agilent 2100 Bioanalyzer, Agilent Technologies, Palo Alto, CA). One microgram of total RNA (30 ng mRNA) was used to generate first strand cDNA using the NanoAmp RT-IVT labeling kit according to the manufacturer's protocol. Following first strand synthesis, second strand synthesis was completed. The resulting cDNA was then purified using an ABI kit-provided column and the entire reaction was used in an IVT reaction to generate DIG-labeled cRNA. The cRNA was then purified using a kit-provided column and assessed for quality on an Agilent Bioanalyzer. All reactions meeting ABI criteria in terms of quantity and size of target produced were fragmented and then hybridized to an ABI mouse genome survey microarray for 16 h with agitation at 55°C per the manufacturer's protocol. Following the addition of the chemiluminescence reaction substrate, each array was immediately imaged on the 1700 Chemiluminescent Analyzer, and a primary analysis was completed by the AB1700 Expression Array System Software (v 1.1.1). Expression values were quantile normalized and filtered based on S/N (> 3) and flag value (< 5000). GeneSpring GX 7.3.1 software (Agilent Silicon Genetics, Redwood City, CA) was used to determine statistically significant differentially expressed genes. T-tests were performed on probes altered by ≥ 1.8-fold in 2 of 3 samples (0.025 p value cut-off, Benjamini-Hochberg multiple testing correction, parametric test, variances not assumed equal) in treated stimulated cells (experimental) relative to stimulated cells (control). Genes were classified according to genes ontology (GO) terms using GeneSpring. In accordance with MIAME procedure, microarray data have been submitted to the NCBI Gene Expression Omnibus and can be found under series number GSE15070. Nomenclature for genes and proteins is as described by the Mouse Genome Informatics (MGI) database guidelines.
Ingenuity pathway analysis
Ingenuity Pathways Analysis (IPA) was used for gene expression analysis (Ingenuity Systems®). A data set containing gene identifiers and corresponding expression values was uploaded into the application, and each identifier was mapped to its corresponding gene object in the Ingenuity knowledge base (IKB). A functional analysis was performed to determine biological functions that were most significant to the genes in the data set. A network analysis was also performed whereby focus genes were overlaid onto a global molecular network developed from information contained in the IKB. Networks of focus genes were then algorithmically generated based on their connectivity. A functional analysis of each network identified the biological functions that were most significant to the genes in the network, and canonical pathway analysis identified the pathways from the IPA library of canonical pathways that were most significant to the data set. Fischer's exact test was used to calculate a p value determining the probability that that each biological function assigned to a network or data set, or the association between the genes in the data set and the canonical pathway, are explained by chance alone.
Real-time reverse transcription polymerase chain reaction
Quantitative real-time reverse transcription polymerase chain reaction (qRT-PCR) was used to validate the expression levels of genes identified as differentially expressed by microarray analysis. Quadruplicate measurements for n = 3 independent biological replicates per sample were performed. cDNA was reverse-transcribed from 0.5 μg of total RNA using random hexamer primers and Superscript II Reverse Transcriptase (Invitrogen). Reactions were purified using Qiagen's PCR Purification Kit following the manufacturer's protocol. Following RT, all assays were performed with Applied Biosystems TaqMan FAM labeled 20× probes: Arf3 (Taqman assay Mm00500194_m1), Cldn11 (Mm00500915_m1), Cxcl11 (Mm00444662_m1), Mapk14 (Mm00442497_m1), Prdx1 (Mm01621996_s1), Sdc1 (Mm00448918_m1), and Egr1 (Mm00656724_m1). Ywhaz was chosen as the endogenous control based on results obtained from an Applied Biosystems mouse endogenous control array. cDNA amplification was performed using TaqMan 2× Universal PCR Master Mix (Applied Biosystems), and standard Taqman cycling conditions were used as specified by the manufacturer. Cycling and data collection were performed using the Applied Biosystems 7900 HT instrument, and analysis was performed using SDS software to calculate Ct values for each detector. Ct values were processed based on the comparative Ct method where the relative transcript level of each target gene was calculated according to the equation 2-ΔCt, where ΔCt is defined as Ct target gene – Ct Ywhaz.
Results
Functional analysis of gene expression changes induced by 15(S)-HETE
LPS-stimulated macrophage-like RAW 264.7 cells were treated for 24 h with 40 μM 15(S)-HETE based on the estimate that trophozoites and Hz contained 33–39 μmol 15-HETE/L RBC [5]. Statistically significant (p ≤ 0.025) changes in gene expression (fold change ≥ 1.8 relative to stimulated cells) were identified by microarray analysis. Given that this study aims to explore potential alterations in gene expression that are incurred by 15-HETE during haemozoin phagocytosis, differentially expressed mRNAs were controlled by comparison with a particulate latex bead challenge and BH treatment under the same conditions. Figure 1 illustrates that 15-HETE had a much greater effect on induction of gene expression than repression (293 transcripts versus 100 transcripts, respectively), but overall was very modest compared to either latex bead or BH treatment.
Figure 1.
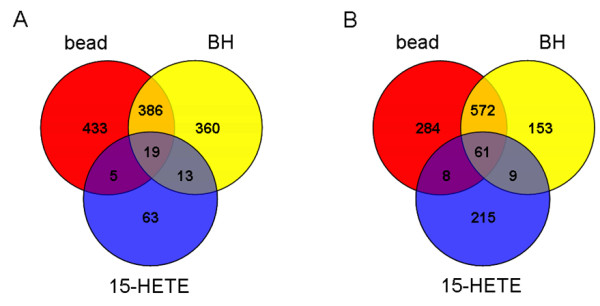
Comparison of differentially expressed genes mediated by 15-HETE, beta-haematin, and latex beads. Venn diagrams show the intersection of genes that were transcriptionally altered by 40 μM 15-HETE with those altered by latex bead treatment and serum-opsonized beta haematin (BH) (0.1 mg/mL). Numbers represent statistically significant (p ≤ 0.025) transcripts up- or down-regulated ≥ 1.8-fold in 2 of 3 samples, relative to LPS-stimulated untreated cells at 24 h. (A) Decreased and (B) increased expression are shown separately.
Ingenuity Pathway Analysis (IPA) software was used to examine biological relationships associated with 15-HETE-mediated expression changes. Identifiers and relative levels of altered genes comprising the data set were imported and mapped by IPA for comparison to molecules within the Ingenuity knowledge base (IKB). Two types of IPA analyses were performed. First, a network analysis was employed to reveal direct and indirect relationships that exist between specific genes in the data set. This analysis resulted in the generation of a network map which illustrates direct and indirect connections between focus genes. Second, a functional analysis was performed to identify the biological processes that are most relevant to the entire set of differentially expressed genes. This analysis resulted in a list of significant biological functions associated with the data set as a whole. Functional analyses were also used to find biological processes associated with individual networks. Focus genes, imported genes that are eligible for generating interaction networks based on incorporation in IKB, were used to identify relationships based on known interactions in the literature. Each network is associated with a score indicating the likelihood that the focus genes occur in the network by random chance. Networks scoring 10 or higher (score is defined as -log (p value)) are considered significant.
Among the transcripts modulated by 15-HETE treatment, 263 were eligible for network analysis based on IPA criteria, mapping to 11 relevant interaction networks. The most significant network (Figure 2a) had a score of 51 and associated 27 focus genes. Several transcriptional regulators were among the products encoded by these genes (Bclaf1, Med1, Noc2l, Rnf4, and Zfp36l1). This network also contained Il1b, Cyp3a4, Gnas, and Adfp. A functional analysis performed on this particular network indicated that the differentially expressed genes were associated with "lipid metabolism" and "small molecule biochemistry" (p = 1.27 × 10⁻⁴).
Figure 2.
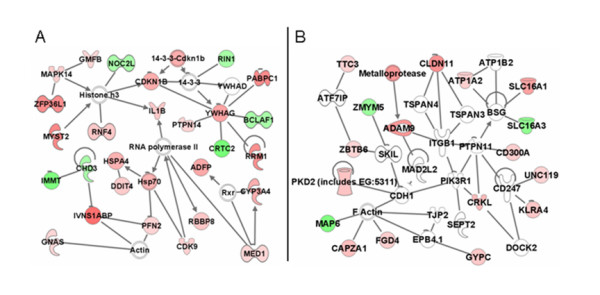
Ingenuity Pathway network analysis. Transcripts altered ≥ 1.8-fold (p ≤ 0.025) in 15-HETE-treated RAW 264.7 cells (i.e., focus genes) were overlaid onto a global molecular network developed from information contained in the Ingenuity knowledge base (IKB). Networks of these focus genes were algorithmically generated based on their connectivity. Networks show direct interactions between focus genes altered by 15-HETE treatment and associated molecules within the IKB. Genes or gene products are represented as nodes, and the biological relationship between two nodes is represented as an edge (line). White nodes represent IKB molecules that are associated with focus genes. All edges are supported by at least one reference stored in the IKB. The intensity of node color indicates the degree of up- (red) or down- (green) regulation. Networks reflect (A) lipid metabolism and small molecule biochemistry and (B) molecular transport and cellular movement.
Figure 2b shows the second most significant interaction network identified by IPA network analysis. Eighteen focus genes were incorporated into the network with a score of 29. Functional analysis of the network revealed that the genes were involved in "molecular transport" (p = 9.42 × 10⁻⁷) and "cellular movement" (p = 9.77 × 10⁻⁶). This network is enriched with focus genes encoding molecules associated with the plasma membrane such as Pkd2, Cd300a, Cldn11, Gypc, Klra4, peptidase Adam9 and transporters Atp1a2, Slc16a1, and Slc16a3. Consistent with these genes, the network predicted interactions with several other plasma membrane molecules (Tjp2, Bsg, Cdh1, Tspan3, Tspan4, Cd247, Itgb1, and Atp1b2) that were not present in the data file.
Molecular and cellular functions controlled by 15(S)-HETE
It is thought that Hz impairs cellular function through the generation and introduction of toxic species such as lipid peroxidation products into cells. Previously, the ability of HNE to stimulate a transcriptional response was examined in macrophage-like cells [12]. It was observed that HNE significantly impacted a wide range of steady-state responses (e.g., macrophage activation, immune and inflammatory responses, NF-κB signal transduction, ECM degradation, and dyserythropoiesis). Comparison of the number of gene expression changes influenced by 15-HETE and HNE indicates that 15-HETE modulates a number of mRNA targets but is a much less potent agent than HNE (Figure 3).
Figure 3.
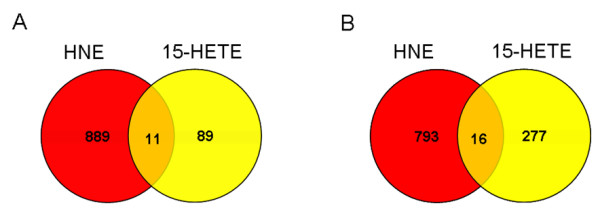
Comparison of differentially expressed genes mediated by 15-HETE and HNE. Data sets for each treatment group (15-HETE or HNE) were generated from statistically significant (p ≤ 0.025) transcripts up- or down-regulated ≥ 1.8-fold in 2 of 3 samples relative to untreated LPS-stimulated cells. Venn diagrams show intersections of the resulting 15-HETE and HNE data subsets. (A) Decreased and (B) increased expression are shown separately.
IPA was also used to perform a functional analysis on genes within the entire data set. Comparison of the biological functions modulated by 15-HETE (Table 1) and HNE [12] revealed that 15-HETE affected a considerably smaller group of transcripts than HNE but mediated a comparable response in terms of the number of molecular and cellular functions and the specific categories affected. Both lipid peroxidation products altered "Cell Cycle", "Cell Morphology", "Cellular Assembly and Organization", "Cell Death", "Cellular Development", "Cell Growth and Proliferation", "Gene Expression", and "Small Molecule Biochemistry". 15-HETE affected several unique categories including "Carbohydrate Metabolism", "Drug Metabolism", "Lipid Metabolism", "Molecular Transport", "RNA Damage and Repair", and "RNA Post-Translational Modification".
Table 1.
Functional Analysis of 15-S-HETE Data Seta
| Biological Function | p value |
| carbohydrate metabolism | 6.42 ×10⁻⁶ |
| cell cycle | 1.28 × 10⁻⁴ |
| cell death | 1.93 × 10⁻⁵ |
| cell morphology | 2.53 × 10⁻⁴ |
| cellular assembly and organization | 5.30 × 10⁻⁴ |
| cellular compromise | 4.52 × 10⁻⁴ |
| cellular development | 3.42 × 10⁻⁵ |
| cellular growth and proliferation | 3.81 × 10⁻⁴ |
| drug metabolism | 3.81 × 10⁻⁴ |
| gene expression | 2.22 × 10⁻⁴ |
| lipid metabolism | 1.25 × 10⁻³ |
| molecular transport | 3.81 × 10⁻⁴ |
| RNA damage and repair | 3.79 × 10⁻⁴ |
| RNA post-transcriptional modification | 3.79 × 10⁻⁴ |
| small molecule biochemistry | 3.81 × 10⁻⁴ |
a Ingenuity Pathway Analysis uses a right-tailed Fisher exact test to calculate p values. Significance values for each data set indicate the probability that the association between the genes and the given biological function is due to random chance.
Both IPA network and functional analyses identified a large group of "lipid metabolism" and "carbohydrate metabolism" expression changes. Given that Il1b acts upstream of Cyp3a4, Ugdh, Gnas, Gm2a, Psen1, and Il15, stimulated Il1b expression may be indirectly involved in the up-regulation of each of these genes in this study. Expression of several "small molecule biochemistry" transcriptional regulators (Bclaf1, Med1, Rnf4, Noc2l, and Zfp36l1) was also identified.
Differential gene expression in the context of malaria pathogenesis
Differentially expressed genes were sorted into lists based on the direction of regulation, and corresponding Gene Ontology (GO) categories were identified. Gene expression alterations mediated by 15-HETE were compared to two groups of transcripts. The first group consisted of specific genes or gene products associated with human [16] or murine [17,18] models of malarial infection or Hz exposure [19]. Common transcripts were primarily associated with "cell-to-cell signaling and interaction" and "immune response" (e.g., Fcgrt, Cd86, C5ar1, Ccr4, Mapk14, Pik3ap1, Tapbp, and Tnfaip6). Enhanced expression of guanylate nucleotide binding proteins (Gbp) 1 and 3 observed in this study was consistent with expression changes reported in human and experimental murine malaria [16-18,20]. The second group included genes classified under specific GO processes that are overexpressed in the Plasmodium yoelii model [20] and/or naturally acquired Plasmodium falciparum infections [21], including cell-cell signaling, defense response, immune response, inflammatory response, and signal transduction, among others. Differential expression mediated by 15-HETE treatment that correlated with either of the two groups described above is listed in Table 2. The relatively limited correlation reflects differences between 15-HETE-mediated expression changes in this model and expression changes observed during naturally acquired or experimental malaria. While RAW 264.7 cells have previously been shown to mimic monocyte/macrophage immuno-modulation in the presence of HNE [12], the findings presented herein suggest that 15-HETE is not a major contributor to the altered immune response observed in these cells types during infection.
Table 2.
Select Gene Expression Changes Mediated by 15-HETEa
| Gene Symbol | Fold Change | Probe ID | Description | Entrez ID | Ref |
| Electron Transport [21] | |||||
| Cyp3a11 | 3.6 | 516253 | Cytochrome P450, family 3, subfamily a, polypeptide 11 | 13112 | |
| Smox | 5.1 | 560410 | Spermine oxidase | 228608 | |
| Ugdh | 1.9 | 500013 | UDP-glucose dehydrogenase | 22235 | |
| Regulation of Transcription, DNA-Dependent [21] | |||||
| Bclaf1 | -1.9 | 549609 | BCL2-associated transcription factor 1 | 72567 | |
| Cdk9 | 2.1 | 392872 | Cyclin-dependent kinase 9 (CDC2-related kinase) | 107951 | |
| Creg1 | 1.9 | 760346 | Cellular repressor of E1A-stimulated genes 1 | 433375 | |
| Egr1 | -4.7 | 524988 | Early growth response 1 | 13653 | |
| Fbxl11 | -2.9 | 464056 | F-box and leucine-rich repeat protein 11 | 225876 | |
| Fli1 | 2.3 | 407869 | Friend leukemia integration 1 | 14247 | |
| Fliih | 4.6 | 706377 | Flightless I homologue (Drosophila) | 14248 | |
| Hlx1 | 2.1 | 915372 | H2.0-like homeo box 1 (Drosophila) | 15284 | |
| Mxd1 | 2.1 | 520449 | MAX dimerization protein 1 | 17119 | |
| Myst2 | 5.4 | 494053 | MYST histone acetyltransferase 2 | 217127 | |
| Pou2f2 | -4.4 | 911620 | POU domain, class 2, transcription factor 2 | 18987 | |
| Pparbp | 1.9 | 553770 | Peroxisome proliferator activated receptor binding protein | 19014 | |
| Pspc1 | 2.0 | 474771 | Paraspeckle protein 1 | 66645 | |
| Rab11a | 2.0 | 359489 | RAB11a, member RAS oncogene family | 53869 | |
| Rnf4 | 2.5 | 567180 | Ring finger protein 4 | 19822 | |
| Tsc22d3 | 2.0 | 700170 | TSC22 domain family 3 | 14605 | |
| Zfp482 | 2.0 | 435236 | Zinc finger protein 482 | 241322 | |
| Protein Biosynthesis [20,21] | |||||
| Eprs | 4.9 | 455664 | Glutamyl-prolyl-tRNA synthetase | 107508 | |
| Protein Folding [21] | |||||
| Clpx | 2.4 | 733670 | Caseinolytic peptidase X (E. coli) | 270166 | |
| Hspa4 | 3.5 | 578003 | Heat shock protein 4 | 15525 | |
| Ubiquitin Cycle [21] | |||||
| Cul7 | 0.4 | 742757 | Cullin 7 | 66515 | |
| Fbxo3 | 1.9 | 832607 | F-box only protein 3 | 57443 | |
| Ube2l6 | 2.0 | 401185 | Ubiquitin-conjugating enzyme E2L 6 | 56791 | [16] |
| Intracellular Protein Transport [21] | |||||
| Ap1s2 | 2.0 | 605927 | Adaptor-related protein complex 1, sigma 2 subunit | 108012 | |
| Arf3 | 4.4 | 652348 | ADP-ribosylation factor 3 | 11842 | |
| Sort1 | 2.4 | 339169 | Sortilin 1 | 20661 | |
| Response to Stress [21] | |||||
| Mapk14 | 2.2 | 755610 | Mitogen activated protein kinase 14 | 26416 | [16] |
| Prdx1 | 2.1 | 530413 | Peroxiredoxin 1 | 18477 | [17] |
| Prdx6 | -2.0 | 825043 | Peroxiredoxin 6 | 11758 | |
| Defense Response [20,21] | |||||
| Bst1 | 2.1 | 837914 | Bone marrow stromal cell antigen 1 | 12182 | |
| Klra18 | 2.5 | 806675 | Killer cell lectin-like receptor, subfamily A, member 18 | 93970 | |
| Tapbp | 2.0 | 928057 | TAP binding protein | 21356 | [20] |
| Inflammatory Response [20,21] | |||||
| Abcb1a | 2.6 | 677412 | ATP binding cassette, sub-family B (MDR/TAP), member 1A | 97570 | |
| Ca2 | 4.0 | 574832 | Carbonic anhydrase 2 | 88269 | |
| Card12 | 2.2 | 336709 | Caspase recruitment domain family, member 12 | 268973 | |
| Cdkn1b | 3.7 | 516253 | Cytochrome P450, family 3, subfamily a, polypeptide 11 | 104565 | |
| Clu | 4.0 | 379462 | Clusterin | 88423 | |
| Cr1l | 1.9 | 538208 | Complement component (3b/4b) receptor 1-like | 88513 | |
| Cyp3a11 | 3.7 | 516253 | Cytochrome P450, family 3, subfamily a, polypeptide 11 | 88609 | |
| Fyn | 2.50 | 766362 | Fyn proto-oncogene | 95602 | |
| H2-Q8 | 1.8 | 712519 | Histocompatibility 2, Q region locus 8 | 95937 | |
| Hnrnpa3 | 4.8 | 903894 | Heterogeneous nuclear ribonucleoprotein A3 | 1917171 | |
| Mrc1 | 2.9 | 331550 | Mannose receptor, C type 1 | 97142 | |
| Pole4 | 2.3 | 508321 | Polymerase (DNA-directed), ε 4 (p12 subunit) | 1914229 | |
| Ppp3r1 | 2.7 | 716541 | Protein phospatase 3, regulatory subunit B, α isoform (calcineurin B, type I) | 107172 | |
| Procr | 2.0 | 431405 | Protein C receptor, endothelial | 104596 | |
| Rrm1 | 5.6 | 865694 | Ribonucleotide reductase M1 | 98180 | |
| Serpinb2 | 4.0 | 860577 | Serine (or cysteine) proteinase inhibitor, clade B, member 2 | 97609 | |
| Leukocyte Extravasation and Signalling | |||||
| Arhgap12 | 2.2 | 465731 | ρ GTPase activating protein 12 | 1922665 | |
| Crkl | 3.0 | 389169 | V-crk sarcoma virus CT10 oncogene homologue (avian)-like | 104686 | |
| Ptk2b | 2.6 | 867483 | PTK2 protein tyrosine kinase 2 β | 104908 | |
| Immune Response [20,21] | |||||
| Cxcl11 | 5.1 | 921243 | Chemokine (C-X-C motif) ligand 11 | 56066 | |
| Ddx58 | 7.1 | 438990 | DEAD (Asp-Glu-Ala-Asp) box polypeptide 58 | 230073 | |
| Fcgrt | 2.0 | 390657 | Fc receptor, IgG, α chain transporter | 14132 | [16] |
| Gbp1 | 2.9 | 586296 | Guanylate nucleotide binding protein 1 | 14468 | [16,18,20] |
| Gbp3 | 3.0 | 405120 | Guanylate nucleotide binding protein 3 | 55932 | [17,20] |
| Ifit3 | 3.2 | 888038 | Interferon-induced protein with tetratricopeptide repeats 3 | 15959 | |
| Il1a | 5.1 | 595893 | Interleukin 1 α | 96542 | |
| Il1b | 2.4 | 734612 | Interleukin 1 β | 16176 | |
| Il15 | 1.9 | 876196 | Interleukin 15 | 16168 | |
| Cell Cycle [20] | |||||
| Ccnf | 2.4 | 767163 | Cyclin F | 12449 | |
| Cdkn1b | 3.7 | 704876 | Cyclin-dependent kinase inhibitor 1B (P27) | 12576 | |
| Pmp22 | 1.9 | 616997 | Peripheral myelin protein | 18858 | |
| Rhob | -2.2 | 925472 | Ras homologue gene family, member B | 11852 | |
| Cell Adhesion [21] | |||||
| Cldn11 | 4.9 | 338333 | Claudin 11 | 18417 | |
| Scarb2 | 2.5 | 561450 | Scavenger receptor class B, member 2 | 12492 | |
| Tnfaip6 | 1.9 | 614886 | Tumor necrosis factor alpha induced protein 6 | 21930 | [16] |
| Signal Transduction [20] | |||||
| Ccr4 | 2.2 | 618105 | Chemokine (C-C motif) receptor 4 | 12773 | [18] |
| Cd86 | 3.2 | 908805 | Cd86 antigen | 12524 | [20,22] |
| Gnas | 1.8 | 646267 | GNAS (guanine nucleotide binding protein, alpha stimulating) complex locus | 14683 | |
| Ms4a4c | 2.8 | 791872 495283 |
Membrane-spanning 4-domains, subfamily A, member 4C | 64380 | |
| Olfr472 | -2.2 | 591718 | Olfactory receptor 472 | 258770 | |
| Prkrir | 3.4 | 561755 | Protein-kinase, interferon-inducible double stranded RNA dependent inhibitor, repressor of (P58 repressor) | 72981 | |
| Ptger2 | 3.0 | 912597 | Prostaglandin E receptor 2 (subtype EP2) | 19217 | |
| Rin1 | -1.9 | 478326 | Ras and Rab interactor 1 | 225870 | |
| Ywhag | 4.1 | 606287 | 3-monooxygenase/tryptophan 5-monooxygenase activation protein, gamma polypeptide | 22628 | |
| G-Protein Coupled Receptor Protein Signaling Pathway [21] | |||||
| Olfr1303 | -2.0 | 366625 | Olfactory receptor 1303 | 258397 | |
| Olfr316 | -1.9 | 903210 | Olfactory receptor 316 | 258064 | |
| Olfr435 | -3.2 | 810459 | Olfactory receptor 435 | 258647 | |
| Slc19a2 | 1.9 | 763767 | Solute carrier family 19 (thiamine transporter), member 2 | 116914 | |
| Cell-Cell Signaling [21] | |||||
| Wnt6 | 2.0 | 590115 | Wingless-related MMTV integration site 6 | 22420 | |
| Development [21] | |||||
| Egfl4 | -2.2 | 914308 | EGF-like-domain, multiple 4 | 269878 | |
| Lrp6 | -2.3 | 691244 | Low density lipoprotein receptor-related protein 6 | 16974 | |
| Pgf | 2.9 | 932795 | Placental growth factor | 18654 | |
| Metabolism [20] | |||||
| Atp1a2 | 2.1 | 684165 | ATPase, Na+/K+ transporting, α 2 polypeptide | 98660 | |
| Atp2c1 | 2.0 | 388850 | ATPase, Ca2+ sequestering | 235574 | |
| Echdc3 | 2.2 | 331450 | Enoyl Coenzyme A hydratase domain containing 3 | 67856 | |
| Hsd17b4 | 2.2 | 303973 | Hydroxysteroid (17-beta) dehydrogenase 4 | 15488 | |
| Mmp9 | -12.3 | 710293 | Matrix metalloproteinase 9 | 17395 | |
| Oas3 | -3.0 | 487213 | 2'-5' oligoadenylate synthetase 3 | 246727 | [16] |
| Carbohydrate Transport [21] | |||||
| Slc35a4 | 2.5 | 318829 | Solute carrier family 35, member A4 | 67843 | |
| Protein Transport [21] | |||||
| Exoc2 | 3.0 | 498825 | Exocyst complex component 2 | 66482 | |
| Nupl2 | 2.1 | 868036 | Nucleoporin like 2 | 231042 | |
| Rab20 | 2.0 | 410549 | RAB20, member RAS oncogene family | 19332 | |
| Rap2b | 2.2 | 471908 | RAP2B, member of RAS oncogene family | 74012 | |
| Rheb | 1.9 | 653270 | RAS-homologue enriched in brain | 19744 | |
| Zfyve20 | 2.9 | 669220 | Zinc finger, FYVE domain containing 20 | 78287 | |
| Protein Ubiquitination [21] | |||||
| Trim12 | 2.7 | 454451 | Tripartite motif protein 12 | 76681 | |
| Trim34 | 2.9 | 600486 | Tripartite motif protein 34 | 94094 | |
| Differentiation [21] | |||||
| Ndrg2 | 2.1 | 468211 | N-myc downstream regulated gene 2 | 29811 | |
| Other | |||||
| Pik3ap1 | 2.0 | 646764 | Phosphoinositide-3-kinase adaptor protein 1 | 83490 | [16] |
a Transcripts altered ≥ 1.8-fold (p ≤ 0.025) in 15(S)-HETE-treated RAW 264.7 cells that are associated with specific genes or gene products correlated to malaria (referenced in column 6) or genes that are classified with specific over-expressed GO biological processes in malaria models (referenced with biological process heading), are shown in the table. Fold changes (FC) represent the average of three independent biological experiments. Bold FC indicate that multiple probes gave analogous results (average FC is shown).
Validation of microarray results
qRT-PCR was used to confirm several genes susceptible to differential regulation by 15-HETE. The analysis focused on selected genes implicated in the host response to malaria. The results shown in Figure 4 are expressed as fold change relative to LPS-stimulated cells. In agreement with the microarray results in terms of magnitude and direction of change, 15-HETE stimulated the expression of Arf3 (ADP-ribosylation factor 3), Cldn11 (claudin 11), Cxcl11 (chemokine (C-X-C motif) ligand 11), Mapk14 (mitogen-activated protein kinase 14), Prdx1 (peroxiredoxin 1), and Sdc1 (syndecan 1) and repressed the expression of Egr1 (early growth response 1).
Figure 4.
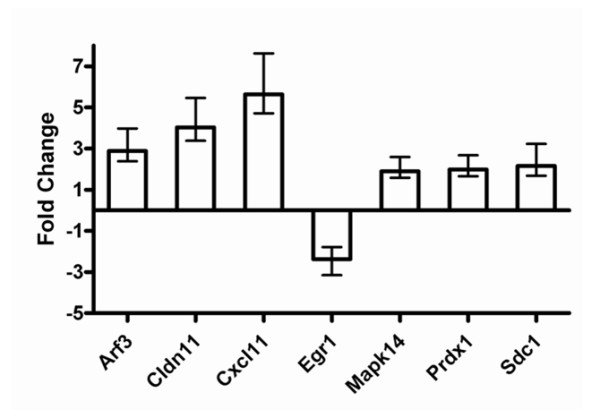
Quantitative real-time RT-PCR validation of microarray results. RAW 264.7 cells were stimulated with 0.1 μg/mL LPS and treated with 40 μM 15-HETE for 24 h prior to RNA extraction. Fold-changes (treated stimulated cells relative to stimulated cells) are shown ( ± 99% confidence interval for quadruplicate measurements of n = 3 biological replicates). Abbreviations: Arf3 (ADP-ribosylation factor 3), Cldn11 (claudin 11), Cxcl11 (chemokine (C-X-C motif) ligand 11), Egr1 (early growth response 1), Mapk14 (mitogen-activated protein kinase 14), Prdx1 (peroxiredoxin 1), and Sdc1 (syndecan 1).
Discussion
Global responses to malaria infection have been examined at the molecular level in the blood of human victims [16,21], malaria positive tissue [22], and both murine [17,18,20] and monkey [23] malaria models using microarray technology. Perturbations of gene expression associated with erythropoiesis, glycolysis, metabolism, B-cell activation, and inflammation were frequently identified in these analyses; however, the specific agents responsible for mediating expression changes remain unknown. Accumulating evidence supports the hypothesis that many of the adverse effects of malaria are not caused directly by the parasite, but by endogenous toxins generated during interactions with parasite-derived species such as Hz [24].
The immuno-modulatory response to native Hz has been recapitulated using individual components of Hz (i.e., membrane lipids from erythrocyte ghosts incubated with BH) in a model system [13]. Macrophage-like cells treated with the reaction supernatant exhibited a dose-dependent impairment of PMA-activated NADPH oxidase and LPS-stimulated iNOS activities. Neither BH- nor ghost-supernatant alone altered NADPH or iNOS activity, indicating that lipid peroxidation products generated during reactions between BH and ghost membranes were responsible for the inhibitory effects. Several laboratories have shown that biologically relevant levels of the individual lipid peroxidation products HNE and 15-HETE were capable of mimicking the dysfunctional response to Hz phagocytosis, suggesting the basis of Hz activity [13,25,26].
Considering these results, global responses to individual Hz constituents are of particular interest. The ability of specific and nonspecific malaria toxins to stimulate changes in gene expression has recently been examined in macrophage-like cells [12]. Microarray analyses of two individual Hz components (i.e., BH and HNE) indicated that while BH primarily elicited a phagocytic response, HNE significantly perturbed a myriad of biological processes. These results substantiated further exploration of a potential role for the Hz-associated lipid peroxidation product 15-HETE.
In the current study, activated RAW 264.7 macrophage-like cells were treated with 15-HETE, and mRNA levels were assessed at 24 h to mimic a steady-state response that would be relevant to an established malaria infection. IPA software was utilized to perform complementary network (Figure 2) and functional (Table 1) analyses for identification of biological relationships within the data. Figure 3 shows that the number of expression changes mediated by 15-HETE was modest relative to the previously reported global response to HNE [12]. Unlike the mode of action behind HNE's biological activity (forming adducts to cellular nucleophiles and subsequently modulating intracellular signaling), 15-HETE serves as a ligand for the nuclear PPARγ receptor [27]. As expected, downstream PPARγ signaling transcripts (e.g., Adfp, Ca2, Cyp3a4, M6pr, M6prbp1, Med1, Med7, and Sdc1) were elevated in response to 15-HETE.
Cytoadherence
A balance between removal of Plasmodium from circulation and sequestration inside host cells is crucial for parasite survival during infection. Sequestration is mediated by cytoadherence, specifically, the adherence of parasitized RBCs (PRBCs) and leukocytes to capillary and post-capillary venular endothelial cells (EC). This cytoadherence reduces blood flow and causes metabolic dysfunction [28] and is thought to be a major factor associated with cerebral malaria (CM). The mechanism(s) used for adhesion and migration involve the expression of constitutive ligands (i.e., adhesion molecules) and receptors on PRBCs or leukocytes and EC. Cell-cell and cell-matrix interactions are also mediated by the secretion of microbial products or cytokines, which enhance the expression of inducible adhesion molecules.
Investigation of potential arachidonic acid metabolite involvement in cytoadherence identified 15-HETE as an agent capable of stimulating basal adhesion of erythrocytes [15] and monocytes to EC [29,30]. In this study, 15-HETE induced the expression of several transcripts involved in integrin signaling (e.g., Crkl, Rap2b, Arf3). The expression of genes encoding Pkd2 and Sdc1, which are involved in cell-cell and cell-matrix interactions, and Ptpn14, which has alleged involvement in cell adhesion, were also induced by 15-HETE.
Leukocyte extravasation and chemotaxis
The inflammatory response to malaria, both acute and chronic, follows a predictable sequence of events. Initial vascular changes precede increases in permeability, which ultimately causes oedema. Enhanced cytoadherence results in the accumulation, adherence, and migration of leukocytes through vascular endothelium. Molecular mediators are subsequently released and contribute to both the immune response and recruitment/activation of effector cells. Overwhelming evidence demonstrates that the pathophysiology of malaria involves both systemic and local cytokine release. The recruitment of phagocytes around cerebral capillaries has been observed in CM and likely explains increased chemotaxis and chemokinesis [31]. CM is a severe complication of P. falciparum infection that is characterized by cytoadherence in cerebral microvasculature. Accumulation of Hz-loaded monocytes has been observed in brains of CM victims [32] and may contribute to the disruption of endothelial basement membrane and subsequent extravasation of blood cells [26]. Importantly, blood brain barrier (BBB) destruction and enhanced vascular permeability/oedema are major factors associated with CM [33,34].
A potential contribution of 15-HETE toward increased vascular permeability has been examined in the lung. Administration of this hydroxylated fatty acid was shown to increase respiratory oedema fluid production [35], suggesting a role as an inflammatory mediator. The current analysis identified the "Leukocyte Extravasation Signaling" pathway as being significantly (p = 0.015) affected by 15-HETE. Specifically, the steady-state expression of Arhgap12, Cldn11, Crkl, Mapk14, and Ptk2b was up-regulated. Although 15-HETE is generally considered to have anti-inflammatory properties, activation of a large group of genes encoding inflammatory response molecules was observed (Table 2).
15-HETE and MMP9 Regulation
15-HETE was recently shown to enhance IL1β expression and MMP9 activity in human monocytes [26]. The current study identified a different response to 15-HETE. While Il1b mRNA was elevated in 15-HETE treated LPS-stimulated RAW 264.7 cells, Mmp9 mRNA was down-regulated (-4.8-fold by qRT-PCR). Mmp9 expression can be regulated through a variety of signaling cascades including NF-κB, p38 MAPK, and ERK1/2 pathways [36]. It was proposed that enhanced regulation of IL1B and MMP9 by 15-HETE in human monocytes may be associated with NF-κB signaling [26] based on reports demonstrating NF-κB-mediated MMP9 expression in LPS-stimulated RAW 264.7 cells [36]. This mechanism seems unlikely given that 15-HETE has been shown to impair NF-κB-mediated expression of iNOS in LPS-stimulated RAW 264.7 cells [13]. Furthermore, PPARγ ligands have been shown to repress NF-κB signal transduction [37,38] and inhibit MMP9 expression, secretion, and activity in macrophages and vascular smooth muscle cells [39-41], in accord with the results of this study.
Conclusion
The complex innate and adaptive host immune responses to malaria are triggered by the presence of P. falciparum parasites, composite native Hz, Hz-derived lipid peroxidation products, and other cellular debris. A reductionist examination of the cellular response to two individual constituents of native Hz, BH and HNE [12], implicated a significant role for lipid peroxidation products in macrophage immuno-modulation. Consequently, the global response of macrophage-like cells to 15-HETE was explored. 15-HETE has previously been implicated as having a functional role in a variety of cellular processes such as inflammation, asthma, carcinogenesis, and atherosclerosis.15-HETE can be incorporated into membrane lipids and alter both vascular tone and EC permeability [14], supporting a potential role in malaria pathogenesis as well. In the current study, the response to 15-HETE was significantly associated with altered expression of "lipid metabolism" and "small molecule biochemistry" genes. Several genes related to "cytoadherence", "leukocyte extravasation", and "inflammatory response" were also differentially regulated by 15-HETE treatment. While these change uphold a potential role for 15-HETE in malaria pathogenesis, the small number of expression changes indicates that 15-HETE does not elicit a major response from macrophage-like cells in this model. These results add insight and detail to 15-HETE's effect on gene expression in macrophage-like cells, but there are limitations to any model system. For example, 15-HETE represents but one structural HETE isomer that is associated with Hz; 5-, 8-, 9-, 11-, and 12-HETE have also been identified [13,42]. 5- and 15-HETE are reported to be the predominant isomers formed during iron catalyzed or Hz-mediated oxidation of AA [42,43], yet 12-HETE may exert greater biological activity [13]. Current findings suggest that upon phagocytosis, the sum of all species adsorbed to the surface of Hz likely mediate a synergistic immuno-modulatory response. Future studies will address expression changes in primary human monocytes and macrophages in response to native Hz and Hz-associated lipid peroxidation products.
Authors' contributions
ACS performed all analyses. ACS and DWW designed the study, wrote and approved the final manuscript.
Acknowledgments
Acknowledgements
The Vanderbilt Microarray Shared Resource is supported by the Vanderbilt Ingram Cancer Center (P30 CA68485), the Vanderbilt Digestive Disease Center (P30 DK58404), and the Vanderbilt Vision Center (P30 EY08126). The VMC Flow Cytometry Shared Resource is supported by the Vanderbilt Ingram Cancer Center (P30 CA68485) and the Vanderbilt Digestive Disease Research Center (DK058404). We thank M. F. Richards for editorial assistance.
Contributor Information
Alexandra C Schrimpe, Email: a.schrimpe@vanderbilt.edu.
David W Wright, Email: David.Wright@vanderbilt.edu.
References
- Schmitt TH, Wilson A, Frezzatti J, Schreier S. Hemin-induced lipid membrane disorder and increased permeability: a molecular model for the mechanism of cell lysis. Arch Biochem Biophys. 1993;307:96–103. doi: 10.1006/abbi.1993.1566. [DOI] [PubMed] [Google Scholar]
- Gluzman IY, Francis SE, Oksman A, Smith CE, Duffin KL, Goldberg DE. Order and specificity of the Plasmodium falciparum hemoglobin degradation pathway. J Clin Invest. 1994;93:1602–1608. doi: 10.1172/JCI117140. [DOI] [PMC free article] [PubMed] [Google Scholar]
- Pagola S, Stephens PW, Bohle DS, Kosar AD, Madsen SK. The Structure of malaria pigment β-haematin. Nature. 2000;404:307–310. doi: 10.1038/35005132. [DOI] [PubMed] [Google Scholar]
- Goldie P, Roth EF, Jr, Oppenheim J, Vanderberg JP. Biochemical characterization of Plasmodium falciparum hemozoin. Am J Trop Med Hyg. 1990;43:584–596. doi: 10.4269/ajtmh.1990.43.584. [DOI] [PubMed] [Google Scholar]
- Schwarzer E, Kuhn H, Valente E, Arese P. Malaria-parasitized erythrocytes and hemozoin nonenzymatically generate large amounts of hydroxy fatty acids that inhibit monocyte functions. Blood. 2003;101:722–728. doi: 10.1182/blood-2002-03-0979. [DOI] [PubMed] [Google Scholar]
- Schwarzer E, Muller O, Arese P, Siems WG, Grune T. Increased levels of 4-hydroxynonenal in human monocytes fed with malarial pigment hemozoin. FEBS Lett. 1996;338:119–122. doi: 10.1016/0014-5793(96)00523-6. [DOI] [PubMed] [Google Scholar]
- Poli G, Schaur RJ, Siems WG, Leonarduzzi G. 4-Hydroxynonenal: a membrane lipid oxidation product of medicinal interest. Med Res Rev. 2008;28:569–631. doi: 10.1002/med.20117. [DOI] [PubMed] [Google Scholar]
- Schwarzer E, Turrini F, Ulliers D, Giribaldi G, Ginsburg H, Arese P. Impairment of Macrophage Functions after Ingestion of Plasmodium falciparum-infected Erythrocytes or Isolated Malarial Pigment. J Exp Med. 1992;176:1033–1041. doi: 10.1084/jem.176.4.1033. [DOI] [PMC free article] [PubMed] [Google Scholar]
- Schwarzer E, Arese P. Phagocytosis of malarial pigment hemozoin inhibits NADPH-oxidase activity in human monocyte-derived macrophages. Biochim Biophys Acta. 1996;1316:169–175. doi: 10.1016/0925-4439(96)00021-x. [DOI] [PubMed] [Google Scholar]
- Fiori PL, Rappelli P, Mirkarimi SN, Ginsburg H, Cappuccinelli P, Turrini F. Reduced microbicidal and anti-tumour activities of human monocytes after ingestion of Plasmodium falciparum-infected red blood cells. Parasite Immunol. 1993;15:647–655. doi: 10.1111/j.1365-3024.1993.tb00579.x. [DOI] [PubMed] [Google Scholar]
- Nguyen PH, Day N, Pram TD, Ferguson DJ, White NJ. Intraleucocytic malaria pigment and prognosis in severe malaria. Trans R Soc Trop Med Hyg. 1995;89:200–204. doi: 10.1016/0035-9203(95)90496-4. [DOI] [PubMed] [Google Scholar]
- Schrimpe AC, Wright DW. Comparative analysis of gene expression changes mediated by individual constituents of hemozoin. Chem Res Toxicol. 2009;22:433–445. doi: 10.1021/tx8002752. [DOI] [PMC free article] [PubMed] [Google Scholar]
- Carney CK, Schrimpe AC, Halfpenny K, Harry RS, Miller CM, Broncel M, Sewell SL, Schaff JE, Deol R, Carter MD, Wright DW. The basis of the immunomodulatory activity of malaria pigment (hemozoin) The Journal of Biological Inorganic Chemistry. 2006;11:917–929. doi: 10.1007/s00775-006-0147-0. [DOI] [PubMed] [Google Scholar]
- Spector AA, Gordon JA, Moore SA. Hydroxyeicosatetraenoic acids (HETEs) Prog Lipid Res. 1988;27:271–323. doi: 10.1016/0163-7827(88)90009-4. [DOI] [PubMed] [Google Scholar]
- Setty BNY, Dampier CD, Stuart MJ. Arachidonic acid metabolites are involved in mediating red blood cell adherence to endothelium. J Lab Clin Med. 1995;125:608–617. [PubMed] [Google Scholar]
- Griffiths MJ, Mohammed JS, Popper SJ, Hemingway CA, Kortok MM, Wathen A, Rockett KA, Mott R, Levin M, Newton CR, Marsh K, Relman DA, Kwiatkowski DP. Genomewide Analysis of the Host Response to Malaria in Kenyan Children. The Journal of Infectious Diseases. 2005;191:1599–1611. doi: 10.1086/429297. [DOI] [PubMed] [Google Scholar]
- Sexton AC, Good RT, Hansen DS, D'Ombrain MC, Buckingham L, Simpson K, Schofield L. Transcriptional Profiling Reveals Suppressed Erythropoiesis, Up-Regulated Glycolysis, and Interferon-Associated Responses in Murine Malaria. The Journal of Infectious Diseases. 2004;189:1245–1256. doi: 10.1086/382596. [DOI] [PubMed] [Google Scholar]
- Lovegrove FE, Pena-Castillo L, Mohammad N, Liles C, Hughes TR, Kain KC. Simultaneous host and parasite expression profiling identifies tissue-specific transcriptional programs associated with susceptibility or resistance to experimental cerebral malaria. BMC Genomics. 2006;7:295–311. doi: 10.1186/1471-2164-7-295. [DOI] [PMC free article] [PubMed] [Google Scholar]
- Sherry BA, Alava G, Tracey KJ, Martiney J, Cerami A, Slater AFG. Malaria-specific metabolite hemozoin mediates the release of several potent endogenous pyrogens (TNF, MIP-1α, and MIP-1β) in vitro, and altered thermoregulation in vivo. Journal of Inflammation. 1995;45:85–96. [PubMed] [Google Scholar]
- Schaecher K, Kumar S, Yadava A, Vahey M, Ockenhouse CF. Genome-Wide Expression Profiling in Malaria Infection Revelas Transcriptional Changes Associated with Lethal and Nonlethal Outcomes. Infection and Immunity. 2005;73:6091–6100. doi: 10.1128/IAI.73.9.6091-6100.2005. [DOI] [PMC free article] [PubMed] [Google Scholar]
- Ockenhouse CF, Hu W-c, Kester KE, Cummings JF, Stewart A, Heppner DG, Jedlicka AE, Scott AL, Wolfe ND, Vahey M, Burke DS. Common and Divergent Immune Response Signaling Pathways Discovered in Peripheral Blood Mononuclear Cell Gene Expression Patterns in Presymptomatic and Clinically Apparent Malaria. Infection and Immunity. 2006;74:5561–5573. doi: 10.1128/IAI.00408-06. [DOI] [PMC free article] [PubMed] [Google Scholar]
- Muehlenbachs A, Fried M, Lachowitzer J, Mutabingwa TK, Duffy PE. Genome-Wide Expression Analysis of Placental Malaria Reveals Features of Lymphoid Neogenesis during Chronic Infection. The Journal of Immunology. 2007;179:557–565. doi: 10.4049/jimmunol.179.1.557. [DOI] [PubMed] [Google Scholar]
- Ylostalo J, Randall AC, Myers TA, Metzger M, Krogstad DJ, Cogswell FB. Transcriptome Profiles of Host Gene Expression in a Monkey Model of Human Malaria. The Journal of Infectious Diseases. 2005;191:400–409. doi: 10.1086/426868. [DOI] [PubMed] [Google Scholar]
- Boutlis CS, Yeo TW, Anstey NM. Malaria tolerance – For whom the cell tolls? Trends Parasitol. 2006;22:371–377. doi: 10.1016/j.pt.2006.06.002. [DOI] [PMC free article] [PubMed] [Google Scholar]
- Schwarzer E, Skorokhod OA, Barrera V, Arese P. Hemozoin and the human monocyte – a brief review of their interactions. Parassitologia. 2008;50:143–145. [PubMed] [Google Scholar]
- Prato M, Giribaldi G, Polimeni M, Gallo V, Arese P. Phagocytosis of hemozoin enhances matrix metalloproteinase-9 activity and TNF-α production in human monocytes: role of matrix metalloproteinases in the pathogenesis of Falciparum malaria. The Journal of Immunology. 2005;175:6436–6442. doi: 10.4049/jimmunol.175.10.6436. [DOI] [PubMed] [Google Scholar]
- Skorokhod OA, Alessio M, Mordmuller B, Arese P, Schwarzer E. Hemozoin (malarial pigment) inhibits differentiation and maturation of human monocyte-derived dendritic cells: a peroxisome proliferator-activated receptor-γ-mediated effect. The Journal of Immunology. 2004;173:4066–4074. doi: 10.4049/jimmunol.173.6.4066. [DOI] [PubMed] [Google Scholar]
- Hage T, Sebald W, Reinemer P. Crystal structure of the interleukin-4/receptor α chain complex revelas a mosaic binding interface. Cell. 1999;97:271–281. doi: 10.1016/S0092-8674(00)80736-9. [DOI] [PubMed] [Google Scholar]
- Bolick DT, Orr AW, Whetzel A, Srinivasan S, Hatley ME, Schwartz MA, Hedrick CC. 12/15-Lipoxygenase regulates intercellular adhesion molecule-1 expression and monocyte adhesion to endothelium through activation of RhoA and Nuclear Factor-kappaB. Arterioscler Thromb Vasc Biol. 2005;25:2301–2307. doi: 10.1161/01.ATV.0000186181.19909.a6. [DOI] [PubMed] [Google Scholar]
- Patricia MK, Kim JA, Harper CM, Shih PT, Berliner JA, Natarajan R, Nadler JL, Hedrick CC. Lipoxygenase products increase monocyte adhesion to human aortic endothelial cells. Arterioscler Thromb Vasc Biol. 1999;19:2615–2622. doi: 10.1161/01.atv.19.11.2615. [DOI] [PubMed] [Google Scholar]
- Howard RJ, Gilladoga AD. Molecular studies related to the pathogenesis of cerebral malaria. Blood. 1989;74:2603–2618. [PubMed] [Google Scholar]
- Silamut K, Phu NH, Whitty C, Turner GDH, Louwrier K, Mai NTH, Simpson JA, Hien TT, White NJ. A quantitative analysis of the microvascular sequestration of malaria parasites in the human brain. Am J Pathol. 1999;155:395–410. doi: 10.1016/S0002-9440(10)65136-X. [DOI] [PMC free article] [PubMed] [Google Scholar]
- Patnaik JK, Das BS, Mishra SK, Mohanty S, Satpathy SK, Mohanty D. Vascular clogging, mononuclear cell margination, and enhanced vascular permeability in the pathogenesis of human cerebral malaria. Am J Trop Med Hyg. 1994;51:642–647. [PubMed] [Google Scholar]
- Adams S, Brown H, Turner G. Breaking down the blood-brain barrier: Signaling a path to cerebral malaria? Trends Parasitol. 2002;18:360–366. doi: 10.1016/S1471-4922(02)02353-X. [DOI] [PubMed] [Google Scholar]
- Johnson H, McNee M, Sun F. 15-Hydroxyeicosatetraenoic acid is a potent inflammatory mediator and agonist of canine tracheal mucus secretion. Am Rev Respir Dis. 1985;131:917–922. doi: 10.1164/arrd.1985.131.6.917. [DOI] [PubMed] [Google Scholar]
- Rhee JW, Lee KW, Kim D, Lee Y, Jeon OH, Kwon HJ, Kim DS. NF-kappaB-dependent regulation of matrix metalloproteinase-9 gene expression by lipopolysaccharide in a macrophage cell line RAW 264.7. J Biochem Mol Biol. 2007;40:88–94. doi: 10.5483/bmbrep.2007.40.1.088. [DOI] [PubMed] [Google Scholar]
- Zambon A, Gervois P, Pauletto P, Fruchart J-C, Staels B. Modulation of hepatic inflammatory risk markers of cardiovascular diseases by PPAR-alpha activators: clinical and experimental evidence. Arterioscler Thromb Vasc Biol. 2006;26:977–986. doi: 10.1161/01.ATV.0000204327.96431.9a. [DOI] [PubMed] [Google Scholar]
- Jiang C, Ting AT, Seed B. PPAR-γ agonists inhibit production of monocyte inflammatory cytokines. Nature. 1998;391:82–86. doi: 10.1038/35154. [DOI] [PubMed] [Google Scholar]
- Ricote M, Li AC, Willson TM, Kelly CJ, Glass CK. The peroxisome proliferator-activated receptor-γ is a negative regulator of macrophage activation. Nature. 1998;391:79–82. doi: 10.1038/34178. [DOI] [PubMed] [Google Scholar]
- Marx N, Schonbeck U, Lazar MA, Libby P, Plutzky J. Peroxisome proliferator-activated receptor gamma activators inhibit gene expression and migration in human vascular smooth muscle cells. Circ Res. 1998;83:1097–1103. doi: 10.1161/01.res.83.11.1097. [DOI] [PMC free article] [PubMed] [Google Scholar]
- Marx N, Sukhova G, Murphy C, Libby P, Plutzky J. Macrophages in human atheroma contain PPARgamma: differentiation-dependent peroxisomal proliferator-activated receptor gamma (PPARgamma) expression and reduction of MMP-9 activity through PPARgamma activation in mononuclear phagocytes in vitro. Am J Pathol. 1998;153:17–23. doi: 10.1016/s0002-9440(10)65540-x. [DOI] [PMC free article] [PubMed] [Google Scholar]
- Green MD, Xiao L, Lal AA. Formation of hydroxyeicosatetraenoic acids from hemozoin-catalyzed oxidation of arachidonic acid. Mol Biochem Parasitol. 1996;83:183–188. doi: 10.1016/S0166-6851(96)02769-7. [DOI] [PubMed] [Google Scholar]
- Fridovich SE, Porter NA. Oxidation of arachidonic acid in micelles by superoxide and hydrogen peroxide. J Biol Chem. 1981;256:260–265. [PubMed] [Google Scholar]