

Abstract
Background
Maternal genotype has lifetime effects on progeny, but few specific genes, and no proteases, are known to underlie maternal effects. Prolyl endopeptidase (PREP) is a serine protease with putative substrates that regulate appetite or milk production.
Objective
To test effects of PREP on obesity phenotypes in mice.
Design
Mice with a gene-trap of PREP (PREPgt/gt) on the C57BL/6J (B6) background were generated. Minimal PREP protein was detected by Western blot. In experiment 1, direct effects of PREP were measured in littermate mice derived from intercrosses of heterozygotes (PREPWT/gt). In experiment 2, maternal effects of PREP were measured in reciprocal crosses of heterozygous (PREPWT/gt) and wild-type (PREPWT/WT) males and females.
Diets
Mice were fed either low-fat (LF, Experiments 1 and 2) or high-fat (HF, Experiment 1) defined diets.
Measurements
Adiposity index (AI) was calculated from body weight and weights of four fat depots measured in 120 day old mice. Fasting plasma glucose, insulin and leptin were measured. In vivo plasma α-MSH levels were measured by targeted quantitative peptidomics.
Results
Experiment 1. In intercross mice there were significant diet effects, but few genotype effects. Body weight and AI in females on the LF diet were marginally affected by pup genotype. There were no genotype effects in males on either diet or in females on the HF diet.
Experiment 2. In contrast, reciprocal crosses of heterozygous males or females with wild-type B6 revealed highly significant parent of origin effects on all traits except body length. Progeny (wild-type and heterozygous genotypes and both sexes) born to female PREPWT/gt heterozygotes had fat pads that weighed as much as 2-fold more at 120 days old than progeny born to male heterozygotes.
Conclusion
Heterozygosity for PREP gene-trap results in highly significant maternal effects whereas homozygosity for the PREPgt/gt mutation has a much more limited direct effect.
Keywords: maternal genotype, obesity, mouse
Introduction
Many studies show that maternal diet influences obesity of progeny in mouse models (1, 2) and humans (3). However, maternal influences on obesity are not restricted to diet: they also include maternal genetic effects. Maternal genetic effects occur when maternal genotype influences phenotypes in progeny independent of progeny genotype. Recently, several quantitative trait loci for maternal genetic effects on the obesity of pups were identified (4). These studies utilized F2 and F3 populations of Large × Small (LG × SM) mice where all mice were genotyped, haplotyped, phenotyped and the F3 progeny were cross fostered to other F2 nurse mothers. The results demonstrated that maternal effects are located on several chromosomes. Maternal genetic effects were also identified in studies of congenic strains of mice (5).
Prolyl endopeptidase (PREP, post-proline cleaving enzyme, also prolyl oligopeptidase (POP)) was first isolated from human uterus as an oxytocin-degrading enzyme (6). Putative substrates for PREP include: Substance P, TRH, GnRH, Arginine-vasopressin, Angiotensins I – IV, Bradykinin, Oxytocin, ß-Endorphin, Neurotensin, α-MSH, ß-Casomorphin, LVV-hemorphin, Urotensin and Octadecaneuropeptide (7). Quantitative PCR and in situ hybridization reveal high levels of PREP mRNA in cerebellum, hypothalamus, pituitary and several other brain nuclei (8). Enzymatic studies identified PREP activity in plasma. PREP mRNA and protein are also located in testis, thymus and lung (7). PREP activity in uterus and ovary varies strongly with estrous cycle (9).
Serum PREP levels are correlated with depression, mania and anorexia (10, 11). PREP expression is also correlated to Alzheimer's disease and neurodegeneration, implicating PREP activity in memory (12). No previous studies suggest that PREP influences obesity or report phenotypes of PREP deficient mice.
We examined the effects of minimal expression of PREP on obesity phenotypes in mice. Analysis of intercross mice derived from heterozygous parents reveals that PREP has few direct genotype effects, primarily body weight and adiposity index in females fed a low-fat diet. In contrast, heterozygosity for PREP gene-trap (PREPWT/gt) in female mice bred to wildtype (PREPWT/WT) male mice leads to increased body weight and fat mass in all progeny, regardless of progeny genotype, when compared to progeny produced from female PREPWT/WT bred to male PREPWT/gt heterozygotes.
Methods
Generation of PREP gene-trap (PREPgt/gt) mice
PREP is located on mouse chromosome 10 at 44 MB on the Ensembl version 49 mouse assembly. It has 15 exons, all of which are predicted to include protein coding sequence. BayGenomics clone RRM213 (NHLBI – Bay Area Functional Genomics Consortium, http://baygenomics.ucsf.edu) was identified as having an insertion in the second intron of the PREP gene in a 129 strain ES cell. Since protein coding begins in the first exon the resulting protein in the gene-trap mice would include the first 40 amino acids of this 710 residue protein before the inserted beta-galactosidase. Founder chimeric mice were bred to B6. Progeny were genotyped for beta-galactosidase. Mice positive for beta-galactosidase were maintained by backcrossing to B6. Presence of the 129 strain congenic DNA surrounding the PREP gene was confirmed at every generation by genotyping three microsatellite markers polymorphic between 129 and B6. The markers bracket the PREP gene: two proximal (D10Mit148 and D10Mit55), and one distal (D10Mit36).
PREPgt/gt mice are born in expected Mendelian numbers in litters of average size for the B6 background. The homozygotes do not exhibit increased mortality or disease up to 120 days of age. We have not retained older mice.
Animal maintenance and diet
B6 mice were initially purchased from The Jackson Laboratory (The Jackson Laboratory, Bar Harbor, ME, USA) and maintained for over 10 years in a breeding colony at UC Davis.
All animals were kept in the same room with a 14h light/10h dark cycle, 21 ± 2 (SD) °C temperature and greater than 25% humidity. Breeding and nursing mice were in shoe-box cages with deionized water and breeding chow available ad libitum. Pups were weaned at 3 weeks of age, separated by gender and housed 3−5 mice in suspended wire cages with either a low-fat diet (AIN-76A, LF) or a high-fat (HF) diet and deionized water available ad libitum. AIN-76A (Research Diets, Inc., New Brunswick, NJ) is a widely used purified control diet that contains 20.8 kcal% protein (20.5 kcal% casein), 67.7 kcal% carbohydrate (51.3 kcal% sucrose), and 11.5 kcal% fat as corn oil. The HF diet (D12492, Research Diets, Inc., New Brunswick, NJ) is a purified diet used in the study of obesity and diabetes. This diet contains 20% kcal% protein (19.7 kcal% casein), 20 kcal % carbohydrate (6.8 kcal% sucrose), and 60% of calories from fat, predominantly lard with some soy oil.
Genetic crosses
In experiment 1, heterozygous breeders from the cross of PREPgt/gt and PREPWT/WT mice were inter-bred to produce pups that were heterozygous PREPWT/gt (H), gene-trap PREPgt/gt (GT), or wild-type PREPWT/WT (WT) for PREP for testing of direct effects of PREP on obesity phenotypes. In experiment 2, a reciprocal cross of H (m,f) × WT (m,f) was used to test maternal effects of PREPWT/gt on obesity phenotypes.
Food intake
For food intake measurements, a minimum of 5 mice per genotype were singly housed in wire-bottom cages with either LF or HF diet at ten weeks of age and acclimated for 4 days before the start of the measurement period. Food intake was measured at the end of 4 days and averaged to determine daily intake.
Body composition and plasma phenotypes
At 120 ± 3 (SD) days of age, mice were fasted for ∼ 15 hours before collection of blood through the retroorbital sinus within 90 seconds of initiating ether anesthesia at ∼ 3 hours into the light phase of the diurnal cycle (1000 h). Blood samples were collected in iced EDTA and plasma kept at −70°C until analyzed. Anal to nasal (AN) length was measured, and mice were killed by cervical dislocation. Four white adipose depots, femoral (FWAT), gonadal (GWAT), retroperitoneal (RWAT), and mesenteric (MWAT), were dissected by the same individual to minimize variation in technique and weighed as previously described (13). The weights of the 4 adipose depots were used to calculate adiposity index (AI) (total adipose depot weight ÷ live body weight × 100). AI is strongly correlated with percent body fat (14) and is used as a surrogate for body fat percentage.
Plasma samples were analyzed in duplicate for glucose by the glucose oxidase method (Thermo Electron, Victoria, Australia, Cat. # TR15104), insulin by mouse ultrasensitive EIA (ALPCO Diagnostics, Salem, NH, Cat. # 80-INSMSU-E01), and leptin by a mouse leptin ELISA kit (Millipore, St. Charles, MO, Cat. # EZML-82K). An index of insulin resistance was calculated from fasting plasma glucose and insulin using the Homeostatic Model Assessment (HOMA) of insulin resistance (HOMA-IR) that was developed for humans (15) but is now used extensively in rodent models (16-18). The HOMA-IR was calculated using the formula: fasting plasma insulin (ng/ml) × fasting plasma glucose (mmol/l) ÷ (22.5 × 0.0417) (18).
α-MSH plasma level
Plasma samples were suspended in an equal of volume of 0.1% TFA in water. Samples were then centrifuged at 17,000 × g for 15 min at 4°C. The supernatants were run through Strata C18-E, 55 μM, 70A (cat# 8B-S001-FBJ, Phenomenex) Sep-Paks according to the manufacturers instructions. Samples were frozen and lyophilized. Sample extracts were then solubilized with 50 μl 2% acetonitrile, 0.1% formic acid and sonicated in an ultra sonic bath for 10 minutes. 10 μl of samples were analyzed by mass spectrometry using a Thermo TSQ Vantage with a Michrom multidimensional liquid chromatography system and a CTC Pal Autosampler. The column used is a Magic C18 (200 μm × 150 mm) set at a flow rate of 2 μl per min. Separation of peptides was achieved by using a 90 min step gradient with a mobile phase of varying concentration of acetonitrile (5% to 90%). Scan width was set at 0.002 and Q1 and Q3 peak widths at 0.7. Peak areas for respectively 5 and 8 MRM transitions of the prevalent +3 charge state, for both target peptides, α-MSH and γ-MSH, were then calculated using the software Xcalibur version 2.0.7.
Effect of dam body weight on progeny
Dam body weights, litter sizes and average pup weights were compared by parity and genotype in dams fed breeder chow.
Western blots
Protein was extracted from a variety of tissue samples. Approximately 50mg tissue was homogenized in 1ml Rigor buffer (50mM KCl, 50mM Tris, 5mM EGTA, 2mM NaN3, pH 7.5) supplemented with protease inhibitor cocktail (Roche Cat# 1 697 498 001) on ice. The samples were centrifuged at 4°C for ten minutes at 14,000g. The supernatant was retained and used for Western Blot analysis. 10 μg of Protein was run on NuPAGE 4−12%Bis-Tris Gel and transferred to GE Nitrocellulose membrane. We performed Ponceau S staining on unblocked membrane and blocked with 5% milk overnight in a cold room. The membrane was blocked with Primary Antibody (Abcam ab58988) for 30 minutes, washed three times with TBST for ten minutes, then blocked with secondary antibody (Abcam ab6721) for thirty minutes, and finally washed another four times for ten minutes with TBST.
Statistical analyses
Data are presented as means ± SE. A general linear model was used to assess effects of pup genotype and diet or maternal genotype and pup gender on body composition using JMP (SAS Institute, Cary, NC). Post hoc comparisons were by Tukey's HSD. A Bonferroni correction for multiple tests in this study indicates that an ANOVA P value of 0.001 is statistically significant.
Statement of ethics
We certify that all applicable institutional and governmental regulations concerning the ethical use of animals were followed during this research. All animals were housed and cared for under conditions meeting National Institutes of Health standards as stated in the Guide for Care and Use of Laboratory Animals and American Association for Accreditation of Laboratory Animal Care accreditation standards. All animal use was conducted according to Institutional Animal Care and Use Committee-approved protocols.
Results
Confirmation of gene-trap
Surveys of mRNA abundance, both BioGPS (https://biogps.gnf.org/), and MPSS GEO (http://www.ncbi.nlm.nih.gov/geo/info/mouse-trans.html) (19), reveal that PREP is expressed in several tissues. Deficiency of PREP protein in gene-trap mice was confirmed by performing a Western blot of brain and kidney proteins from PREPWT/WT, PREPWT/gt and PREPgt/gt mice fed either the LF or HF diet as shown in Figure 1A and lung from mice fed only the LF diet in Figure 1B. Additional Western blots comparing brain, muscle, ovary, uterus, lung and heart in PREPWT/WT and PREPgt/gt mice fed only the LF diet are in Figure 1C. PREP was identified by including recombinant PREP on the Western blot. The sample genotypes were verified by PCR. The antibody to PREP was made to a synthetic peptide based on the amino terminal end of human Prolyl Endopeptidase. PREP protein was present in PREPWT/WT mice, reduced in PREPWT/gt , and almost absent in PREPgt/gt mice (Figure 1). There was no detectable effect of diet on the amount of PREP protein in kidney and brain. The amount of PREP in PREPgt/gt homozygotes varied from undetectable in gastrocnemius muscle to easily visible in brain. Detectable PREP protein in PREPgt/gt mice results from alternative splicing to remove the ß-gal containing “gene-trap” exon. Our data demonstrate that efficiency of alternative splicing of PREP varies between tissues, but in all tissues PREPgt/gt exhibit reduced protein.
Figure 1.

Western blot of PREP protein in tissues of PREPWT/WT, PREPWT/gt and PREPgt/gt mice fed either low-fat or high-fat diets as well as recombinant PREP protein. See text for methods. The minimal PREP protein in PREPgt/gt mice indicates that this mutation is a PREP hypomorph rather than a complete deletion.
Direct effects of PREPgt/gt on obesity phenotypes (Experiment 1)
Intercrosses of heterozygous (PREPgt/gt x PREPWT/WT) parents were used to determine direct genotype effects. An intercross colony was maintained by breeding of heterozygous parents. Obesity phenotypes of PREPWT/WT, PREPWT/gt and PREPgt/gt littermates maintained on either LF or HF diet were compared. Few genotype effects of PREP gene-trap were observed in F2 animals. Figure 2 presents body weight (BW) and adiposity index (AI) of female and male littermates of different genotypes and diets from the intercross. Genders were analyzed separately. Both genders show a strong diet effect (p<0.0001) for both BW and AI (Figure 2). In female mice, genotype effects for both BW and AI were not statistically significant, although when analyzed individually, BW was lower in PREPgt/gt than in PREPWT/WT mice, whereas adiposity index was lower in PREPWT/gt than in PREPWT/WT mice. There was a significant genotype effect on body weight for male mice (p=0.0003) with PREPWT/gt mice on the HF diet being heavier than PREPgt/gt. However, there were no genotype effects on BW or AI in males fed the LF diet (Figure 2). We also observed recessive genotype effects on kidney weight in females fed the LF diet (p=0.002) and BMI in males fed the HF diet (p<0.0001), since PREPWT/WT and PREPWT/gt are statistically indistinguishable whereas PREPgt/gt are significantly smaller (data not shown).
Figure 2.

Intercross mice (Experiment 1). Body weights and adiposity index (AI) of female and male PREP wild-type (PREPWT/WT, WT), heterozygote (PREPWT/gt, H), and gene-trap (PREPgt/gt, GT) mice fed low-fat AIN-76A (LF) or high-fat (HF) diets and killed at 120 days of age. AI was calculated as (total adipose depot weight ÷ live body weight × 100). Data are presented as means ± SE. P values were calculated by ANOVA: Bonferroni correction for multiple tests sets significant P value at ≤ 0.001. Post hoc comparisons were by Tukey's HSD: means not sharing a letter are significant at P = 0.05. Genders were analyzed separately. 2-Way ANOVA. Females: body weight effect of diet, p<0.0001, effect of genotype, NS; AI effect of diet p<0.0001, effect of genotype, NS. Males: body weight effect of diet, p<0.0001, effect of genotype, p=0.0003; AI effect of diet, p<0.0001, effect of genotype, NS.
Data on fasting plasma insulin, leptin, glucose and calculated HOMA-IR are presented in Table 1. In females, leptin was significantly higher in mice fed the HF diet: no other diet or genotype effects were observed. In males, insulin, leptin, glucose and HOMA-IR are all higher in mice HF diet fed groups: no genotype effects were observed. In females (N=30), leptin was strongly correlated with AI (0.84) and to a lesser extent with insulin (0.58) and HOMA-IR (0.57), and insulin was strongly correlated with glucose (0.76) and HOMA-IR (0.95). In males (N=36), leptin was strongly correlated with AI (0.75) and to a lesser extent with insulin (0.68) and HOMA-IR (0.69), and insulin was strongly correlated with glucose (0.69) and HOMA-IR (0.96). There were no significant effects on total cholesterol (data not shown).
Table 1.
Fasting plasma insulin, leptin, glucose and calculated HOMA-IR of mice from the intercross (Experiment 1). Data are means ± SE.
| Diet | Low-Fat | High-Fat | 2-Way ANOVA1 | ||||||
|---|---|---|---|---|---|---|---|---|---|
| Genotype | PREPWT/WT 2 | PREPWT/gt | PREPgt/gt | PREPWT/WT | PREPWT/gt | PREPgt/gt | Diet | Genotype | Interaction |
| Females | |||||||||
| Insulin ng/ml | 0.14 ± 0.03 | 0.21 ± 0.03 | 0.15 ± 0.03 | 0.22 ± 0.04 | 0.46 ±0.11 | 0.19 ± 0.02 | NS | NS | NS |
| Leptin ng/ml | 10.2 ± 2.4 c | 8.4 ± 3.2 c | 3.7 ± 1.0 c | 22.9 ± 14.1 bc | 54.3 ± 8.7 a | 40.4 ± 9.6 ab | <0.0001 | NS | NS |
| Glucose mmol/l | 5.5 ± 0.8 | 5.2 ± 0.3 | 5.7 ± 0.9 | 6.0 ± 0.8 | 9.5 ± 1.1 | 6.6 ± 0.3 | NS | NS | NS |
| HOMA-IR | 9.5 ± 2.9 | 10.9 ± 1.1 | 10.3 ± 3.8 | 14.7 ± 3.5 | 50.6 ± 18.1 | 13.2 ± 1.4 | NS | NS | NS |
| Males | |||||||||
| Insulin ng/ml | 0.13 ± 0.04 b | 0.19 ± 0.05 b | 0.18 ± 0.03 b | 0.78 ± 0.29 a | 0.31 ± 0.07 b | 0.30 ± 0.06 b | <0.0001 | NS | NS |
| Leptin ng/ml | 3.9 ± 1.1 c | 6.7 ± 3.0 c | 7.9 ± 3.6 c | 34.2 ± 4.1 a | 25.3 ± 5.4 ab | 13.0 ± 4.8 bc | <0.0001 | NS | NS |
| Glucose mmol/l | 4.8 ± 0.4 c | 5.3 ± 0.4 bc | 5.6 ± 0.7 bc | 10.9 ± 1.7 a | 8.6 ± 0.5 ab | 7.0 ± 2.0 abc | <0.0001 | NS | NS |
| HOMA-IR | 6.4 ± 1.9 b | 10.9 ± 3.3 b | 11.0 ± 2.4 b | 101 ± 44 a | 29.0 ± 6.5 b | 24.7 ± 9.5 b | <0.0001 | NS | 0.0004 |
P values were calculated by ANOVA: Bonferroni correction for multiple tests sets significant P value at ≤ 0.001. Post hoc comparisons were by Tukey's HSD: means not sharing a letter are significant at P = 0.05.
Group sizes: Females eating low-fat diet N=6 each group; eating high-fat diet N=4 each group. Males eating low-fat diet N=8 each group. Males eating high-fat diet PREPWT/WT, N=3; PREPWT/gt, N=5; PREPgt/gt, N=4.
Using targeted quantitative proteomics, we measured the active, N-acetylated and C-amidated α-MSH from the plasma of PREPgt/gt mice and wild-type littermates. First, using MSMS on α-MSH standard, we identified 5 Multiple Reaction Monitoring (MRM) transitions that we could then monitor in plasma samples. Because of the variability encountered across the biological samples, we also monitored γ-MSH, another prohormone, proopiomelanocortin (POMC) derived peptide. γ-MSH also results from the digestion of a POMC derived peptide by proprotein convertase subtilisin/kexin type 2 (Pcsk2) but it lacks a proline and thus is not a putative PREP substrate. We identified 8 MRM transitions using γ-MSH standard and then quantitated γ-MSH in multiplex, i.e. in the same MS run as α-MSH. We observed a close correlation between the two hormones for each genotype: R2=0.93 and R2=0.90 respectively for the PREPgt/gt and WT genotypes (Figure 3). When normalizing α-MSH with γ-MSH levels, we detected a statistically significant decrease (1.5 fold) of α-MSH in the plasma of PREPgt/gt mice with a one tailed Student t-test p-value = 0.0016 (Figure 4).
Figure 3.

Quantitative targeted peptidomics of α-MSH and γ-MSH. Peak areas of the MRM transitions are combined and plotted on a log scale for each mouse. Mice are sorted by genotype with the PREPgt/gt mice on the left side and the wild-type PREPWT/WT mice on the right. Linear correlation between the two endogenous peptides underlines that γ-MSH, which is not a putative PREP substrate, can be used as an endogenous control to normalize α-MSH quantities across biological replicates.
Figure 4.
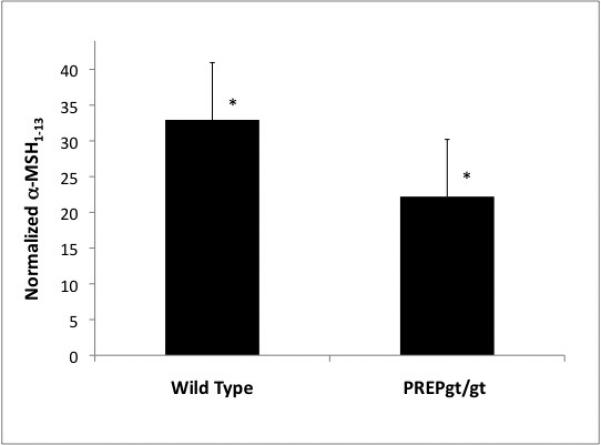
α-MSH plasma level determined by quantitative targeted proteomics. Average of MRM transitions combined peak areas shows a genotype effect. There is 1.5 fold more α-MSH in the plasma of wild-type mice (N=10) than in homozygous gene-trap mice (N=9) (Student t-test p-value = 0.0016).
Daily food intake was measured in male and female mice of all three genotypes on both diets. There were no significant genotype effects (data not shown).
Reciprocal cross reveals maternal effect on obesity (Experiment 2)
We examined the hypothesis that heterozygotes for the PREP gene-trap mutation will have a parent of origin effect on obesity. We performed reciprocal crosses of PREPWT/gt × PREPWT/WT using mice that were at generation N8 of backcross. All animals were phenotyped by the same protocol as for the intercross, but using only the LF diet (Figure 5 and Table 2). Pup genotype had no effect on phenotypes in either gender (Figure 5) and the pups of both genotypes were combined for analysis of maternal effects. Progeny of heterozygous PREPWT/gt females weighed significantly more and had significant greater fat mass (AI) than progeny of wild-type PREPWT/WT mothers. Pups born to heterozygous PREPWT/gt mothers also had higher body mass index and organ weights but not anal nasal length than pups born to wild-type PREPWT/WT mothers (Table 2).
Figure 5.

Reciprocal cross (Experiment 2). Body weight and adiposity index (AI) of male and female pups with either wild-type (PREPWT/WT, WT) or heterozygous (PREPWT/gt, H) mothers in the reciprocal cross and categorized by either the pup genotype or the maternal genotype. Pups were fed LF diet only. Data are means ± SE. See Figure 2 legend for methods. 3-Way ANOVA for both body weight and AI: effect of gender, p<0.0001; effect of pup genotype, NS; effect of maternal genotype, p<0.0001; all interactions, NS.
Table 2.
Body composition phenotypes of male and female pups of either wild-type (PREPWT/WT) or heterozygous PREPWT/gt) mothers. Pups were fed LF diet only. Data are means ± SE.
| Maternal Genotype | 2-way ANOVA1 | ||||||
|---|---|---|---|---|---|---|---|
| |
PREPWT/WT
2 |
PREPWT/gt |
PREPWT/WT |
PREPWT/gt |
Maternal genotype |
Gender of pups |
Interaction |
| Male pups | Female pups | ||||||
| AN length (cm) | 9.9 ± 0.0 a | 10.0 ± 0.0 a | 9.6 ± 0.1 b | 9.6 ± 0.0 b | NS | <0.0001 | NS |
| Body Mass Index | 0.28 ± 0.00 b | 0.31 ± 0.00 a | 0.22 ± 0.00 d | 0.25 ± 0.00 c | <0.0001 | <0.0001 | NS |
| Liver weight (g) | 0.97 ± 0.02 b | 1.11 ± 0.03 a | 0.88 ± 0.02 c | 1.03 ± 0.03 ab | <0.0001 | 0.0006 | NS |
| Kidney weight (g) | 0.30 ± 0.00 b | 0.32 ± 0.01 a | 0.22 ± 0.00 d | 0.24 ± 0.00 c | <0.0001 | <0.0001 | NS |
| Spleen weight (g) | 0.07 ± 0.00 b | 0.09 ± 0.00 a | 0.07 ± 0.00 b | 0.08 ± 0.00 a | <0.0001 | NS | NS |
P values were calculated by ANOVA: Bonferroni correction for multiple tests sets significant P value at ≤ 0.001. Post hoc comparisons were by Tukey's HSD: means not sharing a letter are significant at P = 0.05.
Group sizes: Males: PREPWT/WT, N=46; PREPWT/gt, N=42. Females: PREPWT/WT, N=32; PREPWT/gt, N=39.
Comparison of intercross and reciprocal cross data reveals maternal effects
Progeny from the intercross (Experiment 1) were compared with progeny from the reciprocal cross (Experiment 2) (Figure 6). Pups of both PREPWT/WT and PREPWT/gt genotypes are combined in this analysis since there was no significant effect of pup genotype on adiposity. The results support two conclusions: (1) obesity due to the PREP gene-trap mutation is either additive or dominant since effects are observed when breeding heterozygotes; and (2) data are consistent with maternal effects on obesity. Males cannot be the cause of the obesity phenotype since they cannot both cause leanness in the reciprocal PREPWT/gt male × PREPWT/WT female cross and obesity in the PREPWT/gt male × PREPWT/gt female intercross.
Figure 6.

Maternal obesity effects of the PREP gene-trap mutation on AI in male and female pups. Values are mean ± SE. See Figure 2 legend for methods. There are no significant differences between mice born to PREPWT/gt mothers. The F2 Intercross has only PREPWT/gt heterozygous mothers. Pup genotypes were PREPWT/gt or PREPWT/WT and are combined in this analysis since there was no genotype difference. Male and female heterozygous breeders in the reciprocal cross were littermates of PREPWT/WT × PREPWT/gt crosses.
Dam genotype and body weight do not affect litter size or pup birth weight (Table 3). Preliminary data from crosses of PREPWT/WT, PREPWT/gt and PREPgt/gt females indicate that dams become heavier with parity but that litter sizes and average pup weights are unaffected.
Table 3.
Dam body weight, litter size and average pup weight by parity and genotype. Dams fed breeder chow.
| |
Parity 1 |
Parity 2 |
||||
|---|---|---|---|---|---|---|
| Dam Genotype | Dam Genotype | |||||
| PREPWT/WT | PREPWT/gt | PREPgt/gt | PREPWT/WT | PREPWT/gt | PREPgt/gt | |
| Number of dams | 1 | 4 | 6 | 3 | 4 | 10 |
| Dam body wt (g) 1 | 21.8 | 18.1 ± 0.7 | 19.3 ± 0.3 | 24.3 ± 0.5 | 23.9 ± 0.7 | 24.1 ± 0.7 |
| Litter size | 8 | 8.3 ± 0.5 | 6.7 ± 0.9 | 8.7 ± 0.7 | 6.0 ± 0.7 | 8.6 ± 0.4 |
| Total number of pups | 8 | 33 | 47 | 26 | 24 | 86 |
| Average pup weight (g/litter) | 1.28 | 1.28 ± 0.04 | 1.22 ± 0.02 | 1.29 ± 0.05 | 1.34 ±0.03 | 1.28 ± 0.01 |
Two-way ANOVA: effect of parity, p<0.0001. All other p values for table, NS.
Discussion
We produced gene-trap mice that express minimal levels of PREP. PREP gene-trap has a strong maternal effect on body weight and fat mass: all progeny, regardless of PREP genotype, born to females heterozygous for the PREP mutation (PREPWT/gt) are significantly more obese than progeny born to wild-type (PREPWT/WT) mothers mated to PREPWT/gt heterozygous fathers.
Our data do not distinguish whether the maternal effects of PREP gene-trap mutation are pre- or post-natal. The obesity observed in progeny of PREP heterozygous females is not secondary to maternal obesity since PREP heterozygous females are, if anything, leaner than wild-type females on the low-fat diet (see Figure 2). Also, increased body weight in dams fed higher-fat breeder chow did not result in pups of greater average body weight at birth (Table 3).
There is no evidence of altered glucose metabolism in the PREP deficient mice fed the low-fat diet (Table 1). And in female mice, unlike males, even the high-fat diet did not result in elevated glucose and insulin levels. This differential regulation of insulin resistance by gender in B6 mice is likely due to gonadal steroid production in females (20, 21). Therefore, it is unlikely that gestational diabetes in the dams could explain the increased obesity of pups born to PREP heterozygous mothers.
When normalizing α-MSH with γ-MSH levels, we detected a genotype effect that was not observable when directly comparing α-MSH between the two genotypes. The decrease of α-MSH in plasma from PREPgt/gt is counter-intuitive as one could expect accumulation of α-MSH with reduced PREP enzyme, since it digests α-MSH in vitro (22). Our hypothesis is that feedback inhibition of α-MSH production from the desacetylated form of α-MSH may result from decreased turnover of α-MSH in a PREP deficient mouse strain. Such a mechanism would involved homeostatic sensing of α-MSH concentrations as has been suggested in the pars intermedia of the marsh frog (23).
The putative effects of PREP on vasopressin and oxytocin (6), which influence milk production, and the prior demonstration that inhibitors of PREP increase vasopressin levels in some brain regions (8) support the hypothesis that alterations of vasopressin and/or oxytocin by the PREP gene-trap may lead to the maternal obesity effects observed here.
Several specific genes exhibit parent of origin effects on obesity. Gs-α influences obesity through an imprinting mechanism in which deletion of the maternal allele causes obesity (24). Yellow coat color and obesity in the agouti viable yellow mouse (Avy) is due to an intracisternal A particle (IAP) inserted in the agouti gene causing ectopic expression of agouti (25). IAP methylation can also be influenced by maternal diet (26). There are no other known examples of maternal effects genes. Thus, maternal effects due to a PREP gene-trap mutation represent a novel mechanism for maternal effects.
The present data not only illustrate a novel mechanism for maternal genetic effects but also suggest the possibility of unintentional obesity from the inhibition of PREP in humans. PREP is a member of a serine protease family that can be inhibited by natural and synthetic compounds. Natural inhibitors were identified in hydrolysates of cheese, fish (27), wine (28), casein (29), unsaturated fatty acids (30) and plant phenolics (31). A survey of traditional Chinese medicinal plants identified PREP inhibitors. Berberine, an extract from Rhizoma coptidis, was identified as a PREP inhibitory molecule (32). Thus, humans could already self-administer PREP inhibitors using traditional medicinal extracts.
Several PREP inhibitors have been synthesized and tested in animal models and humans. Compound S 17092 improves memory in rodents and humans (33). Inhibition of PREP by a single dose of compound S 17092 increased hypothalamic α-MSH, although chronic treatment had no effect (22). Inhibition of PREP by S 17092 also raised levels of arg-vasopressin and TRH in some brain regions (34). Clinical trials of S 17092 in humans to test roles in cognitive enhancement and mood stabilization have begun (35).
Our results demonstrate a novel mechanism for maternal genetic effects on obesity of adult progeny via a serine protease. It is unlikely that PREP is the only protease that influences maternal effects. In principle, any gene that influences in utero or post-natal nutrition or care could cause maternal effects. As there are many similar serine proteases and since PREP is influenced by environmental factors such as food and traditional and pharmaceutical compounds, these results may illustrate a prevalent protease action mode. This could have broad significance for discovery of additional maternal genetic effects and for the relevance of PREP to obesity.
Supplementary Material
Acknowledgements
This work was supported by a NIH grant (R01-DK69978). We acknowledge the UC Davis Genome Center Proteomics Core for MS quantitative targeted peptidomics work.
References
- 1.Samuelsson AM, Matthews PA, Argenton M, Christie MR, McConnell JM, Jansen EH, et al. Diet-induced obesity in female mice leads to offspring hyperphagia, adiposity, hypertension, and insulin resistance: a novel murine model of developmental programming. Hypertension. 2008;51:383–392. doi: 10.1161/HYPERTENSIONAHA.107.101477. [DOI] [PubMed] [Google Scholar]
- 2.Lambin S, van Bree R, Caluwaerts S, Vercruysse L, Vergote I, Verhaeghe J. Adipose tissue in offspring of Lepr(db/+) mice: early-life environment vs. genotype. Am J Physiol Endocrinol Metab. 2007;292:E262–271. doi: 10.1152/ajpendo.00308.2006. [DOI] [PubMed] [Google Scholar]
- 3.Davison KK, Birch LL. Obesigenic families: parents’ physical activity and dietary intake patterns predict girls’ risk of overweight. Int J Obes Relat Metab Disord. 2002;26:1186–1193. doi: 10.1038/sj.ijo.0802071. [DOI] [PMC free article] [PubMed] [Google Scholar]
- 4.Hager R, Cheverud JM, Wolf JB. Maternal effects as the cause of parent-of-origin effects that mimic genomic imprinting. Genetics. 2008;178:1755–1762. doi: 10.1534/genetics.107.080697. [DOI] [PMC free article] [PubMed] [Google Scholar]
- 5.Diament AL, Warden CH. Multiple linked mouse chromosome 7 loci influence body fat mass. Int J Obes Relat Metab Disord. 2004;28:199–210. doi: 10.1038/sj.ijo.0802516. [DOI] [PubMed] [Google Scholar]
- 6.Walter R, Shlank H, Glass JD, Schwartz IL, Kerenyi TD. Leucylglycinamide released from oxytocin by human uterine enzyme. Science. 1971;173:827–829. doi: 10.1126/science.173.3999.827. [DOI] [PubMed] [Google Scholar]
- 7.Garcia-Horsman JA, Mannisto PT, Venalainen JI. On the role of prolyl oligopeptidase in health and disease. Neuropeptides. 2007;41:1–24. doi: 10.1016/j.npep.2006.10.004. [DOI] [PubMed] [Google Scholar]
- 8.Bellemere G, Vaudry H, Mounien L, Boutelet I, Jegou S. Localization of the mRNA encoding prolyl endopeptidase in the rat brain and pituitary. J Comp Neurol. 2004;471:128–143. doi: 10.1002/cne.20019. [DOI] [PubMed] [Google Scholar]
- 9.Ohta N, Takahashi T, Mori T, Park MK, Kawashima S, Takahashi K, et al. Hormonal modulation of prolyl endopeptidase and dipeptidyl peptidase IV activities in the mouse uterus and ovary. Acta Endocrinol (Copenh) 1992;127:262–266. doi: 10.1530/acta.0.1270262. [DOI] [PubMed] [Google Scholar]
- 10.Maes M, Monteleone P, Bencivenga R, Goossens F, Maj M, van West D, et al. Lower serum activity of prolyl endopeptidase in anorexia and bulimia nervosa. Psychoneuroendocrinology. 2001;26:17–26. doi: 10.1016/s0306-4530(00)00032-9. [DOI] [PubMed] [Google Scholar]
- 11.Maes M, Goossens F, Scharpe S, Calabrese J, Desnyder R, Meltzer HY. Alterations in plasma prolyl endopeptidase activity in depression, mania, and schizophrenia: effects of antidepressants, mood stabilizers, and antipsychotic drugs. Psychiatry Res. 1995;58:217–225. doi: 10.1016/0165-1781(95)02698-v. [DOI] [PubMed] [Google Scholar]
- 12.Mantle D, Falkous G, Ishiura S, Blanchard PJ, Perry EK. Comparison of proline endopeptidase activity in brain tissue from normal cases and cases with Alzheimer's disease, Lewy body dementia, Parkinson's disease and Huntington's disease. Clin Chim Acta. 1996;249:129–139. doi: 10.1016/0009-8981(96)06282-1. [DOI] [PubMed] [Google Scholar]
- 13.Warden CH, Fisler JS, Shoemaker SM, Wen PZ, Svenson KL, Pace MJ, et al. Identification of four chromosomal loci determining obesity in a multifactorial mouse model. J Clin Invest. 1995;95:1545–1552. doi: 10.1172/JCI117827. [DOI] [PMC free article] [PubMed] [Google Scholar]
- 14.Chiu S, Kim K, Haus KA, Espinal GM, Millon LV, Warden CH. Identification of positional candidate genes for body weight and adiposity in subcongenic mice. Physiol Genomics. 2007;31:75–85. doi: 10.1152/physiolgenomics.00267.2006. [DOI] [PubMed] [Google Scholar]
- 15.Matthews DR, Hosker JP, Rudenski AS, Naylor BA, Treacher DF, Turner RC. Homeostasis model assessment: insulin resistance and beta-cell function from fasting plasma glucose and insulin concentrations in man. Diabetologia. 1985;28:412–419. doi: 10.1007/BF00280883. [DOI] [PubMed] [Google Scholar]
- 16.Schaalan M, El-Abhar HS, Barakat M, El-Denshary ES. Westernized-like-diet-fed rats: effect on glucose homeostasis, lipid profile, and adipocyte hormones and their modulation by rosiglitazone and glimepiride. J Diabetes Complications. 2008 doi: 10.1016/j.jdiacomp.2008.02.003. [DOI] [PubMed] [Google Scholar]
- 17.Herbach N, Rathkolb B, Kemter E, Pichl L, Klaften M, de Angelis MH, et al. Dominant-negative effects of a novel mutated Ins2 allele causes early-onset diabetes and severe beta-cell loss in Munich Ins2C95S mutant mice. Diabetes. 2007;56:1268–1276. doi: 10.2337/db06-0658. [DOI] [PubMed] [Google Scholar]
- 18.Chen H, Simar D, Lambert K, Mercier J, Morris MJ. Maternal and postnatal overnutrition differentially impact appetite regulators and fuel metabolism. Endocrinology. 2008;149:5348–5356. doi: 10.1210/en.2008-0582. [DOI] [PubMed] [Google Scholar]
- 19.Barrett T, Troup DB, Wilhite SE, Ledoux P, Rudnev D, Evangelista C, et al. NCBI GEO: archive for high-throughput functional genomic data. Nucleic Acids Res. 2008 doi: 10.1093/nar/gkn764. [DOI] [PMC free article] [PubMed] [Google Scholar]
- 20.Vasudevan H, Xiang H, McNeill JH. Differential regulation of insulin resistance and hypertension by sex hormones in fructose-fed male rats. Am J Physiol Heart Circ Physiol. 2005;289:H1335–1342. doi: 10.1152/ajpheart.00399.2005. [DOI] [PubMed] [Google Scholar]
- 21.Yakar S, Nunez NP, Pennisi P, Brodt P, Sun H, Fallavollita L, et al. Increased tumor growth in mice with diet-induced obesity: impact of ovarian hormones. Endocrinology. 2006;147:5826–5834. doi: 10.1210/en.2006-0311. [DOI] [PubMed] [Google Scholar]
- 22.Bellemere G, Morain P, Vaudry H, Jegou S. Effect of S 17092, a novel prolyl endopeptidase inhibitor, on substance P and alpha-melanocyte-stimulating hormone breakdown in the rat brain. J Neurochem. 2003;84:919–929. doi: 10.1046/j.1471-4159.2003.01536.x. [DOI] [PubMed] [Google Scholar]
- 23.Jenks BG, Verburg van Kemenade BM, Tonon MC, Vaudry H. Regulation of biosynthesis and release of pars intermedia peptides in Rana ridibunda: dopamine affects both acetylation and release of alpha-MSH. Peptides. 1985;6:913–921. doi: 10.1016/0196-9781(85)90322-5. [DOI] [PubMed] [Google Scholar]
- 24.Xie T, Chen M, Gavrilova O, Lai EW, Liu J, Weinstein LS. Severe obesity and insulin resistance due to deletion of the maternal Gsalpha allele is reversed by paternal deletion of the Gsalpha imprint control region. Endocrinology. 2008;149:2443–2450. doi: 10.1210/en.2007-1458. [DOI] [PMC free article] [PubMed] [Google Scholar]
- 25.Dolinoy DC, Weidman JR, Waterland RA, Jirtle RL. Maternal genistein alters coat color and protects Avy mouse offspring from obesity by modifying the fetal epigenome. Environ Health Perspect. 2006;114:567–572. doi: 10.1289/ehp.8700. [DOI] [PMC free article] [PubMed] [Google Scholar]
- 26.Waterland RA, Travisano M, Tahiliani KG, Rached MT, Mirza S. Methyl donor supplementation prevents transgenerational amplification of obesity. Int J Obes (Lond) 2008;32:1373–1379. doi: 10.1038/ijo.2008.100. [DOI] [PMC free article] [PubMed] [Google Scholar]
- 27.Sorensen R, Kildal E, Stepaniak L, Pripp AH, Sorhaug T. Screening for peptides from fish and cheese inhibitory to prolyl endopeptidase. Nahrung. 2004;48:53–56. doi: 10.1002/food.200300358. [DOI] [PubMed] [Google Scholar]
- 28.Yanai T, Suzuki Y, Sato M. Prolyl endopeptidase inhibitory peptides in wine. Biosci Biotechnol Biochem. 2003;67:380–382. doi: 10.1271/bbb.67.380. [DOI] [PubMed] [Google Scholar]
- 29.Asano M, Nio N, Ariyoshi Y. Inhibition of prolyl endopeptidase by synthetic peptide fragments of human beta-casein. Agric Biol Chem. 1991;55:825–828. [PubMed] [Google Scholar]
- 30.Park YS, Jang HJ, Lee KH, Hahn TR, Paik YS. Prolyl endopeptidase inhibitory activity of unsaturated fatty acids. J Agric Food Chem. 2006;54:1238–1242. doi: 10.1021/jf052521h. [DOI] [PubMed] [Google Scholar]
- 31.Lee SH, Jun M, Choi JY, Yang EJ, Hur JM, Bae K, et al. Plant phenolics as prolyl endopeptidase inhibitors. Arch Pharm Res. 2007;30:827–833. doi: 10.1007/BF02978832. [DOI] [PubMed] [Google Scholar]
- 32.Tarrago T, Kichik N, Segui J, Giralt E. The natural product berberine is a human prolyl oligopeptidase inhibitor. ChemMedChem. 2007;2:354–359. doi: 10.1002/cmdc.200600303. [DOI] [PubMed] [Google Scholar]
- 33.Morain P, Lestage P, De Nanteuil G, Jochemsen R, Robin JL, Guez D, et al. S 17092: a prolyl endopeptidase inhibitor as a potential therapeutic drug for memory impairment. Preclinical and clinical studies. CNS Drug Rev. 2002;8:31–52. doi: 10.1111/j.1527-3458.2002.tb00214.x. [DOI] [PMC free article] [PubMed] [Google Scholar]
- 34.Bellemere G, Vaudry H, Morain P, Jegou S. Effect of prolyl endopeptidase inhibition on arginine-vasopressin and thyrotrophin-releasing hormone catabolism in the rat brain. J Neuroendocrinol. 2005;17:306–313. doi: 10.1111/j.1365-2826.2005.01308.x. [DOI] [PubMed] [Google Scholar]
- 35.Morain P, Boeijinga PH, Demazieres A, De Nanteuil G, Luthringer R. Psychotropic profile of S 17092, a prolyl endopeptidase inhibitor, using quantitative EEG in young healthy volunteers. Neuropsychobiology. 2007;55:176–183. doi: 10.1159/000107070. [DOI] [PubMed] [Google Scholar]
Associated Data
This section collects any data citations, data availability statements, or supplementary materials included in this article.