

Abstract
Digital breast tomosynthesis (DBT) mammography is a promising imaging technique that has the potential to improve detection of early-stage breast cancers. DBT mammography can provide quasi three-dimensional information by reconstructing the breast volume from a number of low-dose mammograms acquired over a limited angular range. Previous studies have shown that iterative reconstruction methods such as simultaneous algebraic reconstruction technique (SART) can give satisfactory image quality in DBT. However, due to the finite size of the detector and the limited field of view, DBT reconstruction contains artifacts caused by the truncated projection-view (PV) images. We developed methods that use a local intensity equalization strategy and a geometrical tissue-compensation method to remove two types of truncation artifacts: detector boundary discontinuity and underestimation of the attenuation pathlength. A custom-built breast phantom and a selected DBT patient case were used to evaluate the improvements. A GE prototype DBT system was used to acquire 21 PVs in 3° increments over a ±30° angular range. Experimental results demonstrated that the artifact reduction methods can improve the image quality at the boundaries with enhanced contrast-to-noise ratio and increased background uniformity, recover the obscured breast structural information, and achieve an overall reconstruction quality comparable to that without truncation.
1. Introduction
Digital breast tomosynthesis (DBT) mammography attracts increasing attention as a promising technique of breast imaging that can provide quasi three-dimensional (3D) information 1-6. The depth resolution obtained in DBT mammography that is absent in conventional mammography can reduce the camouflaging effect of overlapping fibroglandular breast tissue and improve the conspicuity of subtle lesions, and thus potentially improve breast cancer detection at its early stage 7-14.
In DBT, a sequence of low-dose projection-view mammograms (PVs) is acquired at a small number of projection angles over a limited angular range. The total radiation dose of a DBT mammogram is set to be comparable to that used in a conventional mammogram and can be distributed to individual PVs evenly or unevenly, resulting in much lower dose for each PV 3. The reconstruction of the imaged volume from 2D mammograms thus represents a limited-angle cone-beam tomographic problem. A review of tomosynthesis reconstruction techniques can be found in the literature 15.
Simple back-projection (BP) type methods 1, 16-18 can provide rapid solution of DBT image reconstruction but only inferior image quality. Filtered BP (FBP) type methods, which are commonly used in computed tomography (CT) reconstruction, have been modified for this limited-angle problem 4, 5, 19. With special filters that are designed to partially compensate for the incomplete sampling in the depth direction, FBP type methods can provide satisfactory image quality and have the advantage of fast computation; however, they are restricted by the imaging geometry. For example, for certain DBT systems that utilize a very narrow projection angular range, a non-uniform angular sampling scheme, and/or a stationary detector, the interpolation or approximation required for FBP in DBT is more complex than that required for conventional FBP in CT, and the resulting errors may degrade the reconstruction image quality. On the other hand, iterative methods, including those based on algebraic reconstruction techniques and those based on statistical models such as maximum likelihood (ML) method, can be easily adapted to limited-angle tomography without any geometry restriction. Some comparative studies of DBT reconstruction methods for specific system configurations and imaging conditions can be found in the literature 20-22. Recent hardware acceleration 23, parallel processing 24 and other development 25 have significantly improved the computation speed of iterative DBT reconstruction. However, the computational efficiency of iterative reconstruction methods may still be an issue until these acceleration techniques can be applied in general.
The truncated projections, i.e., when a portion of the breast is not recorded in some or all of the PV images because of a finite-size detector, will cause artifacts in DBT reconstruction. The limited field of view (FOV) or the cone-beam ray path, which is delineated by the detector area and the x-ray source position, results in unexposed regions in the imaged object and truncation of the PVs, particularly at large projection angles. In iterative reconstruction such as the SART method, the imaged volume (defined in Section 2.1) is updated by processing each individual PV image, i.e. only the part of the imaged volume within the cone-beam ray path of the current PV will be updated. This will result in discontinuity in the voxel values across the cone-beam path boundary which will be enhanced by further PV processing in the same and subsequent iterations 25. These truncation artifacts in DBT reconstruction appear as bright staircase-like lines or bands at the two sides perpendicular to the x-ray source motion on all tomosynthesized slices. A second type of truncation artifacts is caused by estimation errors in the x-ray attenuation due to the finite imaged volume modeled in the reconstruction algorithm. Since the presence of breast tissue outside the imaged volume is ignored and the attenuation is considered to have occurred only within the shortened pathlength, the voxel values will be overestimated. Both of these artifacts are apparent mainly at the image boundary of DBT slices and will obscure the breast tissue details near the boundary and potentially affect the accuracy of lesion detection.
Previous attempts to reduce the truncation artifacts for CT or other transmission imaging reconstruction include extrapolation methods to artificially extend the truncated PVs by polynomial functions 26, symmetric mirroring 27, square root functions 28, and cylindrical water-object fitting 29. Consistency and continuity constraints are utilized in these methods to facilitate parameter estimation and avoid characteristic artifacts at the edge of the truncated boundary. In a dedicated asymmetric fan-beam CT system, rebinning techniques have been used to estimate the missing projection profile of one view from its opposite view 30, 31. Kunze et al32 incorporated a constraint term of the object logarithmic likelihood function into the cost function for algebraic reconstruction methods to reduce the effect of truncation. For DBT reconstruction with FBP method, Li et al33 developed a non-uniform weighting strategy to compensate for the detector boundary truncation artifact by using the number of PVs contributing information to each imaged voxel. These methods, however, are not appropriate for iterative reconstruction in breast tomosynthesis due to the demand of high spatial resolution and the absence of a priori knowledge in modeling breast tissue structure. Extension of truncated projections by extrapolation or interpolation methods will introduce approximation error and degrade image quality, which is particularly apparent when the missing portion is large. On the other hand, non-uniform weighting using PV-counting cannot be incorporated with linear iterative reconstruction algorithms that employ individual PV-based updating, e.g., SART method, or non-linear iterative algorithms, e.g., ML type methods.
In this study, we developed methods to reduce the truncation artifacts due to the limited detector size and the attenuation compensation of the missing breast tissue excluded by the modeled imaged volume. Our goal focuses on providing satisfactory tomosynthesized image quality at the image boundary near the truncated edge so that the visibility of the breast structural information will not be obscured by the artifacts. A custom-built breast phantom is used to quantitatively compare the image quality between results with and without the artifact reduction. In addition, we demonstrated the effectiveness of the proposed methods with a patient DBT case that had truncated MLO-view PV images.
2. Materials and Methods
2.1. Breast Tomosynthesis System
The imaging geometry of the GE prototype digital tomosynthesis system is shown in Figure 1. The DBT system has a CsI phosphor/a:Si active matrix flat panel digital detector with dimensions of 19.20 cm × 23.04 cm and a pixel size of 0.1 mm×0.1 mm, resulting in a detector matrix size of 1920 × 2304 pixels. The digital detector is stationary during image acquisition. The DBT system acquires PV images at 21 different angles over a ±30° range by rotating the x-ray tube in 3° increments. The distance from the x-ray focal spot to the center of rotation is 64 cm and the plane along which the x-ray source rotates is perpendicular to the detector surface at the chest wall edge. The focal-spot-to-detector distance is 66 cm. The image acquisition process takes less than 8 seconds.
Figure 1.

Geometry of the second generation GE prototype digital breast tomosynthesis mammography system used in this study.
In our DBT reconstruction algorithm, we define the “imaged volume” as a rectangular box having the same area as the detector, and the thickness as that of the compressed breast measured by the DBT system. For reconstruction, this imaged volume is subdivided into an array of voxels, of which the X and Y dimensions are chosen to be the same as the detector pixel size (0.1 mm × 0.1 mm) while the Z-dimension (the slice interval) is chosen to be 1 mm in this study. The reconstruction process is to estimate the local x-ray attenuation properties of the breast, represented as voxel values in the imaged volume. For simplicity, the negative logarithm of the normalized pixel intensity, which is proportional to the line integral of the linear x-ray attenuation, is referred to as the “detected pixel value” or “detected data” in the following discussions. We assume a monoenergetic x-ray source and ignore the effects of scattering and beam hardening in this study, similar to the approach by Wu et al20.
2.2. Simultaneous Algebraic Reconstruction Technique (SART)
We will review briefly the application of SART in DBT reconstruction. More details can be found in our previous publications 21, 25. SART 34, 35 is an iterative reconstruction technique proposed as a refinement of the original algebraic reconstruction technique 36-38. In SART, the iterative process starts with an initial distribution. An update of the 3D distribution of the voxel values is performed based on individual PV. The calculated forward projection using the current estimates of xj in the volume will be compared to the actual detected data and the difference will be back-projected and added to the imaged volume. The updating is performed after all rays in one PV have been processed. One complete iteration is defined as the process that all PV images have been used once, and the number of updates in one complete iteration is thus equal to the number of PVs. The number of iterations and the relaxation parameter λ are often pre-determined based on both quantitative analysis and visual comparison of reconstructed image quality for a given type of cases. We have experimentally demonstrated that, with appropriate choices of initialization and the relaxation parameter, SART can provide satisfactory image quality with one complete iteration for our DBT system 21.
2.3. Truncation Artifacts
We focus on two types of truncation artifacts in iterative DBT reconstruction resulting from the PV cutoff by the limited detector size and the breast tissue cutoff by the preset imaged volume.
In Figure 2(a), the cone-beam ray paths for three x-ray source positions are depicted. The cone-beam path boundary is determined by the x-ray source position and the boundary of the detector pixel arrays. The unexposed part of the imaged volume varies as the x-ray source position changes. The overall effect is that some middle part of the imaged volume is completely covered by the x-ray beam at all PVs, and for other parts, they are exposed only by a subset of the PVs. The middle, completely covered region grows larger as the slice gets closer to the breast support plate 25. Figure 2(a) also illustrates that at large projection angles, the projected breast volume can be truncated due to the limited detector size. For a given PV, only the part of the imaged volume within the current FOV will be updated whereas the voxels outside maintain their previous values. This will cause a discontinuity in the voxel values across the cone-beam boundary, marked by open crosses in Figure 2(b) for the (n-1)th x-ray source position.
Figure 2.


(a) Cone-beam path of different x-ray source locations resulting in unexposed regions in the imaged volume for some PVs, and truncated projections of breast at large projection angles; (b) Individual PV image based updating in SART method causing discontinuity at cone-beam path boundary; (c) Truncated projections of pectoral muscles in MLO-view by imaged volume resulting in missing pathlength along segment AB. This underestimation of the pathlength (AC becomes BC) causes overestimation of the attenuation by the breast tissue and thus an overestimation of the voxel values along BC.
The discontinuity or truncation artifact can be further enhanced like an edge during updating in subsequent PV processing, e.g., during updating with the nth PV image in which a new part of imaged volume beyond the previous cone-beam path boundary is covered. For simplicity of discussion, we assume that the PV access order in SART follows that of the x-ray source motion. However, in general, the PV access order can be chosen in different ways 39. The new volume part is geometrically determined by these two consecutively processed x-ray source positions and the detector array positions, and will be an oblique wedge-shaped pentahedron, represented by the light shaded area in Figure 2(b). This process repeats for all PV images sequentially, forming discontinuities in a staircase pattern on the reconstructed slices. In the following discussion, this will be referred to as “detector boundary” truncation artifact. The detector boundary truncation artifact that occurs within the reconstructed breast region cannot be eliminated by trimming off the image background region external to the breast by using the 3D breast boundary, as was done in our previous work 25.
The other source of artifact is the underestimation of pathlength for x-rays near the edge of the imaged volume, as depicted in Figure 2(c). For the x-rays near the imaged volume boundary, indicated by a line segment AC, for example, which passes through and is attenuated by breast tissue beyond the part included in the imaged volume (line segment BC), both the total pathlength along these x-rays and the computed forward projection data will be severely underestimated. When the difference between the detected pixel value and the computed value is normalized by the total pathlength and back-projected, this underestimation will result in very large incremental value for updating all voxels along the x-ray path, and thereby overestimation of the voxel values. The overestimation will cause a bright area with possible out-of-range values in the boundary regions on the DBT slices. The severity of this truncation artifact depends on the fraction of the pathlength outside the imaged volume (line segment AB relative to the total pathlength AC) and the actual attenuation by the breast tissue along AB. This problem is particularly severe for MLO-view projections because the pectoral muscle will most likely extend beyond the imaged volume and cause erroneous estimation of the voxel values. In the following discussion, this will be referred to as “glaring” artifact.
2.4 Correction Algorithms
With the observations and the analysis discussed in the last section, the key to prevent enhancement on the “detector boundary” artifacts during the SART iterative process is to avoid sharp changes (discontinuity) in the voxel values before they will be enhanced by subsequent updating. We designed a local intensity equalization strategy to achieve this goal. For each PV image, after the updating using the current PV is completed, we replace all voxel values within the oblique wedge-shape volume to be updated by the next PV image with the average value obtained from their neighborhood region in the already updated zone. The process is implemented in a column-wise manner, i.e., along each column of voxels parallel to the Y-axis on every tomosynthesized slice. Therefore, both the column segment in the oblique wedge-shape partial volume R and its local neighborhood R' along the same column will change depending on the column, slice and PV positions. Figure 3 illustrates the application of this method in the first SART iteration when the imaged volume is initialized with a constant distribution. The original voxel values of the initialized distribution beyond the current cone-beam path boundaries, depicted as the line profile in a thick dotted line, will be replaced by a calculated constant value from averaging its neighboring segment, depicted by the thick scribbled lines.
Figure 3.

A local intensity equalization strategy for preventing enhancement of large discontinuity in voxel values between the cone-beam path boundaries of two PVs that are processed consecutively for updating the voxel values during iterative reconstruction.
To address the “glaring” artifact, we designed a practical compensation method. Referring again to Figure 2(c), for any x-ray incident on the preset rectangular imaged volume from the boundary side, if the corresponding detected pixel value is above a predetermined threshold, it is assumed that this ray has encountered very large attenuation rather than traveling through air volume. The threshold is chosen depending on the preferred sensitivity of the truncation detection. Then the computed value of this ray will be compensated for by estimating the pathlength segment outside the imaged volume (line segment AB) in addition to that within the imaged volume (line segment BC). The total linear attenuation within the “missing” volume is estimated by multiplying an average linear attenuation coefficient of breast tissue with the pathlength AB. This is equivalent to assuming that the missing portion is filled with “average” breast tissue when no a priori knowledge of the shape and materials is available. When updating the imaged volume along this ray, the modified difference between the detected pixel value and the new computed value is normalized by the corrected total pathlength, i.e., line segment AC, but still back-projected to those voxels within the preset imaged volume only, i.e., line segment BC.
In practice, the parameters such as the neighborhood region size for the detector boundary truncation artifact correction and the threshold on the detected pixel value for the glaring artifact correction are often pre-determined based on both quantitative analysis of image quality measures and visual comparison of reconstructed image quality for a given type of cases. The chosen parameters are then fixed and applied to this type of cases in future reconstructions.
2.5 Breast Phantom Design and Figures of Merit
To quantitatively evaluate the improvement on DBT image quality with the proposed truncation artifact reduction methods, we custom-built a breast phantom containing test objects on a thin feature layer placed on the top of five 1-cm-thick homogeneous Lucite plates. The test objects were arranged in groups in both the boundary and middle regions, as schematically shown in Figure 4. The test objects include layers of thin circular aluminum foils to simulate masses, high-contrast metal wires to simulate metal markers or biopsy clips (denoted by W1, W2 and W3), and low-contrast plastic wires to simulate spiculations (denoted by W4, W5 and W6). The two groups of masses, denoted by M1, M2 and M3 and by M4, M5 and M6, respectively, have the same diameter but different number of aluminum foils in order to simulate different contrasts. To distinguish them in Figure 4, the lower-contrast masses are drawn with shaded circles of a slightly smaller size than those for the higher-contrast ones. All wires were placed approximately perpendicular to the chest wall edge in order to evaluate the DBT blurring along the x-ray source moving direction which is parallel to the chest-wall edge. On the top of the feature layer, there is another 1-cm-thick homogeneous Lucite plate. The breast phantom was placed at three locations that were shifted parallel to the chestwall edge of the stationary detector such that the imaged objects in the boundary area were truncated by varying number of PVs. The experiments are described in more details in the next section.
Figure 4.

The feature layer of the breast phantom, including simulated masses of higher contrast (M1, M2 and M3) and lower contrast (M4, M5 and M6), high-contrast steel wires (W1, W2 and W3) and low-contrast plastic wires (W4, W5 and W6). This feature layer is sandwiched by five 1-cm-thick homogenous Lucite plates below and one 1-cm-thick homogenous Lucite plate above.
In this study, we concentrated on the evaluation of the image quality of reconstructed features located near the boundary with and without applying the proposed artifact reduction methods. The images of these objects were compared to their counterpart objects located in the middle region where no truncation occurred. The contrast-to-noise ratio (CNR), the normalized line profiles of feature objects, and a non-uniformity error index were used as performance measures.
The CNR of the simulated mass is calculated as the difference of the average pixel intensity of the feature and its local image background, divided by the standard deviation of pixel intensity in the image background. The average pixel intensity of a simulated mass was calculated in an area enclosed within the central region of the mass. The image background was chosen as a region close to the feature but far from other objects and the truncation artifact areas. The line profile of the simulated mass, the high-contrast metal wire and the low-contrast plastic wire, along the Y-axis (parallel to the chest-wall edge and the x-ray source moving direction) were extracted. In addition, line profile of the local homogeneous Lucite background was extracted, and then subtracted from that of the object to obtain the object-alone profile so that the potential blurring effect of the artifact reduction methods on the profile sharpness could be evaluated.
The non-uniformity error index (NUEI) is defined as the ratio of the difference between the average pixel intensities of two ROIs located in the middle region and the lower boundary region, respectively, to the average pixel intensity of the middle region. Both ROIs in the boundary and the middle regions were chosen in the Lucite background containing no objects. Zero NUEI value represents an ideal uniform background. A similar quantity was used by Li et al.33 to evaluate the uniformity improvement in reduction of detector boundary artifacts for FBP reconstruction in chest tomosynthesis.
3. Experimental Results
We applied the proposed artifact reduction algorithms to the DBT reconstruction of the breast phantom and a selected MLO-view patient case. Institutional Review Board (IRB) approval and informed consent were obtained for collection of the patient case. The SART method was used for reconstruction of the DBT slices, in which the reconstruction was initialized with a constant distribution and a constant relaxation parameter of 0.5 and one iteration were used.
3.1 Breast Phantom
The breast phantom was imaged by the DBT system at three different locations, referred to as experiment L1, L2 and L3, respectively. Placing the breast phantom at the various locations enables us to investigate the effectiveness of the artifact reduction methods for different degrees of PV truncation. The number of PV images in which the group of objects in the lower boundary region (i.e., M1, M4, W1 and W4) was cut-off was 4 to 5, 8 to 9, and 12 to 13, for experiment L1, L2 and L3, respectively. For all experiments, the middle object group (i.e., M2, M5, W2 and W5) was always recorded on all PV images.
Figure 5 shows the reconstruction results of the lower part of the feature layer with and without the truncation artifact reduction. Results of the upper and middle groups of features were not shown because they were not affected by the proposed methods. The detector boundary artifacts appearing as bright horizontal lines have been reduced in L1 and they are totally removed in L2 and L3. The remaining artifacts in L1, i.e. the slight darker bands along the steps, are caused by the penumbra of the collimator blade recorded at the edge of some of the PV raw images during image acquisition in this experiment. The visual image quality of all features was markedly improved, especially for the low-contrast plastic wire which was almost totally obscured by the truncation artifacts without correction.
Figure 5.
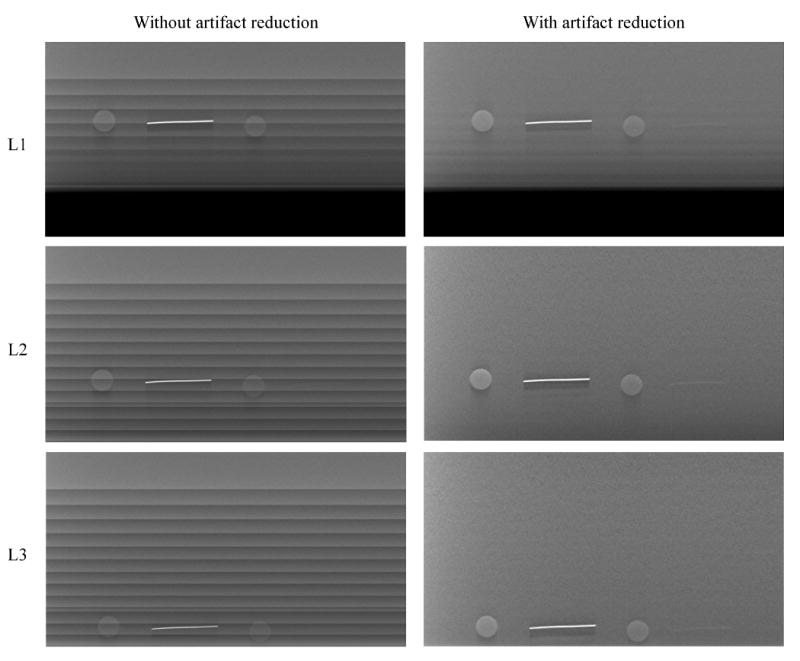
SART reconstructed DBT slice containing the test objects for three different experiments (each row) without (left column) and with (right column) the artifact reduction.
The line profiles of all simulated masses and wires are shown in Figure 6 for one selected experiment, L2. Results of other experiments provided similar performance. The two groups of masses and the two groups of high-contrast and low-contrast wires are shown separately (refer to Figure 4 for object locations). For the purpose of comparison, in each group, the line profiles of the object located in the lower region (e.g., M1), without and with artifact reduction, were plotted together with the line profile of the counterpart object in the middle region (e.g., M2) and the top region (e.g., M3). Since the access order in our SART implementation follows that of the x-ray source motion, our artifact reduction method affects only the lower part of the image. For masses, all line profiles were mean-removed. Similarly, for wires, we removed the mean pixel intensity and normalized the resulting maximum intensity to 1 to facilitate the comparison of relative sharpness.
Figure 6.

Comparison of the normalized line profiles of all simulated masses and wires for the selected experiment L2. For each feature group, it includes the line profiles of the feature located in the lower region, without (solid grey line) and with artifact reduction (solid black line), the line profile of the corresponding object located in the middle (black dashed line) and the top (black dotted line) regions. For the simulated masses, the pixel intensity was normalized by removing the mean of each line profile; for wires, the mean of each line profile was removed and the maximum intensity was normalized to 1. Refer to Figure 4 for the locations of all objects.
Figure 6 shows that the line profiles of all objects located in the lower region (i.e., M1, M4, W1 and W4) contained strong truncation artifacts (i.e., large discontinuities) without artifact reduction. This is also illustrated by the reconstructed slice images in Figure 5. With artifact reduction, the resulting line profiles were much smoother, similar to that of the counterpart object in the middle region where no truncation occurred. For the group of plastic wires (W4, W5 and W6), their attenuation property was very close to that of the homogeneous Lucite material in the background thereby the reconstructed voxel intensities were much noisier than those of other objects. Without truncation artifact correction, the plastic wires were almost totally obscured by the intensity variation of the step artifact. With artifact reduction, one can visualize the wire shape and locate the local intensity maximum at the correct object position. Finally, the profiles for all objects located in the upper region of the images contain some mild truncation artifacts. These artifacts were not affected by the proposed methods, evident as the intensity fluctuation of the black dotted line in each plot, and will be discussed in the next section. We also compared the background-subtracted profiles of the corresponding objects in the different groups. The profiles exhibited very similar shape, indicating that the intensity equalization strategy does not degrade the sharpness of an object located in the corrected area.
The CNR values of the simulated masses and the NUEI values are listed in Table 1. The numbers in the parentheses are the results without artifact reduction. The NUEI values indicate that the truncation artifact reduction improved the uniformity of the reconstructed Lucite background. As the breast phantom was moved closer to the lower boundary of the x-ray detector from experiment L1 to L3, the number of truncated PV images for the lower-region objects increased. The intensity equalization strategy particularly favors the reconstruction of the homogenous Lucite background, therefore gives a continuously improving (i.e., decreasing) NUEI values from experiment L1 to L3. The improvement in the CNR values of objects M1 and M4 is also substantial. Without artifact reduction, the CNR values for masses M1 and M4 were low in all experiments although experiment L1 provided slightly better CNR values because more PV images containing these features were included in L1 than in L2 and L3. After artifact reduction, the CNR values of M1 (and M4) in different experiments are very close, in agreement with our observations from the reconstruction result and the corresponding line profiles. For a given mass group in each experiment, the CNR value of the mass located in the middle region (M2 or M5) is greater than that of the mass located in both the upper and the lower regions. This difference can be attributed to the fact that the middle region was fully updated by all PV images while either the upper or the lower region was updated only by a subset of the PVs.
Table 1.
The contrast-to-noise ratio (CNR) of all simulated masses (denoted by M*), and non-uniformity error index (NUEI) in all three experiments (denoted by L*). The numbers in the parentheses are the values without artifact correction.
| M1 | M2 | M3 | M4 | M5 | M6 | NUEI (%) | |
|---|---|---|---|---|---|---|---|
| L1 | 7.6 (2.7) | 9.5 | 4.2 | 3.5 (1.3) | 4.7 | 2.3 | 2.06 (5.16) |
| L2 | 7.6 (1.8) | 9.4 | 6.4 | 3.3 (0.4) | 4.8 | 3.7 | 0.86 (4.98) |
| L3 | 7.5 (1.6) | 9.4 | 9.0 | 3.2 (0.5) | 4.9 | 3.8 | 0.14 (5.22) |
3.2 The Selected DBT Patient Case
A patient DBT case with MLO-view was selected for demonstrating the application of the proposed artifact reduction methods. The thickness of the imaged breast was measured by the DBT system as 7.3 cm. In Figure 7, three selected tomosynthesized slices at 4.8 cm, 2.0 cm and 0.7 cm above the breast support plate are shown without (upper row) and with (lower row) the detector boundary and glaring artifact reduction.
Figure 7.

Three selected DBT slices obtained by SART reconstruction for MLO-view patient case: (a) and (d) 4.8 cm, (b) and (e) 2.0 cm, (c) and (f) 0.7 cm above the breast support plate; (a)-(c) reconstructed slices without any artifact reduction, (d)-(f) reconstructed slices using the proposed methods. Note that the detector boundary artifacts at the top of all slices have been completely removed. The lymph node located at the upper-right corner of the second slice has been essentially recovered. The glaring artifacts caused by the underestimated pathlength have been corrected and the reconstructed voxel intensities are comparable to those of normal breast tissue without any truncation except for the upper corner of the breast boundary (white arrow) where an overestimation of the breast tissue thickness caused the dark region.
It is evident that both the detector boundary artifact and glaring artifact strongly degraded the visibility of the breast structures in the boundary areas that were close to the pectoral muscle where the PV images were severely truncated. The correction methods effectively suppress the artifacts and recover the local breast tissue details, as demonstrated by the lymph node located at the upper-right corner of the pectoral muscle on the second slice. The glaring artifacts caused by the truncated pathlengths have been corrected and the reconstructed voxel intensities are similar to those of normal breast tissue. Note that the glaring artifact becomes worse as the DBT slice moves closer to the breast support plate because the error in the pathlengths caused by the truncated imaged volume increases, as shown in Figure 2(c). The appearance of the breast structures in the boundary regions is visually comparable to those in the middle regions after artifact correction. These methods have been applied to a large data set of patient DBT cases that have different breast thicknesses, and similar improvement has been observed.
4. Discussion
The proposed methods reduced the truncation artifacts in iterative SART-based DBT reconstruction. The discontinuities between the boundaries of consecutively processed PVs have been smoothed out and the underestimated x-ray pathlengths have been compensated for with simple geometrical extension to the missing volume. The image quality in these boundary regions becomes comparable to that without truncated projections. It can be seen from the breast phantom results that the line profiles of all test objects become much smoother after the truncation artifact correction and are very similar to those without truncation. Both the CNR and NUEI are substantially improved. In addition, as demonstrated by the DBT patient case, detailed breast structures within the boundary regions can be essentially recovered.
One potential limitation of the intensity equalization strategy is that it is designed to only reduce the detector boundary truncation artifacts on one side of the imaged volume toward which the subsequent PV moves in the SART updating process. This can be understood based on Figure 2(b). When the x-ray source moves from the (n-1)th to the nth PV, a new oblique wedge-shape volume on the right side will be updated and the artifact reduction method smoothes out the discontinuities in the voxel values across the cone-beam boundary, indicated by open crosses. At the same time, the cone-beam FOV of the nth PV leaves another oblique wedge-shape volume to its left uncovered, resulting in new discontinuity generated on the left boundaries, indicated by open stars. However, since the left region has already been updated by previous PV images, the voxels should have attained reasonable values and the discontinuity left behind should be moderate. This is evident from the reconstruction results of the DBT patient case in Figures 7(a) and 10(d) in which only moderate truncation artifacts occurred near the bottom of the breast area.
The intensity equalization strategy will largely eliminate the discontinuity in the situation that only one SART iteration is processed and the imaged volume is initialized by a constant distribution. For situations of multiple iterations and/or non-constant initialization, each oblique wedge-shape volume to be smoothed will contain already updated information from the previous steps, making it difficult to equalize local intensities across the cone-beam boundary. In such a situation, replacing the voxel values with the neighborhood average intensity may not be a good choice, since it will erase all previously attained local information. Moreover, if the relaxation parameter of the second and further iterations is small, this constant extension may dominate the subsequent updating, resulting in new smoothing strip artifact. On the other hand, simply equalizing the average intensities column by column on the two sides of the boundary locally will result in column-wise stripe artifacts due to the varying intensities of the breast tissue. An adaptive, 2D intensity matching (or fitting) strategy may be studied in the future work to evaluate if it can utilize the updated local information and avoid characteristic (structured) artifacts.
The intensity equalization operation is based on a column-wise then slice-wise computation to take into account the newly updated neighborhood region. This ensures that the average is calculated locally and adaptively, and thus efficiently reduces the discontinuity. The replacement operation is restricted to be performed within the oblique wedge-shape volumes only, which varies from one DBT slice to another and from one PV to another. Each oblique wedge-shape volume can be determined easily from the imaging geometry provided that the geometrical parameters of the DBT system are accurately known. The proposed method effectively provides SART with an adaptive initialization to the boundary regions at each updating stage, which is better matched to the neighboring region than the original uniform initialization for the entire imaged volume. This adaptive initialization will not affect the reconstruction results and image quality in the middle regions which are covered and updated by all PVs.
The compensation method for glaring artifacts caused by underestimated pathlengths is simple to implement. Experimental results suggested that the assumption of the missing portion filling the gap between the breast support plate and the compression paddle and being made of “average” breast tissue can give satisfactory correction. However, when these assumptions are not satisfied, the geometrical extension may cause over-correction. This phenomenon takes place most likely at the breast periphery where the breast thickness gradually decreases. The actual pathlength within the breast tissue for an x-ray incident on the breast boundary regions will be shorter than it appears when the breast is assumed to be a rectangular block. If the breast boundary is located in the detector truncation region, the pathlength is indeed underestimated due to cutoff by the imaged volume but not as much as the geometrical extension assumes. This will result in a slight overestimation of the pathlength and thus an underestimation in the x-ray attenuation (voxel values) of the tissue. This is evident in figures 7(e) and 7(f) where the breast boundary areas close to the top of the images have darker pixel intensity after the glaring artifact reduction. On the other hand, the glaring artifact can be reduced by defining a larger imaged volume to include the missing breast tissue. However, the extension of the imaged volume will increase computation time and memory demands, and more importantly, it will only provide similar result as that of our compensation method. The limited information of the missing breast tissue for reconstruction will result in almost uniform distribution that is no better than the assumption of “average” breast tissue.
5. Conclusion
In this study, we have developed artifact reduction methods to address two types of artifacts caused by truncated PV images in iterative reconstruction of breast tomosynthesis mammography. The detector boundary artifacts (reconstruction discontinuity artifacts) are reduced by a local intensity equalization strategy and the glaring artifacts (underestimation of x-ray pathlength) are reduced by a geometrical compensation method. A custom-built breast phantom and a MLO-view DBT patient case were used to evaluate the improvements. The proposed methods enhanced the overall image quality of the truncated regions in the breast phantom study, resulting in much smoother reconstructed distributions, substantial increases in CNR values of the test objects and in uniformity of the reconstructed homogeneous Lucite background. The effect of the artifact reduction method on the sharpness of the object profiles was almost negligible. The obscured breast structures in the artifact-affected region of the patient DBT mammogram were essentially recovered.
Acknowledgments
This work is supported by U. S. Army Medical Research and Materiel Command grant W81XWH 07-1-0324, and USPHS grants CA120234, CA91713 and CA95153. The content of this paper does not necessarily reflect the position of the funding agencies and no official endorsement of any equipment and product of any companies mentioned should be inferred. The digital tomosynthesis system was developed by the GE Global Research Group through the Biomedical Research Partnership (USPHS grant CA91713) collaboration.
References
- 1.Niklason LT, Christian BT, Niklason LE, et al. Digital tomosynthesis in breast imaging. Radiology. 1997;205:399–406. doi: 10.1148/radiology.205.2.9356620. [DOI] [PubMed] [Google Scholar]
- 2.Suryanarayanan S, Karellas A, Vedantham S, et al. Comparison of tomosynthesis methods used with digital mammography. Academic Radiology. 2000;7:1085–1097. doi: 10.1016/s1076-6332(00)80061-6. [DOI] [PubMed] [Google Scholar]
- 3.Wu T, Stewart A, Stanton M, et al. Tomographic mammography using a limited number of low-dose cone-beam projection images. Medical Physics. 2003;30:365–380. doi: 10.1118/1.1543934. [DOI] [PubMed] [Google Scholar]
- 4.Ren B, Ruth C, Stein J, et al. Design and performance of the prototype full field breast tomosynthesis system with selenium based flat panel detector. Proc SPIE. 2005;5745:550–561. [Google Scholar]
- 5.Bissonnette M, Hansroul M, Masson E, et al. Digital breast tomosynthesis using an amorphous selenium flat panel detector. Proc SPIE. 2005;5745:529–540. [Google Scholar]
- 6.Eberhard JW, Staudinger P, Smolenski J, et al. High speed, large angle mammography tomosynthesis system. Proc SPIE. 2006;6142:61420C. [Google Scholar]
- 7.Kopans D. Digital tomosynthesis and other applications. RSNA Program Book 2005. 2005:130. [Google Scholar]
- 8.Rafferty E. Breast Tomosynthesis. RSNA Program Book 2005. 2005:141. [Google Scholar]
- 9.Poplack S, Kogel C, Nagy H. Initial experience with digital breast tomosynthesis in 99 breasts of 98 women with abnormal digital screening mammography. RSNA Program Book 2005. 2005:317. [Google Scholar]
- 10.Moore R, Stewart A, Wu T, et al. Second-generation Digital Breast Tomosynthesis (DBT) in the screening setting: Workflow and preliminary results. RSNA Program Book 2005. 2005:318. [Google Scholar]
- 11.Lo J, Baker J, Orman J, et al. Breast tomosynthesis: Initial clinical experience with 100 human subjects. RSNA Program Book 2006. 2006:335. [Google Scholar]
- 12.Helvie MA, Roubidoux MA, Zhang Y, et al. Tomosynthesis mammography vs conventional mammography: Lesion detection and reader preference. Initial experience. RSNA Program Book 2006. 2006:335. [Google Scholar]
- 13.Helvie MA, Roubidoux MA, Hadjiiski LM, et al. Tomosynthesis Mammography vs Conventional Mammography: Comparison of Breast Masses Detection and Characterization. RSNA Program Book 2007. 2007:381. [Google Scholar]
- 14.Moore RH, Kopans DB, Rafferty EA, et al. Initial Callback Rates for Conventional and Digital Breast Tomosynthesis Mammography Comparison in the Screening Setting. RSNA Program Book 2007. 2007:381. [Google Scholar]
- 15.Dobbins JT, Godfrey DJ. Digital x-ray tomosynthesis: Current state of the art and clinical potential. Physics in Medicine and Biology. 2003;48:R65–R106. doi: 10.1088/0031-9155/48/19/r01. [DOI] [PubMed] [Google Scholar]
- 16.Grant DG. Tomosynthesis: A three-dimensional radiographic imaging technique. IEEE Trans Biomed Eng. 1972;19:20–28. doi: 10.1109/tbme.1972.324154. [DOI] [PubMed] [Google Scholar]
- 17.Kolitsi Z, Panayiotakis G, Anastassopoulus V, et al. A multiple projection method for digital tomosynthesis. Medical Physics. 1992;19:1045–1050. doi: 10.1118/1.596822. [DOI] [PubMed] [Google Scholar]
- 18.Chen Y, Lo JY, Dobbins JT. Importance of point-by-point back projection correction for isocentric motion in digital breast tomosynthesis: Relevance to morphology of structures such as microcalcifications. Medical Physics. 2007;34:3885–3892. doi: 10.1118/1.2776256. [DOI] [PubMed] [Google Scholar]
- 19.Lauritsch G, Haerer W. A theoretical framework for filtered back-projection in tomosynthesis. Proc SPIE. 1998;3338:1127–1137. [Google Scholar]
- 20.Wu T, Moore RH, Rafferty EA, et al. A comparison of reconstruction algorithms for breast tomosynthesis. Medical Physics. 2004;31:2636–2647. doi: 10.1118/1.1786692. [DOI] [PubMed] [Google Scholar]
- 21.Zhang Y, Chan HP, Sahiner B, et al. A comparative study of limited-angle cone-beam reconstruction methods for breast tomosynthesis. Medical Physics. 2006;33:3781–3795. doi: 10.1118/1.223754. [DOI] [PMC free article] [PubMed] [Google Scholar]
- 22.Zhou J, Zhao B, Zhao W. A computer simulation platform for the optimization of a breast tomosynthesis system. Medical Physics. 2007;34:1098–1109. doi: 10.1118/1.2558160. [DOI] [PubMed] [Google Scholar]
- 23.Goddard I, Wu T, Thieret S, et al. Implementing an iterative reconstruction algorithm for digital breast tomosynthesis on graphics processing hardware. Proc SPIE. 2006;6142:61424V. [Google Scholar]
- 24.Wu T, Zhang J, Moore R, et al. Digital tomosynthesis mammography using a parallel maximum-likelihood reconstruction method. Proc SPIE. 2004;5368:1–11. [Google Scholar]
- 25.Zhang Y, Chan HP, Sahiner B, et al. Application of boundary detection information in breast tomosynthesis reconstruction. Medical Physics. 2007;34:3603–3613. doi: 10.1118/1.2761968. [DOI] [PMC free article] [PubMed] [Google Scholar]
- 26.Lewitt RM. Processing of incomplete measurement data in computed tomography. Medical Physics. 1979;6:412–417. doi: 10.1118/1.594519. [DOI] [PubMed] [Google Scholar]
- 27.Ohnesorge B, Flohr T, Schwarz K, et al. Efficient correction for CT image artifacts caused by objects extending outside the scan field of view. Medical Physics. 2000;27:39–46. doi: 10.1118/1.598855. [DOI] [PubMed] [Google Scholar]
- 28.Sourbelle K, Kachelriess M, Kalender WA. Reconstruction from truncated projections in CT using adaptive detruncation. European Radiology. 2005;15:1008–1014. doi: 10.1007/s00330-004-2621-9. [DOI] [PubMed] [Google Scholar]
- 29.Hsieh J, Chao E, Thibault J, et al. A novel reconstruction algorithm to extend the CT scan field-of-view. Medical Physics. 2004;31:2385–2391. doi: 10.1118/1.1776673. [DOI] [PubMed] [Google Scholar]
- 30.Loncaric S, Chang W, Huang G. A processing technique for the truncated projections of asymmetric-fan-beam transmission imaging. IEEE Transactions on Nuclear Science. 1995;42:2292–2297. [Google Scholar]
- 31.Chang W, Loncaric S, Huang G, et al. Asymmetric fan transmission CT on SPECT systems. Physics in Medicine and Biology. 1995;40:913–928. doi: 10.1088/0031-9155/40/5/013. [DOI] [PubMed] [Google Scholar]
- 32.Kunze H, Härer W, Stierstorfer K. Iterative extended field of view reconstruction. Proc SPIE. 2007;6510:65105X. [Google Scholar]
- 33.Li B, Avinasha G, Claus B, et al. 3-D view weighted cone-beam filtered backprojection reconstruction for digital tomosynthesis. Proc SPIE. 2007;6510:65104X. [Google Scholar]
- 34.Andersen AH, Kak AC. Simultaneous algebraic reconstruction technique (SART): a new implementation of the ART algorithm. Ultrason Imaging. 1984;6:81–94. doi: 10.1177/016173468400600107. [DOI] [PubMed] [Google Scholar]
- 35.Andersen AH. Algebraic reconstruction in CT from limited views. IEEE Trans Med Imag. 1989;8:50–55. doi: 10.1109/42.20361. [DOI] [PubMed] [Google Scholar]
- 36.Gordon R, Bender R, Herman GT. Algebraic reconstruction techniques (ART) for three dimensional electron microscopy and X-ray photography. J Theor Biol. 1970;29:471–481. doi: 10.1016/0022-5193(70)90109-8. [DOI] [PubMed] [Google Scholar]
- 37.Herman GT. Image Reconstruction from Projections: The Fundamentals of Computerized Tomography. New York: Academic Press; 1980. [Google Scholar]
- 38.Kak A, Slaney M. Principle of Computerized Tomographic Imaging. New York: IEEE Press; 1988. [Google Scholar]
- 39.Zhang Y, Chan HP, Sahiner B, et al. Breast tomosynthesis reconstruction with simultaneous algebraic reconstruction technique (SART): Effect of access strategy of projection-view images. RSNA Program Book. 2006;130 [Google Scholar]