

Abstract
Objective
We sought to validate three methods for automated safety monitoring by evaluating clinical trials with elevated adverse events.
Methods
An automated outcomes surveillance system was used to retrospectively analyze data from two randomized, TIMI multi-center trials. Trial A was stopped early due to elevated 30 day mortality rates in the intervention arm. Trial B was not stopped early, but there was transient concern regarding 30 day intracranial hemorrhage rates. We compared Statistical Process Control (SPC), Logistic Regression Risk Adjusted SPC (LR-SPC), and Bayesian Updating Statistic (BUS) methods with a standard prospective two-arm event rate analysis. Each method compares observed event rates to alerting boundaries established with previously collected data. In this evaluation, the control arms approximated prior data, and the intervention arms approximated the observed data.
Results
Trial A experienced elevated 30 day mortality rates beginning 7 months after the start of the trial and continuing until termination at month 14. Trial B did not experience elevated major bleeding rates. Combining the alerting performance of each method across both trials resulted in sensitivities and specificities of 100% and 85% for SPC, 0% and 100% for BUS, 100% and 93% for both LR-SPC models, respectively.
Conclusion
Both SPC and LR-SPC methods correctly identified the majority of months during which the cumulative event rates were elevated in Trial A, but were susceptible to false positive alerts in Trial B. The BUS method did not result in any alerts in either Trial and requires revision.
Background
Recent product recalls of both medications and medical devices have highlighted the need for robust improvements in post-marketing surveillance methods.1 While post-marketing clinical outcomes data have become increasingly available in the form of clinical registries and electronic health records, there is no consensus on which continuous monitoring methodologies would be most appropriate for these types of observational cohort data.
There are a number of statistical process control (SPC) techniques used for adverse event surveillance in industrial processes, such as Shewart control charts,2 Exponentially Weighted Moving-Average charts (EWMA), cumulative sum charts (CUSUM), and sequential probability ratio tests (SPRT).3 Until recently, these methods had limited application in the medical environment because of clinical data heterogeneity, which can be found among demographic and clinical characteristics of patients, provider practice variation, non-standard data collection, and missing data elements. While attempts have been made to apply basic SPC methods to medical outcomes surveillance,4–7 these factors require sophisticated risk adjustment and protocols for establishing adverse event rate alerting boundaries that are unnecessary in industrial processes.
Statistical advances in risk adjustment methods and subsequent incorporation of those techniques into some SPC frameworks has facilitated use of these tools in medical outcomes surveillance. There have been some evaluations of these methods among specific clinical domains, such as pediatric and adult cardiac surgery,3, 8, 9 general surgery,10 and interventional cardiology.11 Most of these studies were performed on retrospective clinical registry data, but the results are encouraging for detecting unexpected or elevated adverse event rates among broader applications. However, the full utility of these methods can be found for prospective data monitoring.
We developed a computer application, Data Extraction and Longitudinal Time Analysis (DELTA), that provides both retrospective and prospective outcomes monitoring among new and established medical devices and medications.12 A number of non-risk adjusted and risk adjusted SPC-based methods were developed and adapted for use in this application, and pilot studies using the methods and system have been successfully conducted within a single institution interventional cardiology clinical registry.11–14
However, our methods have not been fully validated. RCT data provide a gold standard for comparison. Any attempt to validate these methods using observational cohort data faces limitations from potential unmeasured confounding. RCT data balances unmeasured confounding between control and intervention arms within the trial design, and using the control arm to provide the baseline or event rate expectations addresses this limitation. In addition, RCT data provides meticulously adjudicated outcomes with independent review by a data safety monitoring board (DSMB) both at set time intervals and after the conclusion of a trial. In this idealized setting, results from a SPC-based method with and without risk adjustment should be approximately the same, which allows flaws in the risk-adjustment unrelated to confounding to be discovered. This also compares baseline accuracy of both types of methods to standard trial statistical analysis and the DSMB findings.
In this study, we sought to validate three SPC-based methods imbedded in an automated monitoring application against a standard of statistical methods employed by DSMBs with randomized controlled trial data. To provide a true positive signal, we selected a trial that was stopped early because of a high rate of adverse events. To provide a true negative signal with a reasonable chance of a false positive alarm, we selected a trial in which adverse event rates were of concern early on but never met the established DSMB stopping rules.
Methods
Clinical Trial Data
Two Thrombolysis In Myocardial Infarction (TIMI) randomized, controlled trials with DSMB monitoring and safety endpoint stopping rules were selected for use in this study.15, 16 Trial A was a multi-center, randomized trial that evaluated the efficacy of an oral platelet glycoprotein antagonist (GP IIb/IIIa inhibitor) versus placebo with regards to a composite primary endpoint of death, myocardial infarction, stroke, or recurrent ischemia at rest leading to re-hospitalization or emergent revascularization at 30 days and 10 months post-randomization. A total of 10,288 patients were enrolled in the study within three arms: 3421 in the placebo arm, 3,330 in the active treatment arm with sustained dosing, and 3,537 in the active treatment arm with reduced dosing after the first thirty days. The primary safety endpoints for the trial were all-cause mortality or severe or life-threatening bleeding, defined as intracranial hemorrhage or bleeding associated with severe hemodynamic compromise, a drop in hematocrit by 15% or more, or requiring a blood transfusion. The trial was terminated by the DSMB before the goal of 12,000 patients was reached due to an increase in the 30-day mortality in the reduced dose treatment arm.15
Trial B was a multi-center, randomized trial that evaluated the efficacy of an oral anti-platelet agent versus placebo in combination with fibrinolytic therapy in ST elevation myocardial infarction with regards to a composite primary endpoint of an occluded infarct-related artery by angiography, or death or recurrent myocardial infarction in the absence of angiography. A total of 3,491 patients were enrolled in the study: 1,739 in the control arm, and 1,751 in the treatment arm. The primary safety endpoint was TIMI major bleeding, of which intracranial hemorrhage was a component.17 The trial operations committee became concerned with the rates of intracranial bleeding and major bleeding early in the trial based upon aggregated blinded data, but neither safety outcome reached DSMB stopping criteria during the trial. This study was approved by the Brigham & Women’s Institutional Review Board.
Statistical Methodologies
Three statistical methods were used to assess for deviation from acceptable safety benchmarks during this evaluation. These include both a non-risk adjusted and risk-adjusted SPC method based upon Shewart control charts. The third method is a non-risk adjusted Bayesian adaptation of Shewart control charts. These methods are reviewed in brief below, and are more fully described elsewhere.12
All of the methods use four values in each time period in order to calculate whether or not generate an alert. These values are: observed number of events, observed number of cases, expected number of events, and expected number of cases. A limitation of standard Shewart control charts is that the observed number of cases (sample size) is ignored, since the observed value is only represented as a proportion or point estimate. This can result in alerting insensitivity, particularly in cumulative analyses where the values for each observed period are the sum of all the period observed periods and the current period. We addressed this by adapting each of the methods to generate the alert threshold using the Wilson’s method for comparing independent proportions. 24
Statistical Process Control (SPC)
This method is an adaptation (as described above) of standard non-risk adjusted Shewart control charts to provide cumulative event rate monitoring in which adverse events and total cases are aggregated and analyzed in pre-defined time periods. This method is most appropriate under unchanging conditions where deviations from an established norm need to be detected, and is very reliable for these purposes.2
Logistic Regression Adjusted Statistical Process Control (LR-SPC)
Logistic regression adjusted SPC18 is an experimental methodology that incorporates our Shewart control chart adaptation with logistic regression (LR), a modeling technique that estimates the probability of an outcome on case-level basis. A LR model is developed from the available baseline data, and validated by resampling methods or external data sets. The model is then applied to the observed data, and the model outcome probabilities are considered the expected (baseline) number of events. This incorporates risk adjustment into the method by allowing the expected event rate to change over time with the composition of the observed cases.
However, the limitations of this method are those inherent in LR modeling in general. The levels of discrimination and calibration of the model on the baseline data are not guaranteed to remain the same even on closely related subsequent populations. While discrimination is generally retained across different patient populations, calibration can vary, which may directly impact monitoring results.19
Bayesian Updating Statistics (BUS)
Bayesian Updating Statistics (BUS) is an experimental methodology pioneered in nuclear power safety monitoring.20 We developed this method by incorporating Bayesian statistics21 into a traditional SPC framework by utilizing prior observed data to evolve the estimates of risk.22 The incorporation of previously observed information into the expected data allows the method to be very sensitive for detecting reversal of trends and sudden, large changes in event rates. However, a slow drift (either elevation or depression) of the observed event rate can be missed.13 This method partially addresses the limitation in changing conditions in SPC, and is best suited to detecting changes after an incremental change (such as a medication or device) is introduced. However, this method should be considered non-risk adjusted since individual patient conditions and exposures are not considered in establishing the alerting threshold.
Automated Monitoring Tool
We have previously described an automated real-time safety monitoring tool, Data Extraction and Longitudinal Time Analysis (DELTA), that is able to perform an arbitrary number of concurrent prospective analyses using statistical methodologies (SPC, BUS, LR-SPC) and alerting thresholds.12 The system uses a SQL 2000 server (Microsoft Corp., Redmond, WA) to provide internal data storage and configuration information, as well as providing the capability to integrate with external databases. The user interface is displayed in a web browser from a Microsoft IIS 5.0 Web Server Microsoft Corp., Redmond, WA).
The system is currently in operation within the Partners Healthcare intranet, a secure multi-hospital network. Security of patient data is further addressed by record de-identification steps23 and user login access restrictions. DELTA is part of ongoing quality assessment and control measures within the institution.
Data Analysis
Both sets of trial data were imported into DELTA, and then SPC, LR-SPC, and BUS analyses were configured to evaluate the outcomes of interest in monthly intervals. These outcomes were the primary safety endpoints of the trials, which were 30 day mortality for Trial A and major bleeding for Trial B. The gold standard of whether the appropriate safety endpoint event rate in each trial was elevated in a particular month was determined using standard DSMB analysis methods. This was calculated using the Fisher’s exact test applied to the cumulative control and intervention data on a monthly basis for each outcome of interest in both trials. The proportional difference method with 95% confidence intervals was used to establish alert thresholds for the same sets of cumulative data in order to compare performance with Fisher’s exact method.
Each of the statistical methods used by DELTA requires a baseline event rate expectation to establish alerting thresholds, and this data is generally obtained from observational cohort data prior to the initiation of a new medication or device. In order to simulate this environment with randomized, controlled trial data, the control arms were used for this baseline measurement, and the intervention arms were used as the monitored prospective observational cohort. This resulted in all of the control arm data being available at the “beginning” of the intervention arm monitoring. The reduced dosage treatment arm in Trial A was utilized for the intervention arm since that was the arm for which the DSMB stopped the trial.
The SPC alerting threshold is static, the LR-SPC alerting threshold was adjusted in each analyzed time period by the model predicted event rate of the observed (intervention) data, and the BUS alerting threshold was adjusted in each analyzed time period by the observed event rate of the observed (intervention) data. Monthly time intervals and 95% confidence intervals or posterior credible intervals were used for each analysis in this study.24 Overall sensitivity and specificity of the methods can be ‘tuned’ by adjusting the alerting threshold, but the emphasis in this evaluation was to determine relative performance between the methods for a standard threshold set point.
LR-SPC required the development of a logistic regression model in order to perform case-level risk adjustment. A literature search was conducted to identify risk factors for each of the outcomes of interest in the trials, and all such factors that were associated with the respective outcome of interest were included in the LR model development process. Model development was done in SAS (Version 9.1, Cary, NC). The models were evaluated for discrimination with the Area Under the ROC Curve (AUC) and calibration with the Hosmer-Lemeshow goodness-of-fit (HL-GOF) deciles test using 10-fold cross-validation.25, 26
Accuracy of each method for detecting elevated event rates were calculated by comparing whether each method alerted or not compared to the standard trial analysis. There were a total of 14 months in Trial A and 21 months in Trial B resulting in 35 values (alert / not-alert) for each method. The results in each month for both trials were aggregated together to determine overall sensitivity (defined as the true positives divided by the sum of true positive and false negatives) and specificity (defined as the true negatives divided by the sum of true negatives and false positives).
The cross-validation results for the logistic regression models developed from the Trial A control arm data were an AUC of 0.67 [0.59 – 0.75] and a HL-GOF of 8.82 (p = 0.358) for a variable selection threshold of 0.01, and an AUC of 0.70 [0.62 – 0.78] and a HL-GOF of 8.38 (p = 0.397) for a threshold of 0.20. The cross-validation results for the logistic regression models developed from the Trial B control arm data were an AUC of 0.79 [0.73 – 0.86] and a HL-GOF of 15.7 (p = 0.047) for a threshold of 0.01, and an AUC of 0.80 [0.74 – 0.87] and a HL-GOF of 10.5 (p = 0.230) for a threshold of 0.20.
Results
Significant differences for the outcome of all-cause death at 30 days in Trial A were noted between the control arm and the reduced treatment arm from month 7 until the trial’s early termination at month 14. A summary of the event rates of each arm and p values by month are listed in Table 1. The SPC monitoring method also reported significant event rate elevations in months 7 through 14 (Figure 1a). The BUS method, however, did not report any intervention arm event rate elevations during monitoring. The LR-SPC method using a model building threshold of 0.01 reported elevations in months 7 through 14 (Figure 1b), and reported elevations in months 6 through 14 for a model building threshold of 0.20 (Figure 1c). A summary of the Trial A proportional difference results for each of the monitoring methods by month are shown in Appendix 1.
Table 1.
Trial A Fisher’s Exact Test Method – Death @ 30 Days for Intervention Arm B. Cumulative Enrollment and Events
| Control (Expected) | Intervention Arm B (Observed) | ||||||
|---|---|---|---|---|---|---|---|
| Period | Events | Patients | Event Rate (%) |
Events | Patients | Event Rate (%) |
p |
| 1 | 0 | 0 | 0.0 | 0 | 5 | 0.0 | * |
| 2 | 0 | 17 | 0.0 | 0 | 16 | 0.0 | * |
| 3 | 0 | 48 | 0.0 | 1 | 52 | 1.9 | 1.000 |
| 4 | 0 | 135 | 0.0 | 4 | 131 | 3.1 | 0.122 |
| 5 | 1 | 268 | 0.4 | 6 | 279 | 2.2 | 0.124 |
| 6 | 4 | 463 | 0.9 | 12 | 486 | 2.5 | 0.078 |
| 7 | 5 | 764 | 0.7 | 21 | 794 | 2.6 | 0.003 |
| 8 | 8 | 1,089 | 0.7 | 30 | 1,118 | 2.7 | <0.001 |
| 9 | 11 | 1,412 | 0.8 | 36 | 1,459 | 2.5 | <0.001 |
| 10 | 16 | 1,805 | 0.9 | 50 | 1,882 | 2.7 | <0.001 |
| 11 | 21 | 2,173 | 1.0 | 59 | 2,277 | 2.6 | <0.001 |
| 12 | 33 | 2,701 | 1.2 | 66 | 2,824 | 2.3 | 0.003 |
| 13 | 46 | 3,360 | 1.4 | 81 | 3,470 | 2.3 | 0.005 |
| 14 | 46 | 3,421 | 1.3 | 81 | 3,537 | 2.3 | 0.005 |
Figure 1.
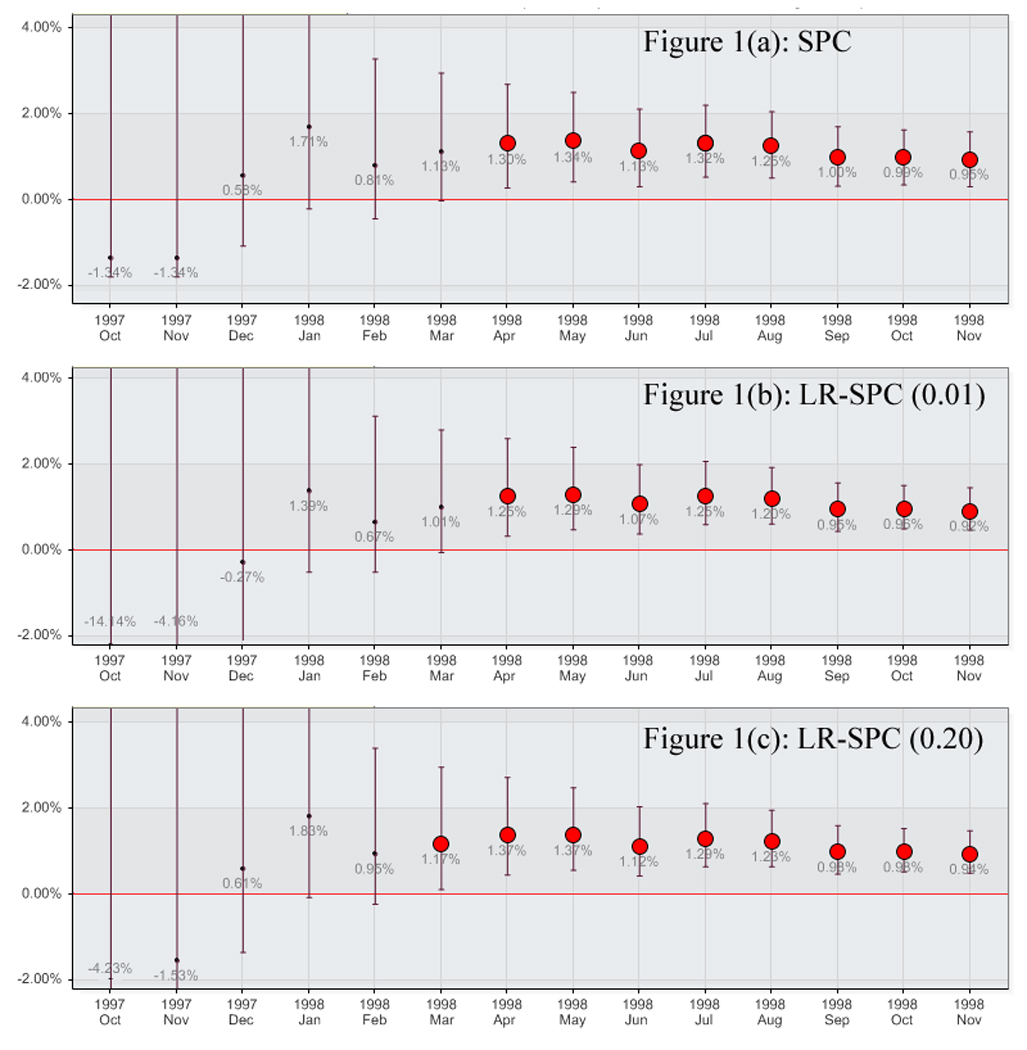
Trial A Mortality for Treatment Arm B by method. A) Statistical Process Control, B) Logistic Regression Adjusted Statistical Process Control (0.01), and C) Logistic Regression Adjusted Statistical Process Control (0.20)
Appendix 1.
Proportional Difference Method Observed & Expected Trial A Death. Bold = Alert
| Period | Prospective Alert % Difference [95% CI] |
SPC Alert % Difference [95% CI] |
BUS Alert % Difference [95% CI] |
LR-SPC (0.01) Alert % Difference [95% CI] |
LR-SPC (0.20) Alert % Difference [95% CI] |
|---|---|---|---|---|---|
| 1 | --- | −1.3 [−1.8 – 54.8] | 0.0 [−0.6 – 0.6] | −14.1 [−49.5 – 42.4] | −4.2 [−49.2 – 52.0] |
| 2 | 0.0 [−18.4 – 11.4] | −1.3 [−1.8 – 18.0] | 0.0 [−0.6 – 0.6] | −4.2 [−9.8 – 15.2] | −1.5 [−7.2 – 17.8] |
| 3 | 1.9 [−18.4 – 19.4] | 0.6 [−1.1 – 8.8] | 0.0 [−0.5 – 0.6] | −0.3 [−2.3 – 7.9] | 0.6 [−1.3 – 8.8] |
| 4 | 3.1 [−0.3 – 7.6] | 1.7 [−0.2 – 6.3] | 0.1 [−0.5 – 0.6] | 1.4 [−0.5 – 5.9] | 1.8 [−0.1 – 6.4] |
| 5 | 1.8 [−0.3 – 4.3] | 0.8 [−0.4 – 3.3] | 0.1 [−0.5 – 0.6] | 0.7 [−0.5 – 3.1] | 1.0 [−0.2 – 3.4] |
| 6 | 1.6 [−0.1 – 3.5] | 1.1 [−0.1 – 3.0] | 0.1 [−0.4 – 0.7] | 1.0 [−0.1 – 2.8] | 1.2 [0.1 – 3.0] |
| 7 | 2.0 [0.7 – 3.4] | 1.3 [0.3 – 2.7] | 0.3 [−0.3 – 0.8] | 1.3 [0.3 – 2.6] | 1.4 [0.5 – 2.7] |
| 8 | 2.0 [0.9 – 3.1] | 1.3 [0.4 – 2.5] | 0.3 [−0.2 – 0.9] | 1.3 [0.5 – 2.4] | 1.4 [0.6 – 2.5] |
| 9 | 1.7 [0.8 – 2.7] | 1.1 [0.3 – 2.1] | 0.3 [−0.2 – 0.9] | 1.1 [0.4 – 2.0] | 1.1 [0.4 – 2.1] |
| 10 | 1.8 [0.9 – 2.7] | 1.3 [0.5 – 2.2] | 0.5 [−0.1 – 1.0] | 1.3 [0.6 – 2.1] | 1.3 [0.7 – 2.1] |
| 11 | 1.6 [0.9 – 2.4] | 1.3 [0.5 – 2.1] | 0.5 [−0.1 – 1.0] | 1.2 [0.6 – 1.9] | 1.2 [0.7 – 2.0] |
| 12 | 1.1 [0.4 – 1.8] | 1.0 [0.3 – 1.7] | 0.5 [−0.1 – 1.0] | 1.0 [0.5 – 1.6] | 1.0 [0.5 – 1.6] |
| 13 | 1.0 [0.3 – 1.6] | 1.0 [0.4 – 1.6] | 0.5 [−0.1 – 1.0] | 1.0 [0.5 – 1.5] | 1.0 [0.5 – 1.5] |
| 14 | 1.0 [0.3 – 1.6] | 1.0 [0.3 – 1.6] | 0.5 [−0.1 – 1.0] | 0.9 [0.5 – 1.5] | 1.0 [0.5 – 1.5] |
No significant differences for the outcome of major bleeding at 30 days were noted between the control and intervention arms in Trial B. Month 8 was the period in which the event rate of the intervention arm was the most elevated in relation to the control arm with a p value of 0.262. A summary of the event rates for each arm with p values by month are listed in Table 2. The SPC monitoring method did generate alerts for months 7 through 9 and 11 (Figure 2a). BUS did not generate any alerts. The LR-SPC method using a model building threshold of 0.01 reported elevations in months 7 and 14 (Figure 2b), and reported an elevation in month 7 for a model building threshold of 0.20 (Figure 2c). A summary of the Trial B proportional difference results for each of the monitoring methods by month are shown in Appendix 2.
Table 2.
Trial B Fisher’s Exact Test Method – Major Bleeding @ 30 Days. Cumulative Enrollment and Events. Shaded Period was the closest to significance.
| Control | Intervention | ||||||
|---|---|---|---|---|---|---|---|
| Period | Events | Patients | Event Rate (%) |
Events | Patients | Event Rate (%) |
p |
| 1 | 0 | 4 | 0.0 | 0 | 1 | 0.0 | * |
| 2 | 0 | 13 | 0.0 | 0 | 12 | 0.0 | * |
| 3 | 1 | 27 | 3.7 | 0 | 23 | 0.0 | 1.000 |
| 4 | 2 | 40 | 5.0 | 1 | 49 | 2.0 | 0.586 |
| 5 | 2 | 73 | 2.7 | 2 | 83 | 2.4 | 1.000 |
| 6 | 3 | 116 | 2.6 | 5 | 126 | 4.0 | 0.724 |
| 7 | 4 | 168 | 2.4 | 7 | 173 | 4.0 | 0.548 |
| 8 | 4 | 214 | 1.9 | 9 | 226 | 4.0 | 0.262 |
| 9 | 7 | 276 | 2.5 | 10 | 284 | 3.5 | 0.624 |
| 10 | 8 | 337 | 2.4 | 12 | 361 | 3.3 | 0.502 |
| 11 | 10 | 424 | 2.4 | 15 | 450 | 3.3 | 0.423 |
| 12 | 11 | 536 | 2.1 | 16 | 554 | 2.9 | 0.438 |
| 13 | 13 | 639 | 2.0 | 18 | 649 | 2.8 | 0.468 |
| 14 | 17 | 776 | 2.2 | 22 | 780 | 2.8 | 0.517 |
| 15 | 17 | 892 | 1.9 | 23 | 926 | 2.5 | 0.427 |
| 16 | 18 | 1,041 | 1.7 | 28 | 1,058 | 2.6 | 0.180 |
| 17 | 20 | 1,192 | 1.7 | 31 | 1,195 | 2.6 | 0.156 |
| 18 | 24 | 1,314 | 1.8 | 31 | 1,327 | 2.3 | 0.414 |
| 19 | 25 | 1,457 | 1.7 | 31 | 1,459 | 2.1 | 0.500 |
| 20 | 26 | 1,584 | 1.6 | 32 | 1,606 | 2.0 | 0.509 |
| 21 | 30 | 1,739 | 1.7 | 34 | 1,751 | 1.9 | 0.706 |
Figure 2.
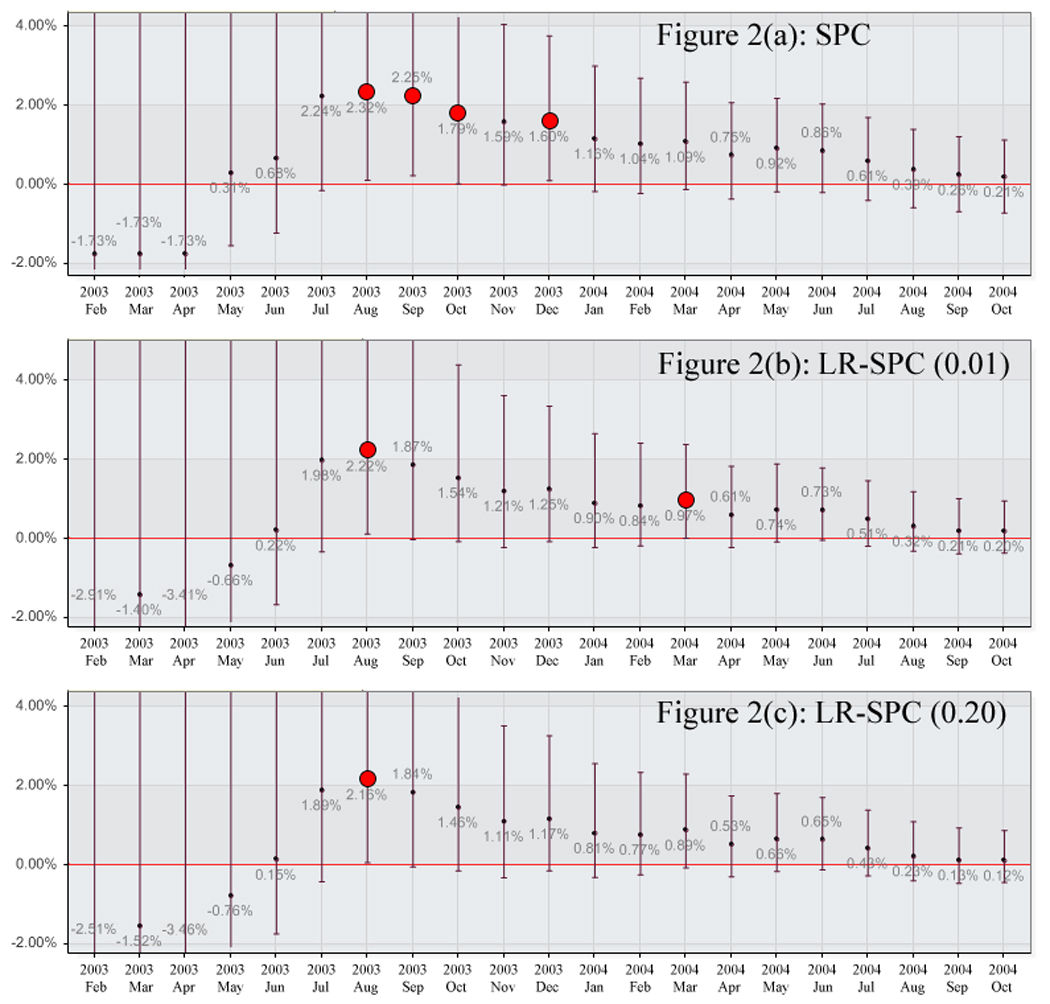
Trial B Major Bleeding for Intervention Arm by method. A) Statistical Process Control, B) Logistic Regression Adjusted Statistical Process Control (0.01), and C) Logistic Regression Adjusted Statistical Process Control (0.20)
Appendix 2.
Proportional Difference Method Observed & Expected Trial B Bleeding. Bold = Alert
| Period | Prospective Alert % Difference [95% CI] |
SPC Alert % Difference [95% CI] |
BUS Alert % Difference [95% CI] |
LR-SPC (0.01) Alert % Difference [95% CI] |
LR-SPC (0.20) Alert % Difference [95% CI] |
|---|---|---|---|---|---|
| 1 | 0.0 [−49.0 – 79.4] | −1.7 [−2.5 – 77.6] | −1.7 [−2.4 – 77.6] | −2.9 [−80.5 – 76.5] | −2.5 [−80.4 – 76.9] |
| 2 | 0.0 [−22.8 – 24.3] | −1.7 [−2.5 – 22.5] | −1.7 [−2.4 – 22.5] | −1.4 [−9.7 – 22.9] | −1.5 [−9.8 – 22.7] |
| 3 | −3.7 [−18.3 – 10.9] | −1.7 [−2.5 – 12.6] | −1.7 [−2.4 – 12.6] | −3.4 [−7.2 – 10.9] | −3.5 [−7.2 – [10.9] |
| 4 | −3.0 [−14.6 – 6.4] | 0.3 [−1.5 – 9.0] | 0.3 [−1.5 – 9.0] | −0.7 [−2.8 – 8.0] | −0.8 [−2.9 – 7.9] |
| 5 | −0.3 [−7.3 – 6.0] | 0.7 [−1.2 – 6.7] | 0.7 [−1.2 – 6.6] | 0.2 [−1.7 – 6.2] | 0.2 [−1.7 – 6.1] |
| 6 | 1.4 [−3.9 – 6.7] | 2.2 [−0.1 – 7.3] | 2.1 [−0.3 – 7.1] | 2.0 [−0.3 – 7.0] | 1.9 [−0.4 – 6.9] |
| 7 | 1.7 [−2.5 – 6.0] | 2.3 [0.1 – 6.4] | 2.1 [−0.1 – 6.2] | 2.2 [0.1 – 6.3] | 2.2 [0.1 – 6.2] |
| 8 | 2.1 [−1.3 – 5.7] | 2.3 [0.2 – 5.7] | 2.0 [0.0 – 5.5] | 1.9 [0.0 – 5.3] | 1.8 [0.0 – 5.3] |
| 9 | 1.0 [−2.1 – 4.1] | 2.3 [0.2 – 5.7] | 1.5 [−0.2 – 4.4] | 1.5 [−0.1 – 4.4] | 1.5 [−0.1 – 4.3] |
| 10 | 1.0 [−1.7 – 3.6] | 1.6 [0.0 – 4.0] | 1.3 [−0.3 – 3.8] | 1.2 [−0.2 – 3.6] | 1.1 [−0.3 – 3.5] |
| 11 | 1.0 [−1.4 – 3.3] | 1.6 [0.1 – 3.8] | 1.3 [−0.2 – 3.4] | 1.3 [−0.1 – 3.3] | 1.2 [−0.1 – 3.3] |
| 12 | 0.8 [−1.1 – 2.8] | 1.2 [−0.2 – 3.0] | 0.9 [−0.4 – 2.7] | 0.9 [−0.2 – 2.7] | 0.8 [−0.3 – 2.6] |
| 13 | 0.7 [−1.0 – 2.5] | 1.0 [−0.2 – 2.7] | 0.8 [−0.4 – 2.4] | 0.8 [−0.2 – 2.4] | 0.8 [−0.2 – 2.3] |
| 14 | 0.6 [−1.0 – 2.3] | 1.1 [−0.1 – 2.6] | 0.8 [−0.4 – 2.3] | 1.0 [0.0 – 2.4] | 0.9 [−0.1 – 2.3] |
| 15 | 0.6 [−0.8 – 2.0] | 0.8 [−0.4 – 2.1] | 0.5 [−0.5 – 1.8] | 0.6 [−0.2 – 1.8] | 0.5 [−0.3 – 1.8] |
| 16 | 0.9 [−0.4 – 2.2] | 0.9 [−0.2 – 2.2] | 0.6 [−0.4 – 1.8] | 0.7 [−0.1 – 1.9] | 0.7 [−0.2 – 1.8] |
| 17 | 0.9 [−0.3 – 2.1] | 0.9 [−0.2 – 2.0] | 0.5 [−0.5 – 1.7] | 0.7 [0.0 – 1.8] | 0.7 [−0.1 – 1.7] |
| 18 | 0.5 [−0.6 – 1.6] | 0.6 [−0.4 – 1.7] | 0.4 [−0.5 – 1.4] | 0.5 [−0.2 – 1.5] | 0.4 [−0.3 – 1.4] |
| 19 | 0.4 [−0.6 – 1.4] | 0.4 [−0.6 – 1.4] | 0.2 [−0.6 – 1.2] | 0.3 [−0.3 – 1.2] | 0.2 [−0.4 – 1.1] |
| 20 | 0.4 [−0.6 – 1.3] | 0.3 [−0.7 – 1.2] | 0.1 [−0.6 – 1.0] | 0.2 [−0.4 – 1.0] | 0.1 [−0.5 – 0.9] |
| 21 | 0.2 [−0.7 – 1.1] | 0.2 [−0.7 – 1.1] | 0.1 [−0.6 – 1.0] | 0.2 [−0.4 – 1.0] | 0.1 [−0.4 – 0.9] |
Aggregating the results of both trials for each method as compared to the trial analysis standard resulted in a sensitivities and specificities of 100% and 85% for SPC, 0% and 100% for BUS, 100% and 93% for both LR-SPC models, respectively. A summary of the 2×2 table elements are listed in Table 3.
Table 3.
Summary of performance by method for both trials. TP = True Positive, FP = False Positive, FN = False Negative, TN = True Negative, SPC = Statistical Process Control, BUS = Bayesian Updating Statistics, LR-SPC = Logistic Regression adjusted SPC.
| Method | TP | FP | FN | TN | Sensitivity | Specificity |
|---|---|---|---|---|---|---|
| SPC | 8 | 4 | 0 | 23 | 100% | 85% |
| BUS | 0 | 0 | 8 | 27 | 0% | 100% |
| LR-SPC (0.01) | 8 | 2 | 0 | 25 | 100% | 93% |
| LR-SPC (0.20) | 8 | 2 | 0 | 25 | 100% | 93% |
Discussion
This study evaluated non-risk adjusted and risk adjusted statistical process control methods for detecting elevated adverse event rates among randomized controlled trial data. Both SPC and LR-SPC performed well and were comparable to each other. However, BUS was significantly over-specific and did not alert in any month in either trial.
The proportional difference test was validated by comparison with Fisher’s exact test and the results were concordant in both trials analyzed. The SPC method alerted properly in each of the months identified by Fisher’s method for the Trial A data, and did alert in 4 months in the Trial B data in which the Fisher’s method did not find a significant difference. The LR-SPC method alerted appropriately with the exception of one false positive in Trial A (for the 0.20 model threshold) and one false positive alert in Trial B (both thresholds). The BUS method did not alert any during either trial, resulting in false negatives in Trial A.
Substantially different performance was found between SPC and BUS. The SPC method was consistently more sensitive and the BUS method was more specific. The performance of both methods is sensitive to the data used in establishing the expected event rates and alerting thresholds. Theoretically, as the n (number of subjects) of the baseline data increases, SPC becomes more sensitive and BUS becomes less sensitive (and more specific) to event rate deviations in the monitored data. Conversely, BUS should more rapidly detect an event rate difference than SPC for sparse or low volumes of baseline data, and this has been shown in other monitoring applications.27, 28 The clinical trials evaluated here had large numbers of control patients in order to appropriately evaluate the primary outcomes, and this could have favored the SPC method in this analysis. A sensitivity analysis between the performance of SPC and BUS for large ranges of n is ongoing in order to determine relative performance between the methods, and we are currently evaluating an alternate BUS alerting threshold using the percentage overlap of the area under the probability density function.
LR-SPC, unlike SPC and BUS, is not directly sensitive to the n of the baseline data because the alerting threshold is generated from the predicted event rate of the observed data, which results in the n used to generate the alerting threshold being equal to n of the observed data. LR-SPC is sensitive to the performance of the logistic regression model used, and such models are more robust when generated from larger data sets.
In this evaluation, LR-SPC performed in a comparable manner to the SPC method. However, this result should be interpreted as LR-SPC performing in a non-inferior way to SPC in the absence of confounding in the evaluated data. This is a useful finding because it supports the use of the methodology, but it does not provide an evaluation of the method’s risk adjustment efficacy. Further work needs to be performed to establish the relative performance between SPC and LR-SPC using observational cohort data.
There are a number of limitations to this study. The control group data in both trials were accumulated concurrently and in a randomized fashion with the intervention data. However, in order to evaluate the system, the control data was assumed to be collected prior to the intervention data. This allows direct comparison of methods, but may result in over-optimistic performance measurements when such methods are applied to a prospective patient cohort, which experiences shifts in patient case-mix and provider behavior over time. In addition, all of the methods used perform serial evaluations of the data, which can increase the false positive alerting rate. However, these methods are intended for screening large numbers of outcomes for a wide variety of medications and medical devices within an automated application. Such surveillance emphasizes early detection and accepts lower sensitivity for additional specificity in this setting. Because of this, in-depth manual review of identified signals must then be performed in order to determine whether the signal is a true positive. Additional work will be required to satisfactorily adjust the sensitivity and specificity of the alerts to a manageable rate for manual review of the results from this application.
These methods are intended for use in prospective observational cohort surveillance within a health care environment, whether it is one hospital or a network of hospitals and outpatient clinics. Once a surveillance methodology is validated and established, selection of the baseline or expected data becomes critical for risk adjustment purposes and defines the nature of any resulting alerts. For example, a medical product just released to market could use phase 3 trial data as a baseline, which would evaluate whether the observed population experienced safety outcomes in excess of that reference group. However, such trials are well-known to recruit healthy patients, and sample sizes are generally low. Alternatively, outcome data from a closely related product with the same indication could be collected in the local environment for this purpose. This has the benefit of a larger sample size and could allow more granular data collection (since data elements in phase 3 trial data are expensive to collect) but might also suffer from missing data or collection, recall, or other biases. Further work must be done in this area to establish data selection hierarchies and protocols in order to inform such a process.
In conclusion, the SPC and LR-SPC methods performed well when evaluating randomized controlled trial data for significant safety event rate elevations. For monitoring where large amounts of data are available to provide the expected event rate (and threshold), SPC and LR-SPC appear to outperform BUS monitoring. Further work is required to establish risk adjustment performance in the LR-SPC method, and to establish BUS performance for event rate monitoring in conditions with sparse prior data or when highly variable trends in safety are present.
Acknowledgements
The authors would like to thank Anne Fladger and her library staff for their assistance. This study was funded in part by grants T15-LM-007092, R01-LM-008142, and R01-LM-009520 from the National Library of Medicine of the National Institutes of Health.
References
- 1.Fontanarosa PB, Rennie D, DeAngelis CD. Postmarketing Surveillance--Lack of Vigilance, Lack of Trust. JAMA. 2004;292(21):2647–2650. doi: 10.1001/jama.292.21.2647. [DOI] [PubMed] [Google Scholar]
- 2.Wheeler DJ, Chambers DS. Understanding Statistical Process Control. 2 ed. Knoxville, TN: SPC Press; 1992. [Google Scholar]
- 3.Spiegelhalter D, Grigg O, Kinsman R, Treasure T. Risk-adjusted sequential probability ratio tests: applications to Bristol, Shipman and adult cardiac surgery. Int J Qual Health Care. 2003;15(1):7–13. doi: 10.1093/intqhc/15.1.7. [DOI] [PubMed] [Google Scholar]
- 4.Shahian DM, Williamson WA, Svensson LG, Restuccia JD, D'Agostino RS. Applications of statistical quality control to cardiac surgery. The Annals of Thoracic Surgery. 1996;62(5):1351. doi: 10.1016/0003-4975(96)00796-5. [DOI] [PubMed] [Google Scholar]
- 5.Mohammed MA, Cheng KK, Rouse A, Marshall T. Bristol, Shipman, and clinical governance: Shewhart's forgotten lessons. The Lancet. 2001;357(9254):463. doi: 10.1016/s0140-6736(00)04019-8. [DOI] [PubMed] [Google Scholar]
- 6.G. David Williamson GWH. A monitoring system for detecting aberrations in public health surveillance reports. Statistics in Medicine. 1999;18(23):3283–3298. doi: 10.1002/(sici)1097-0258(19991215)18:23<3283::aid-sim316>3.0.co;2-z. [DOI] [PubMed] [Google Scholar]
- 7.Clark DE, Cushing BM, Bredenberg CE. Monitoring Hospital Trauma Mortality Using Statistical Process Control Methods. Journal of the American College of Surgeons. 1998;186(6):630. doi: 10.1016/s1072-7515(98)00109-4. [DOI] [PubMed] [Google Scholar]
- 8.Rogers CA, Ganesh JS, Banner NR, Bonser RS. Cumulative risk adjusted monitoring of 30-day mortality after cardiothoracic transplantation: UK experience. Eur J Cardiothorac Surg. 2005;27(6):1022–1029. doi: 10.1016/j.ejcts.2005.02.033. [DOI] [PubMed] [Google Scholar]
- 9.Grigg OA, Farewell VT, Spiegelhalter DJ. Use of risk-adjusted CUSUM and RSPRT charts for monitoring in medical contexts. Stat Methods Med Res. 2003;12(2):147–170. doi: 10.1177/096228020301200205. [DOI] [PubMed] [Google Scholar]
- 10.Steiner SH, Cook RJ, Farewell VT, Treasure T. Monitoring surgical performance using risk-adjusted cumulative sum charts. Biostatistics. 2000;1(4):441–452. doi: 10.1093/biostatistics/1.4.441. [DOI] [PubMed] [Google Scholar]
- 11.Matheny ME, Ohno-Machado L, Resnic FS. Risk-adjusted sequential probability ratio test control chart methods for monitoring operator and institutional mortality rates in interventional cardiology. Am Heart J. 2008;155(1):114–120. doi: 10.1016/j.ahj.2007.08.022. Epub 2007 Oct 2017. [DOI] [PubMed] [Google Scholar]
- 12.Matheny ME, Ohno-Machado L, Resnic FS. Monitoring device safety in interventional cardiology. J Am Med Inform Assoc. 2006;13(2):180–187. doi: 10.1197/jamia.M1908. Epub 2005 Dec 2015. [DOI] [PMC free article] [PubMed] [Google Scholar]
- 13.Matheny ME. Development of Statistical Methodologies and Risk Models to Perform Real-Time Safety Monitoring in Interventional Cardiology [Master of Science Thesis] Cambridge: Health Sciences & Technology, Massachusetts Institute of Technology; 2006. [Google Scholar]
- 14.Matheny ME, Arora N, Ohno-Machado L, Resnic FS. Rare Adverse Event Monitoring of Medical Devices with the Use of an Automated Surveillance Tool. AMIA Annu Symp Proc. 2007:518–522. [PMC free article] [PubMed] [Google Scholar]
- 15.Cannon CP, McCabe CH, Wilcox RG, Langer A, Caspi A, Berink P, Lopez-Sendon J, Toman J, Charlesworth A, Anders RJ, Alexander JC, Skene A, Braunwald E. Oral glycoprotein IIb/IIIa inhibition with orbofiban in patients with unstable coronary syndromes (OPUS-TIMI 16) trial. Circulation. 2000;102(2):149–156. doi: 10.1161/01.cir.102.2.149. [DOI] [PubMed] [Google Scholar]
- 16.Sabatine MS, Cannon CP, Gibson CM, Lopez-Sendon JL, Montalescot G, Theroux P, Claeys MJ, Cools F, Hill KA, Skene AM, McCabe CH, Braunwald E. Addition of clopidogrel to aspirin and fibrinolytic therapy for myocardial infarction with ST-segment elevation. N Engl J Med. 2005;352(12):1179–1189. doi: 10.1056/NEJMoa050522. Epub 2005 Mar 1179. [DOI] [PubMed] [Google Scholar]
- 17.Bovill EG, Terrin ML, Stump DC, Berke AD, Frederick M, Collen D, Feit F, Gore JM, Hillis LD, Lambrew CT, et al. Hemorrhagic events during therapy with recombinant tissue-type plasminogen activator, heparin, and aspirin for acute myocardial infarction. Results of the Thrombolysis in Myocardial Infarction (TIMI), Phase II Trial. Ann Intern Med. 1991;115(4):256–265. doi: 10.7326/0003-4819-115-4-256. [DOI] [PubMed] [Google Scholar]
- 18.Hosmer D, Lemeshow S. Applied Logistic Regression. 2 ed. San Francisco: Jossey-Bass; 2000. [Google Scholar]
- 19.Matheny ME, Ohno-Machado L, Resnic FS. Discrimination and calibration of mortality risk prediction models in interventional cardiology. J Biomed Inform. 2005;38(5):367–375. doi: 10.1016/j.jbi.2005.02.007. Epub 2005 Mar 2026. [DOI] [PubMed] [Google Scholar]
- 20.Siu N, Apostolakis G. Modeling the detection rates of fires in nuclear plants: development and application of a methodology for treating imprecise evidence. Risk Anal. 1986;6(1):43–59. doi: 10.1111/j.1539-6924.1986.tb00193.x. [DOI] [PubMed] [Google Scholar]
- 21.Bayes T. Essay towards solving a problem in the doctrine of chances. Philosophical Transactions of the Royal Society of London. 1763;53:370–418. [Google Scholar]
- 22.Resnic FS, Zou KH, Do DV, Apostolakis G, Ohno-Machado L. Exploration of a bayesian updating methodology to monitor the safety of interventional cardiovascular procedures. Med Decis Making. 2004;24(4):399–407. doi: 10.1177/0272989X04267012. [DOI] [PubMed] [Google Scholar]
- 23.Standards for Privacy of Individually Identifiable Health Information: Final Rule. Federal Register. 2002;67(157):53182–53273. [PubMed] [Google Scholar]
- 24.Newcombe RG. Interval estimation for the difference between independent proportions: comparison of eleven methods. Stat Med. 1998;17(8):873–890. doi: 10.1002/(sici)1097-0258(19980430)17:8<873::aid-sim779>3.0.co;2-i. [DOI] [PubMed] [Google Scholar]
- 25.Hanley JA, McNeil BJ. The meaning and use of the area under a receiver operating characteristic (ROC) curve. Radiology. 1982;143(1):29–36. doi: 10.1148/radiology.143.1.7063747. [DOI] [PubMed] [Google Scholar]
- 26.Lemeshow S, Hosmer DW., Jr A review of goodness of fit statistics for use in the development of logistic regression models. Am J Epidemiol. 1982;115(1):92–106. doi: 10.1093/oxfordjournals.aje.a113284. [DOI] [PubMed] [Google Scholar]
- 27.Cauchemez S, Boelle PY, Donnelly CA, Ferguson NM, Thomas G, Leung GM, Hedley AJ, Anderson RM, Valleron AJ. Real-time estimates in early detection of SARS. Emerg Infect Dis. 2006;12(1):110–113. doi: 10.3201/eid1201.050593. [DOI] [PMC free article] [PubMed] [Google Scholar]
- 28.Zohar S, Chevret S. The continual reassessment method: comparison of Bayesian stopping rules for dose-ranging studies. Stat Med. 2001;20(19):2827–2843. doi: 10.1002/sim.920. [DOI] [PubMed] [Google Scholar]