

Abstract
Several breast cancer tumor models respond to estradiol (E2) by undergoing apoptosis, a phenomenon known to occur in clinical breast cancer. Prior to the application of tamoxifen as an endocrine therapy, high dose E2 or diethystilbesterol (DES) treatment was successfully utilized, albeit with unfavorable side effects. It is now recognized that such an approach may be a potential endocrine therapy option. We have explored the mechanism of E2-induced tumor regression in our T47D:A18/PKCα tumor model that exhibits autonomous growth, tamoxifen-resistance and E2-induced tumor regression. Fulvestrant, a selective estrogen receptor downregulator, prevents T47D:A18/PKCα E2-induced tumor growth inhibition and regression when given prior or subsequent to tumor establishment, respectively. Interestingly, E2-induced growth inhibition is only observed in vivo or when cells are grown in Matrigel but not in two-dimensional tissue culture, suggesting the requirement of the extracellular matrix (ECM). Tumor regression is accompanied by increased expression of the pro-apoptotic Fas/FasL proteins and downregulation of the pro-survival Akt pathway. Inhibition of colony formation in Matrigel by E2 is accompanied by increased expression of Fas and shRNA knockdown partially reverses colony formation inhibition. Classical ERE-regulated transcription of pS2, PR, TGFα, C3 and cathepsin D is independent of the inhibitory effects of E2. A membrane impermeable E2-BSA conjugate is capable of mediating growth inhibition, suggesting the involvement of a plasma membrane ER. We conclude that E2-induced T47D:A18/PKCα tumor regression requires participation of ERα, the ECM, Fas/FasL and Akt pathways, allowing the opportunity to explore new predictive markers and therapeutic targets.
Keywords: PKCα, T47D, breast cancer, Fas, apoptosis, extracellular matrix
Introduction
Currently, tamoxifen is prescribed for the treatment of all stages of estrogen receptor alpha positive (ERα+) breast cancer and was the first drug approved as a chemopreventative agent for women at high-risk for developing the disease (1). Tamoxifen belongs to the class of drugs known as selective estrogen receptor modulators (SERMs), exhibiting target site-specific activities in the body (2). Resistance to tamoxifen often occurs as a result of a variety of cellular changes (3) but usually is not a result of loss or mutations within the ER (4-6). Evidence of cross-talk between both the nuclear and plasma membrane ER with growth factor receptors is well-documented in the literature (7) including involvement of IGF-1R(8), HER2/neu (9-11), EGFR (HER1) (12) and PC cell-derived growth factor (PCDGF/GP88) (13). Consequently, secondary signaling effectors are also modulated including Akt (14), PTEN(15), MAPK (16, 17) and AP-1(18-20). Increased levels of coactivators such as AIB1 (21)and decreased levels of the corepressor NCOR1 have also been implicated in mediating tamoxifen resistance (22).
Prior to the introduction of tamoxifen for the treatment of breast cancer, high-dose E2 and diesthystilbesterol (DES) were often used with response rates similar to those observed with tamoxifen (23, 24). Tamoxifen became the drug of choice due to the lower incidence of side effects. A report comparing DES-treated and tamoxifen-treated patients with a 20 year follow-up indicated a survival advantage for DES-treated patients (25). Another small trial conducted in postmenopausal patients with advanced breast cancer exposed to multiple endocrine therapies reported 31% of patients achieved complete or partial response to DES therapy(26). Several cell and tumor models exhibiting growth inhibition and apoptosis with E2 have now emerged (27-34). A common mechanism shared by at least three of these models is the involvement of the Fas/FasL apoptotic pathway (28, 33, 34). Fas is a member of the death receptor family also known as the tumor necrosis factor (TNF) superfamily that mediates the extrinsic apoptotic pathway upon activation by Fas ligand (FasL) binding in many tissues, the most well-studied of which include the immune system and the breast (35, 36).
We previously reported a T47D:A18 cell line stably transfected with protein kinase C alpha (PKCα) that is hormone-independent in vitro, and produces tumors in athymic mice that exhibit autonomous growth, are tamoxifen-resistant and are exquisitely sensitive to E2, resulting in tumor regression and apoptosis (31, 37). We have also reported the potential predictive value of PKCα overexpression in tamoxifen-resistant breast cancer in the clinic (38). PKC is a family of serine-threonine protein kinases that is comprised of at least 12 isozymes that are subdivided into three subfamilies: conventional (α, βI, βII, γ), novel (δ, ε, η, θ and μ), and atypical (ζ and ι/λ) (39-41). The PKC family of isozymes mediates a multitude of physiological processes in a cell-type and tissue-specific manner. The inverse relationship of PKC activity and ER status in breast cancer was initially reported several years ago (42), and our laboratory discovered the inverse relationship of PKCα and ERα in human breast cancer cell lines (37) and endometrial cancers (43). Other laboratories have described the importance of PKCα and other PKC isozymes in MCF-7 breast cancer cells in invasion (44, 45) and tamoxifen-resistance (41, 46, 47). Specifically Frankel et al. (47) documented PKCα overexpression in 9 antiestrogen-resistant cell lines and showed that stable overexpression of PKCα in MCF-7 cells resulted in reduced antiestrogen sensitivity. Recently, Assender et al. (46) reported that PKCα expression correlates with poor clinical response to endocrine therapy.
Our T47D:A18/PKCα tumor model is unique since PKCα overexpression may be a useful tumor marker to identify patients likely to respond to an E2-like treatment regimen. We previously reported that E2 causes tumor regression in vivo, but does not inhibit cells grown on two-dimensional (2D) plastic (31). In this study we explored the mechanism of E2-induced tumor regression in the T47D:A18/PKCα model by focusing on the contribution of the tumor microenvironment, involvement of the Fas/FasL pathway, and the role of ERα.
Results
The role of the Fas/FasL pathway in E2-induced regression
We previously demonstrated that regression of T47D:A18/PKCα tumors by E2 is accompanied by apoptosis (31). To determine the signaling pathways that may mediate the apoptotic process induced by E2, T47D:A18/PKCα tumors were established in thirty untreated athymic mice. Following 9 weeks, mice were randomized to continue without treatment (NT group, 10 mice) or were implanted with a 1.0 cm E2 capsule (E2 group, 20 mice) and the experiment was continued for an additional 15 days. Tumor stabilization was observed in the E2 treated mice until day 7, followed by tumor regression (Fig. 1A). The size of the E2-treated tumors was significantly reduced compared with the NT tumors at day 7 and all time points up until day 15 (P < 0.001). Tumors were collected at various time points from NT group and post-E2 treated mice on days 1, 2, 4, 5, 7, 8, 9, 12 and 15 following capsule implantation (Fig. 1A). Apoptosis was assessed by TUNEL assay as described in “Materials and Methods” in tumors from both the NT and E2 groups on days 8, 12 and 15. The percentage of apoptotic cells was significantly higher at all three time points in the E2 group compared with the NT group (Fig. 1B). These results are in agreement with our previous study and suggest that apoptosis contributes to E2-induced tumor regression (31).
Figure 1. E2 induces tumor regression, apoptosis, upregulation of Fas/FasL and downregulation of p-Akt/T-Akt in T47D:A18/PKCα tumors.
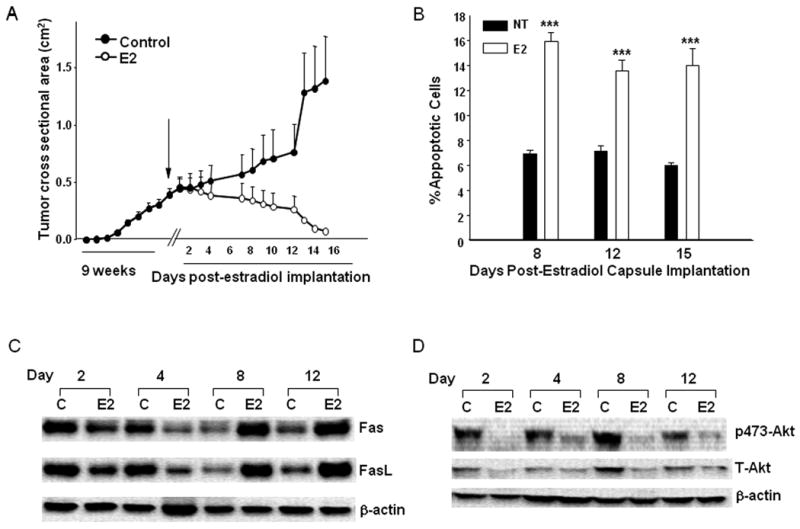
A.) Tumor growth of T47D:A18/PKCα in vivo. T47D:A18/PKCα cells were bilaterally injected into the mammary fat pads of thirty athymic mice. Mice were left untreated for 9 weeks until the mean tumor cross-sectional area reached 0.5 cm2, and then randomized to two treatment groups: continued no treatment (Control, 10 mice) and 1.0 cm E2 capsule (Control + E2, 20 mice). Results are shown as mean tumor cross-sectional area ± SE (upper limit only is shown for each point). Tumors were collected from both the Control and Control + E2 groups on 2, 4, 8, 12 and 15 days post-E2 capsule implantation. B.) Apoptotic effect of E2 on T47D:A18/PKCα tumors. Apoptosis in tumors was assessed by the TUNEL method from both Control and Control + E2 groups excised 8, 12 and 15 days post-E2 capsule implantation (corresponds to data shown in panel A). Data represent the percentage apoptotic cells in each treatment groups. Error bars represent SE. *** P<.001 compared with Control treatment group. Statistical test was two-sided. C.) Western blot analysis of Fas ligand (Fas L) and Fas protein expression in T47D:A18/PKCα tumors. D.) Western blot of T-Akt and P473-Akt protein expression in T47D:A18/PKCα tumors. Tumors were excised from both Control and Control + E2 groups on days 2, 4, 8 and 12 post-E2 capsule implantation. β-Actin was used as a loading control. Western blots are representative of two independent tumors, with three replicate experiments, all with similar results.
Previous reports have indicated the involvement of the Fas/FasL pathway in mediating apoptosis by E2 in other model systems (28, 33, 48). To determine the participation of Fas/FasL in mediating apoptotic cell death in T47DA18/PKCα tumors, Fas/FasL protein expression was compared in NT and E2-treated tumors (Fig. 1A). Initially, the E2-treated tumors express reduced Fas protein on Day 2 and Day 4 compared to the NT tumors. However, at later time points, Fas is significantly increased in the E2-treated tumors compared with the NT tumors (Fig. 1C). The same biphasic pattern of FasL regulation is observed with an initial decrease of FasL expression in E2-treated tumors relative to NT tumors at Day 2 and Day 4, followed by increased FasL expression in E2-treated tumors compared with NT tumors on Day 8 and Day 12. Therefore, upregulation of both Fas and FasL is temporally related with E2-induced T47D:A18/PKCα tumor regression and apoptosis (Figs. 1A, C). However since upregulation of Fas/FasL is not observed prior to tumor regression it is likely that Fas/FasL-induced apoptosis may not be the sole pathway responsible for E2-induced tumor regression.
The Akt/PKB pathway is downregulated in E2-regressing tumors
Since the Fas/FasL pathway is not likely to be the only mechanism whereby E2-induced tumor regression occurs, we examined the possible involvement of the pro-survival Akt/PKB pathway. We find that both total and p473-Akt are reduced in the E2-treated tumors compared with the untreated control at all time points (Fig. 1D). These results suggest that the pro-survival, anti-apoptotic Akt pathway is inactivated by E2 treatment and therefore contributes to E2-induced tumor regression. These results suggest that repression of the pro-survival, anti-apoptotic Akt pathway precede activation of the Fas/FasL apoptotic pathway and coordinately these two pathways mediate tumor regression.
E2-induced T47D:A18/PKCα growth inhibition requires contact with the ECM
We previously reported that E2 inhibits the growth of T47D:A18/PKCα cells in vivo, but has no growth inhibitory effect in vitro (31). To determine whether the ECM is sufficient to recapitulate the in vivo environment, the ability of T47D:A18/PKCα and T47D:A18/neo cells to form colonies in Matrigel was examined. T47D:A18/neo cells form statistically significantly more colonies in phenol-red containing Matrigel compared with T47D:A18/PKCα cells (Fig. 2A), suggesting that the presence of E2 in the Matrigel environment inhibits colony formation. When cells are plated in phenol red-free Matrigel (E2 depleted environment), T47D:A18/PKCα colony formation is inhibited by 50% in the presence of E2 compared with the absence of E2 (Fig 2B). In the absence of E2, T47D:A18/neo cells form few colonies whereas in the presence of E2, numerous colonies are formed (Fig. 2B). These results suggest that a component provided by Matrigel is sufficient to recapitulate the E2-induced growth inhibitory effects observed in vivo. To determine if growth factors present in Matrigel are required to produce E2-induced growth inhibition, colony formation was examined in growth factor reduced (GFR)-Matrigel (Figs. 2C, D). E2 retains the ability to inhibit T47D:A18/PKCα colony formation in GFR-Matrigel, exhibiting similar results when cells are plated either in phenol red-containing (Figure 2C) or phenol red-free RPMI Matrigel (Fig. 2D). Since cells grown in 2D are also exposed to growth factors (31, 37), it is unlikely that growth factors present in Matrigel are responsible for mediating the E2 inhibitory effect. However, we cannot rule out this possibility since growth factors are not eliminated, but simply reduced in GFR-Matrigel. It is likely that another Matrigel component is required for E2-induced growth inhibition. E2 does not inhibit colony formation when the cells are plated in soft agar (results not shown) nor have we been able to successfully establish T47D:A18 colonies on collagen or laminin coated plates.
Figure 2. Growth inhibitory effects of E2 in T47D:A18/PKCα cells grown in Matrigel.
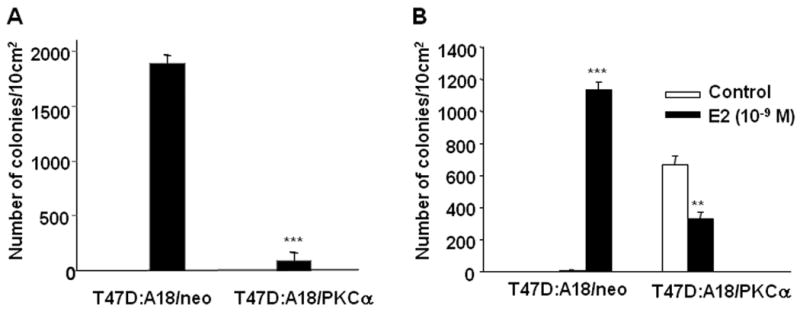
Cells were plated in Matrigel as described in “Materials and Methods”. A.) T47D:A18/neo and T47D:A18/PKCα cells were grown in phenol red-containing RPMI and seeded into phenol red-containing Matrigel. Data are the mean number of colonies per 10 cm2, error bars represent the standard error (SE). ***Comparison of the number of colonies between each cell line is statistically different at P < 0.001. B.) T47D:A18/neo and T47D:A18/PKCα cells were grown in phenol red-free RPMI and seeded into phenol red-free Matrigel. Cells were either not treated (Control) or treated with E2 (10-9 M). ***Comparison of the number of T47D:A18/neo colonies in the Control versus E2-treated cells was statistically different at P <0.001. *Comparison of the number of T47D:A18/PKCα colonies in the Control versus E2-treated cells was statistically different at P < 0.01.
E2 induces apoptosis and increases Fas expression in T47D:A18/PKCα cells grown in Matrigel
To determine whether the mechanism of E2-induced growth inhibition of T47D:A18/PKCα cells grown in Matrigel is similar to the E2-growth inhibitory effects observed in vivo, apoptosis and Fas/FasL protein expression was examined. The percentage of apoptotic cells in the T47D:A18/PKCα colonies increased with time following E2 treatment and was significantly increased compared to the untreated control colonies at 7 and 15 days post-E2 treatment (Fig. 3A).
Figure 3. E2 induces apoptosis and expression of Fas in T47D:A18/PKCα cells grown in Matrigel.
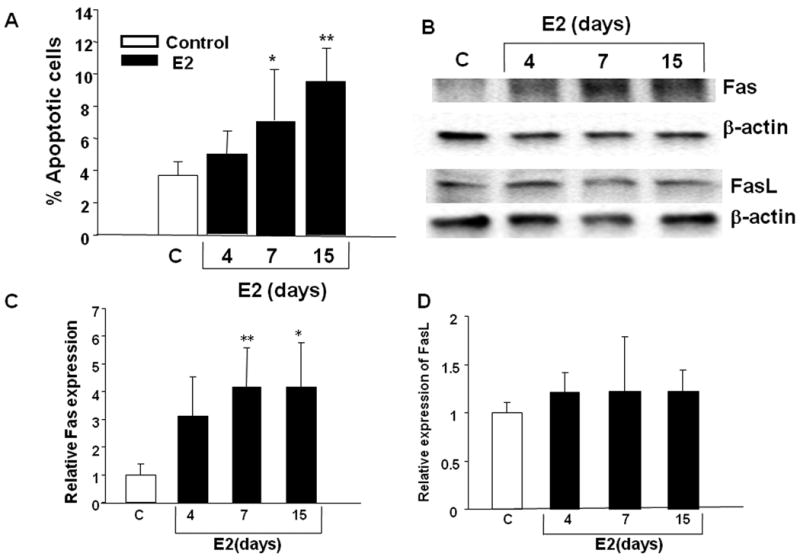
A.) T47D:A18/PKCα cells were grown in phenol red-free media, seeded on top of phenol red-free Matrigel and were maintained for 15 days. E2 treatment (10-9 M) was initiated at various times and on Day 15, colonies were released from Matrigel, fixed, sectioned and TUNEL stain was performed. Apoptosis was significantly increased in a time-dependent manner in E2-treated colonies compared to untreated colonies. *: Comparison of apoptosis in colonies treated with E2 for 7 days versus control (untreated) colonies was significantly different at P< 0.05; **comparison of apoptosis following E2 treatment for 15 days versus control, P< 0.01. The results are representative of two independent experiments. B.) T47D:A18/PKCα cells were grown in phenol red-free Matrigel and either left untreated (control) or treated with E2 (10-9 M) for 4, 7 or 15 days. Western blot showing Fas and FasL protein expression is representative of three independent experiments. C, D.) Quantitation of the bands in panel B using Quantity One software (Bio-Rad Laboratories.). *Fas expression is significantly different at P< 0.05 compared to control; **Fas expression is significantly different at P< 0.01 compared to control.
Since both Fas and FasL protein expression exhibited a temporal increase with concomitant tumor regression (Fig. 1A, C), Fas/FasL expression was determined in T47D:A18/PKCα colonies treated with E2 growing in Matrigel. Fas expression was increased in the E2-treated T47D:A18/PKCα colonies at all three time points (Fig. 3B, C) and is consistent with Fas upregulation observed in tumors (Fig 1C). However there was no difference in the expression of FasL in E2-treated colonies versus the untreated control (Fig. 3B, D). Neither Fas nor FasL expression is regulated in T47D:A18/PKCα cells growing in 2D (results not shown), nor does E2 cause growth inhibition of cells on 2D plastic, suggesting that the tumor microenvironment and Matrigel provide the context whereby E2 causes tumor regression or colony growth inhibition respectively.
Knock-down of Fas by shRNA partially reverses E2-inhibited colony formation in Matrigel
To further clarify the role of the Fas/FasL pathway in E2-induced apoptosis in the T47D:A18/PKCα cell model, we applied RNA interference to stably knockdown Fas. Lentiviral transduction particles containing shFas constructs were used to transfect T47D:A18/PKCα cells and selected clones were screened by western blot to confirm decreased expression of Fas. Fas expression was reduced to 80% and 60% as determined by densitometry in two Fas stable T47D:A18/PKCα clones, #6-3 and #7-9, respectively (Fig. 4A). To determine whether reduced Fas expression was sufficient to abrogate Fas/FasL-mediated apoptosis, recombinant FasL peptide was used to initiate apoptosis in the shFas stable clones in 2D tissue culture. Whereas apoptosis was increased by 2-fold in both the parental T47D:A18/PKCα cells and the negative control, T47D:A18/PKCα/NTS cells (stable transfectant with non-targeting sequence), the two shFas clones were not responsive to FasL (Fig 4B). Therefore we concluded that sufficient knockdown of Fas was achieved in the selected shFas clones and were used to study the effect on the E2-inhibitory phenotype.
Figure 4. Knock-down of Fas by shRNA transfection reduces the E2-inhibitory effects.
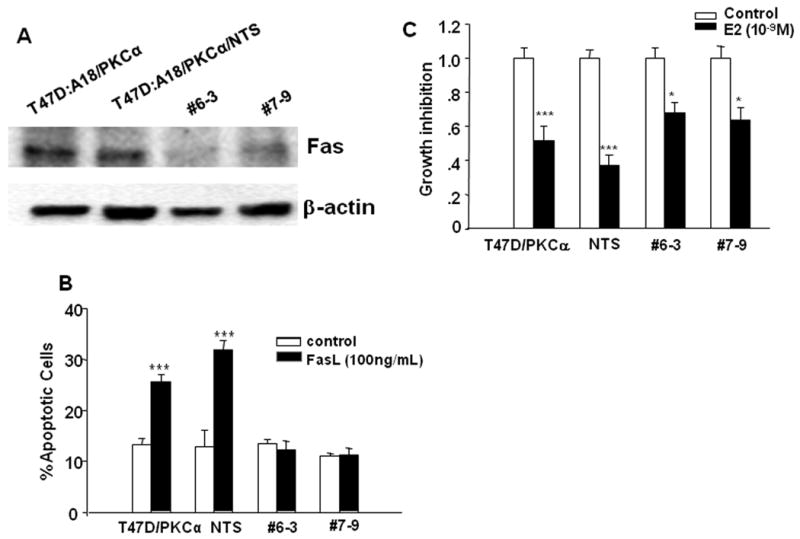
A.) T47D:A18/PKCα cells were transfected with lentiviral shFas transduction particles, and stable clones were selected and screened for Fas expression with western blot. NTS: T47D:A18/PKCα cells stably transfected with non-targeting sequences. B.) T47D:A18/PKCα, T47D:A18/PKCα/NTS, T47D:A18/PKCα/shFas#6-3 and #7-9 clones were treated with recombinant FasL peptide for 16 hours and apoptosis was detected with Annexin-V/PI double staining followed by flow cytometry. ***: Comparison of % apoptosis in FasL treated cells versus untreated (control) cells was significantly different at P < 0.001. C.) T47D:A18/PKCα, T47D:A18/PKCα/NTS, T47D:A18/PKCα/shFas#6-3 and #7-9 were grown in phenol-red free Matrigel and treated with E2 (10-9 M) or vehicle for 20 days. The number of untreated colonies (control group) was set as one, and the growth inhibition was represented by the ratio of the number of E2-treated colonies to control group. *** and *: Comparison of the number of E2-treated colonies versus the untreated control group was significantly different at P < 0.001 and P < 0.05 correspondingly using t-test.
To study the effect of Fas knockdown on regulation of E2-inhibition in Matrigel, colony formation assays were performed comparing the parental T47D:A18/PKCα and T47D:A18/PKCα/NTS to the shFas clones, #6-3 and #7-9. The E2-treated T47D:A18/PKCα cells formed 50% fewer colonies compared to the untreated control and the T47D:A18/PKCα/NTS cells formed 60% fewer colonies following E2-treament (Fig. 4C). However the shFas clones formed 30-35% fewer colonies compared to the untreated control groups. Therefore Fas interference in these clones only partially reversed the E2-inhibitory phenotype, suggesting that the Fas/FasL pathway contributes to tumor regression mediated by apoptosis, but may not be the only pathway.
Estradiol-induced inhibition of T47D:A18/PKCα tumor growth requires the ER
To determine the role of the ER in E2-induced tumor regression, the ability of the selective estrogen receptor downregulator (SERD) fulvestrant, to block E2-induced tumor regression was tested. T47D:A18/PKCα cells were injected into fifty ovariectomized athymic mice. Forty mice were not treated (NT group), 10 mice were implanted with a 1.0 cm E2 capsule and given weekly injections with fulvestrant for all 13 weeks. After 7 weeks, 40 mice from the NT group were randomized to three treatment groups: continued NT (10 mice), E2 capsule (10 mice) and E2 capsule plus weekly injections with fulvestrant (20 mice) (Fig. 5A). Fulvestrant prevented E2-induced tumor growth inhibition and regression when given prior or subsequent to tumor establishment, respectively. Since the mechanism of action of fulvestrant involves the destruction of the ER (49), these results suggest that the ER is required for E2 to exert growth inhibitory effects. This finding is in agreement with another study reporting participation of the ER in an MCF-7 tumor model exhibiting E2-induced tumor regression (33).
Figure 5. The presence of fulvestrant abolished E2-induced T47D:A18/PKCα tumor regression and apoptosis in athymic mice.
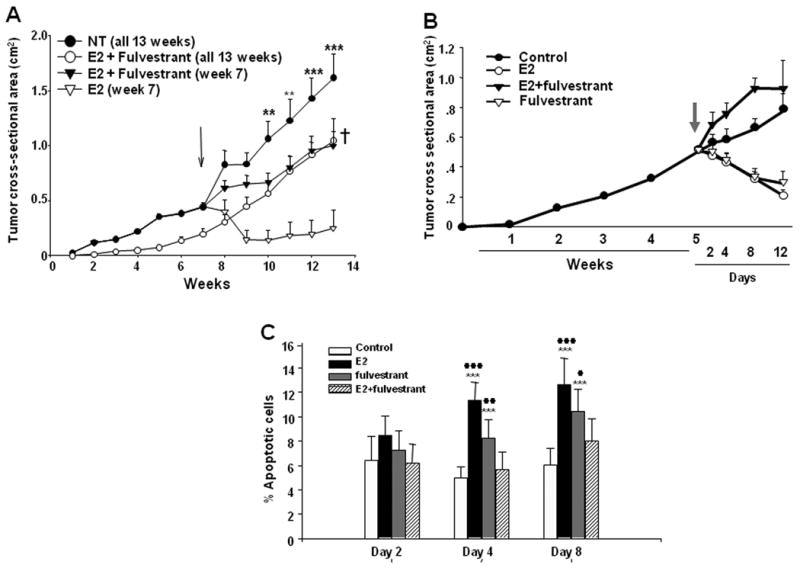
A.) Cells were injected into the mammary fat pads of fifty athymic mice. Forty mice were not treated (NT group), 10 mice were implanted with a 1.0 cm E2 capsule and given weekly injections with fulvestrant (E2 + fulvestrant, 13 weeks). After 7 weeks (indicated by arrow), forty mice from the NT group were randomized to three treatment groups: continued NT (10 mice), E2 capsule (E2, week 7, 10 mice), E2 capsule and weekly injections with fulvestrant (E2 + fulvestrant, week 7, 20 mice). Results are shown as mean tumor size ± SE (upper limit only is shown for each point). Tumors in the NT group were statistically significantly larger than tumors in the E2 treatment group at weeks 11-13. **P < 0.01; ***P < 0.001. †Tumors in the E2 + fulvestrant, week 7 and E2 + fulvestrant, 13 weeks groups were statistically significantly larger than tumors in the E2 group at week 13 (P < 0.01) using the Bonferonni multiple comparisons test. B.) Cells were injected into the mammary fat pads of forty athymic mice. The mice were not treated and tumors allowed to grow until week 5. After 5 weeks (indicated by arrow), the mice were randomized to four treatment groups with 10 mice in each group: continued untreated (control), E2 1.0 cm capsule (E2), E2 1.0 cm capsule and weekly injections with fulvestrant (E2+fulvestrant), and fulvestrant injections alone (fulvestrant). Results are shown as mean tumor size ± SE. C.) Analysis of apoptosis in T47D:A18/PKCα tumors treated with E2, fulvestrant, or E2 plus fulvestrant. TUNEL assays were performed on the T47D:A18/PKCα tumors in control, E2, fulvestrant or E2+fulvestrant treatment groups to detect apoptotic cells. The data was expressed as mean ± SE based on measurements of 3 independent tumors. **: a significant difference between control and treatment groups with P < 0.01. **: P < 0.001. #: significant difference between treatments and E2+fulvestrant group with P < 0.05 (##: P < 0.01; ###: P < 0.001) (Tukey-Kramer Multiple Comparison post-hoc test).
To examine the mechanism whereby fulvestrant rescues E2-mediated tumor regression, 40 mice were bilaterally injected with T47D:A18/PKCα cells and tumors were left untreated for 5 weeks. At that time, mice were randomized into 4 treatment groups (10 mice/group); continued no treatment, E2 capsule, fulvestrant or E2 + fulvestrant. Tumors were excised from all treatment groups 2, 4 and 8 days post-treatment for assessment of apoptosis by the TUNEL assay and expression of Fas/FasL proteins by western blot. Tumor regression was observed in both the E2-treated and fulvestrant-treated mice, whereas tumors in the untreated and E2+fulvestrant treated mice continued to grow (Fig. 5B). However in contrast to the previous mouse experiment (Fig. 5A), tumors in the E2+fulvestrant group grew faster than the untreated control group in this experiment. TUNEL assay revealed that the level of apoptosis was greatest in the E2-treated tumors following 4 and 8 days post-treatment, with a similar trend in the fulvestrant alone tumors, whereas the E2+fulvestrant group showed no increased apoptosis compared to the untreated control tumors (Fig 5C). Tumors treated with either E2 alone or fulvestrant alone exhibited upregulation of both Fas and FasL expression, however expression of Fas/FasL in the E2 treated tumors occurred earlier (4 days) compared with the fulvestrant treated tumors, where expression of Fas/FasL appeared later (8 days) (Figs. 6A, B). This suggests that the mechanism whereby E2 induces Fas/FasL protein expression is different than the mechanism initiated by fulvestrant treatment. Interestingly, treatment with a combination of E2+fulvestrant partially suppresses tumor Fas upregulation on Day 4, and completely reverses Fas expression on Day 8. The E2+fulvestrant combination completely reverses FasL expression similar to levels observed in the untreated control tumors. Taken together these results indicate that addition of the SERD fulvestrant can reverse E2-induced apoptosis in T47D:A18/PKCα tumors, partially due to reversal of Fas/FasL expression and perhaps via a mechanism requiring the ER.
Figure 6. Western blot analysis of Fas and FasL protein expression in T47D:A18/PKCα tumors and cells.
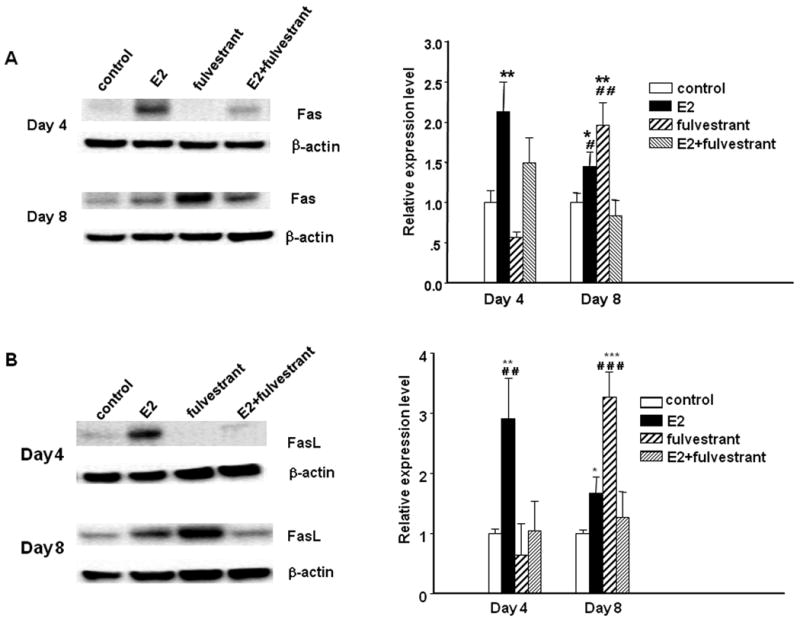
T47D:A18/PKCα tumors were excised from Control, E2, fulvestrant and E2 plus fulvestrant groups on day 4 and day 8 post-E2 capsule implantation (corresponds to Figure 5B) and protein was extracted. Western blot indicates Fas (A) and FasL (B) protein expression and is representative of four independent tumors, all with similar results. β-Actin was used as a loading control. *: P < 0.05; **: P < 0.01; ***: P < 0.001, significant difference between treatment and control using one-way ANOVA followed by Tukey-Kramer Multiple Comparison post-hoc test. #: significant difference when compared to E2 plus fulvestrant treatment group.
Both E2 and fulvestrant are known to cause degradation of the ER, however these ligands act via distinct pathways. Whereas E2-mediated ER downregulation is a result of transcriptional activation, coactivator recruitment and subsequent proteosomal degradation (50-53), fulvestrant stimulates ER degradation directly via disruption of nucleocytoplasmic shuttling and the ubiquitin-proteosome pathway (49, 54). Treatment with either E2 alone or fulvestrant alone at 2, 4 and 8 days results in ERα protein downregulation in T47D:A18/PKCα tumors (Fig 7). This result indicates that although E2 causes regression of these tumors, the downregulation of ERα in response to E2 is as expected. While fulvestrant treatment also results in ERα downregulation as predicted, the combination of E2+fulvestrant partially reverses ERα downregulation at all time points examined. Therefore the differential regulation of ERα may be responsible for the prevention of apoptosis and restoration of tumor growth.
Figure 7. Western blot analysis of ER protein expression in T47D:A18/PKCα tumors.
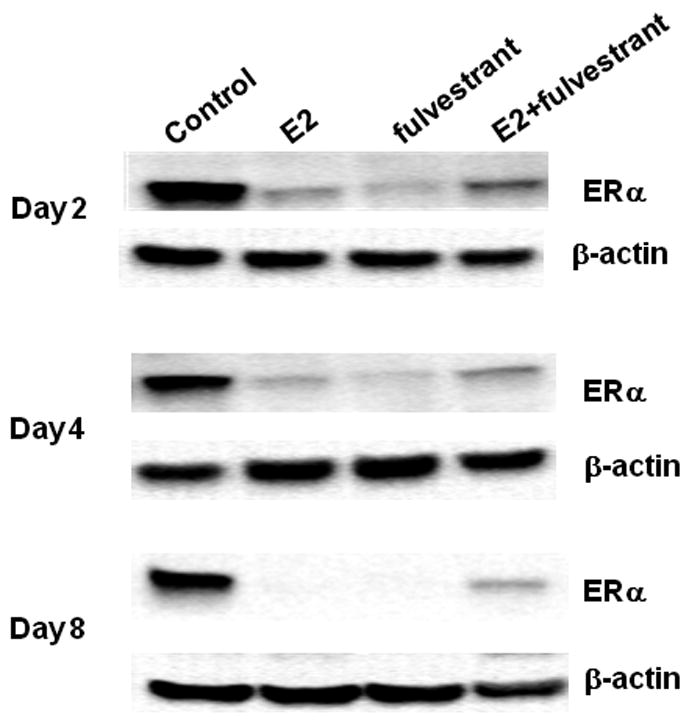
T47D:A18/PKCα tumors were excised from Control, E2, fulvestrant and E2 plus fulvestrant groups on days 2, 4 and 8 post-E2 capsule implantation (corresponds to Figure 5B) and protein was extracted. Western blot indicates ER protein expression and is representative of three independent tumors, all with similar results. β-Actin was used as a loading control.
Classical ERα regulated gene expression
To investigate the role of ERα in E2-mediated tumor regression, expression of genes well known to be regulated by E2 was determined in T47D:A18/PKCα tumors derived from treatment groups harvested on Day 8 as shown in Fig. 5B. We chose to determine the expression of five classical ERE-mediated E2-responsive genes, C3 (complement component 3), PGR (progesterone receptor), CTSD (cathepsin D), TFF1 (trefoil factor 1 or pS2) and TGFA (transforming growth factor α) by real-time RT-PCR (Fig. 8). Although E2 treatment causes tumor regression and addition of fulvestrant prevents regression, 4 out of the 5 classically estrogen regulated genes including C3, PGR, CTSD and TFF1 are upregulated in both the E2 and E2 + fulvestrant treated tumors compared to the untreated control tumors. Despite the fact that treatment with either E2 or fulvestrant causes tumor regression, these 4 genes exhibit opposite regulation. An exception to this is TGFα, the expression of which appears to be upregulated in tumors from all 3 treatment groups (E2, fulvestrant, or E2+fulvestrant). These results suggest that although E2 is causing complete regression of T47D:A18/PKCα tumors, E2 nonetheless can induce classical ERE-mediated gene expression in this tumor model. Therefore, perhaps E2-induced tumor regression is mediated by the ER via a non-classical mechanism.
Figure 8. Regulation of ER-responsive gene transcription.
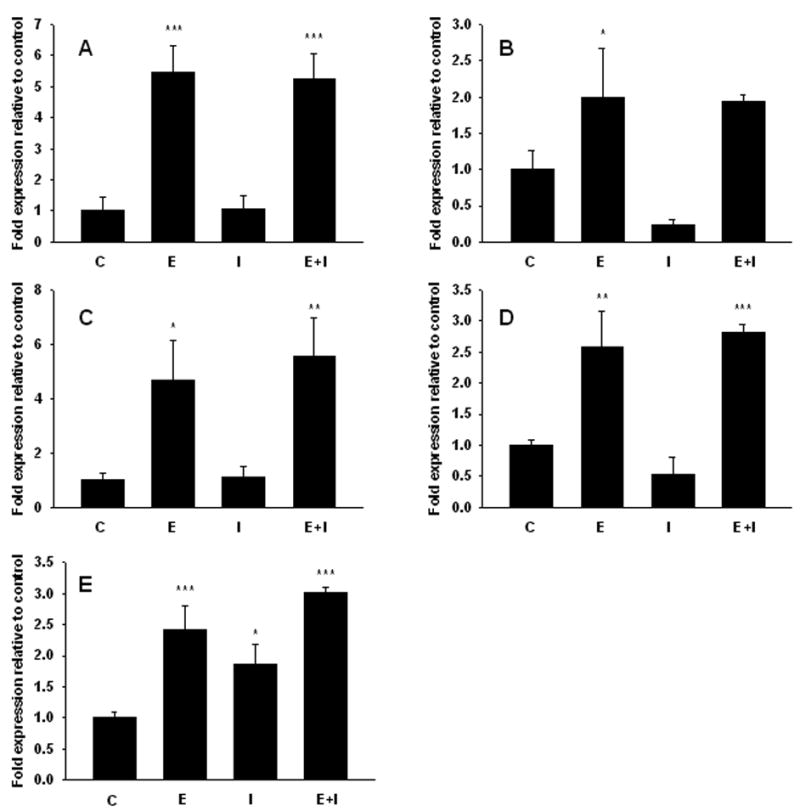
mRNA levels of estrogen responsive genes in PKCα overexpressing tumors 8 days following treatment. A) C3. B) PGR. C) CTSD. D) TFF1. E) TGFA. Each group contains 3 independent tumors. Expression levels were compared using Tukey's HSD test followed by one-way ANOVA. Stars indicate groups significantly different from control. * P< 0.05, ** P< 0.01, *** P< 0.001. C, control, E, 17β-estradiol, I, fulvestrant, E+I, 17β-estradiol+fulvestrant.
The plasma membrane-associated ER is implicated in the E2-inhibitory effect
To investigate the possibility that the E2-induced growth inhibitory effects may be mediated by a plasma membrane associated ER, the membrane impermeable E2-BSA conjugate was used as a tool. To check whether free E2 was present in the E2-BSA conjugate, an ERE-luciferase construct was transfected intoT47D:A18/neo cells. It was concluded that insignificant levels of free E2 were present in the E2-BSA conjugate since the E2-BSA treated cells showed luciferase activity similar to the vehicle treated control cells, whereas E2 treatment resulted in 17-fold induction of luciferase activity (Fig 9A).
Figure 9. Both E2 and E2-BSA inhibit T47D:A18/PKCα colony formation in Matrigel.
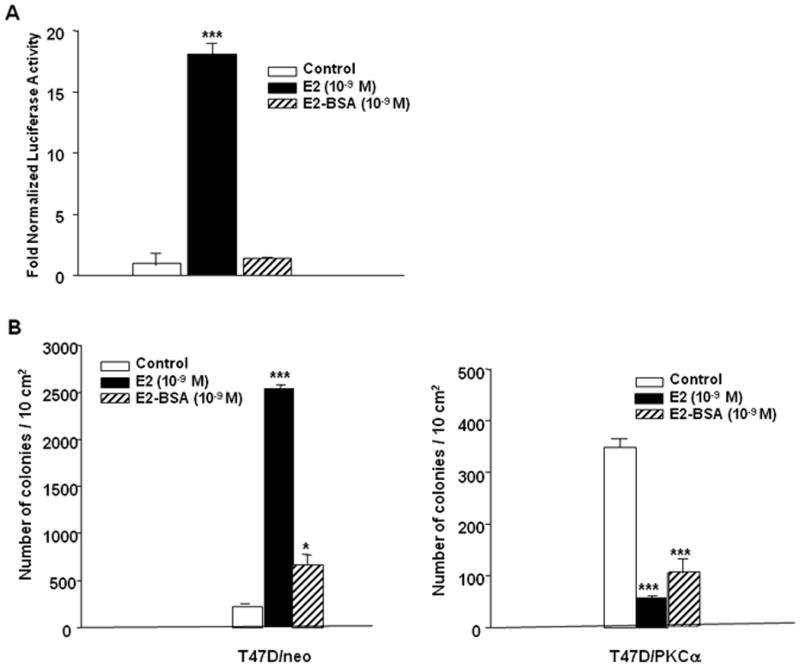
A.) E2-BSA does not induce ERE-luciferase activity in T47D:A18/neo cells. T47D:A18/neo cells were transfected with ERE-tk-LUC and β-galactosidase expression plasmids. Luciferase activity was measured after 20 hours treatment with E2 (10-9 M), E2-BSA (10-9 M) or vehicle (control) and normalized to β-gal. B.) Colony formation assays. T47D:A18/neo and T47D:A18/PKCα cells were grown in phenol-red free Matrigel in the presence of vehicle (Control), E2 (10-9 M), or E2-BSA (10-9 M). *: significant difference between treatment and control groups at P < 0.05; ***: P < 0.001 (one-way ANOVA Tukey-Kramer Multiple Comparison post-hoc test).
The ability of the membrane-impermeable E2-BSA conjugate to inhibit T47D:A18/PKCα colony formation was examined in Matrigel. Treatment with the E2-BSA conjugate resulted in slightly more T47D:A18/neo colonies compared with the untreated control group when grown in Matrigel, suggesting that E2-BSA can stimulate modest colony formation. However 3.5-fold more colonies were present in the E2-treated group compared with the E2-BSA group (Fig. 9B). Both E2-BSA alone and E2 alone inhibited T47D:A18/PKCα colony formation compared to vehicle treated control cells (Fig. 9C). These results imply that perhaps the E2-inhibitory effects may be mediated via an ER associated with the plasma membrane.
Discussion
The possibility of using an E2-like compound in patients that exhibit tamoxifen resistant breast cancer is a concept that is re-emerging (55-58), and the ability to predict a priori patients that would benefit from such an approach is very attractive. Our laboratory reported the correlation of PKCα overexpression with disease recurrence following tamoxifen treatment (38). We have explored the signaling events leading to E2-induced tumor regression in our unique T47D:A18/PKCα tumor model (31, 37). This is a relevant model of autonomous growth, tamoxifen-resistance and E2-induced tumor regression, characteristics often encountered in the clinical setting. In this study we report the requirement of the tumor microenvironment, specifically the ECM, for E2 to elicit inhibitory effects. The ER is likely required for E2-induced tumor regression since the SERD fulvestrant prevents these effects. We provide evidence that upregulation of the Fas/FasL apoptotic pathway occurs concurrent with E2-induced tumor regression and this pathway appears to be modulated only in vivo or in Matrigel, but not in 2D tissue culture. These results suggest that communication between the ECM and the tumor plays an important role in eliciting the E2-induced growth inhibitory effects. Tumor regression is also accompanied by downregulation of the Akt pro-survival pathway. ERE-mediated induction of 5 known E2-regulated genes is not altered in this model indicative of intact classical ER signaling. The membrane impermeable E2-BSA conjugate elicits growth inhibitory effects; therefore a plasma membrane form of the ER is likely involved.
PKC isozyme expression has been studied in the MCF-7 cell lines by several investigators (44, 45, 47). To our knowledge, our T47D:A18/PKCα cell and tumor model is the only reported breast cancer model other than MCF-7 examining the effect of PKC isozyme expression on antiestrogen resistance. In this model, although we reported cross-upregulation of PKCs β and δ (37), we have determined that coordinate overexpression of PKCδ and PKCβ is not sufficient to impart autonomous, tamoxifen-resistant and E2-inhibitory growth (60).
Several reports of MCF-7 tumor models describe E2-induced growth inhibition and regression. A cyclical response to E2 in MCF-7 tumors was first reported by Yao et al., (27) whereby short-term exposure to tamoxifen (1 year) yielded tamoxifen resistant and E2 responsive tumors whereas long-term tamoxifen exposure (5 years) tumors remained tamoxifen-resistant but also acquired an inhibitory response to E2 (27). We found elevated PKCα expression in both tumor types suggesting a correlation of PKCα overexpression with the hormone-responsive phenotype (31). Shim et al. (32) demonstrated that long-term estrogen deprived cells (LTED) form tumors that can be inhibited by E2 via activation of the apoptotic Fas pathway (28). The Fas pathway also mediates the E2-induced apoptosis in MCF-7 TAMLT tumors (33) and the MCF-7/Ral tumor model (34). However T47D:A18/PKCα tumor regression is likely mediated by both pro-apoptotic signals through Fas/FasL and inhibition of pro-survival signals by downregulation of the Akt pathway. Another example of E2-induced tumor regression was established by the stable transfection of MCF-7 cells with Akt-3 (61). Tumors derived from this cell line are hormone-independent, tamoxifen-stimulated and growth inhibited by E2. Whereas all of the MCF-7 tumor models show E2-induced cell growth inhibition both in vitro and in vivo, our T47D:A18/PKCα cell model is not inhibited by E2 under 2-D culture conditions; E2 only elicits growth inhibition either in vivo (31) or in Matrigel. Matrigel is a solubilized basement membrane preparation derived from the Englebreth-Holm-Swarm mouse sarcoma and the major components include laminin, collagen IV, heparan sulfate proteoglycans, entactin and nidogen. The advantage of utilizing 3D models for breast cancer research is well-described and shown to better mimic the tumor microenvironment (62). T47D:A18/PKCα colony formation is inhibited in Matrigel either in media containing serum and phenol-red (Fig. 2A) or with the addition of exogenous E2 (Fig. 2B). The ability of E2 to inhibit colony formation is not impaired when T47D:A18/PKCα cells are grown in GFR-Matrigel (supplemental data), suggesting that a component in Matrigel other than growth factors is responsible for mediating the inhibitory effect. However, the inhibition of colony formation by E2 does not completely mimic tumor regression in vivo. Both Fas and FasL are upregulated by E2 in tumors (Fig 1C), whereas Fas alone but not FasL is upregulated in Matrigel (Fig. 3). Another distinction from the in vivo model is the inability of fulvestrant to reverse E2-mediated inhibition of colony formation (results not shown). Taken together these results suggest that Matrigel cannot completely recapitulate the tumor microenvironment. Stromal cells, which are obviously absent from Matrigel, may contribute to E2-induced tumor regression and apoptosis. One possibility is that E2 induces antiangiogenic signals, although no changes in VEGF was observed in tumors following E2 treatment (results not shown). There is abundant evidence in the literature that PKC interacts with integrins (63-65), specifically a direct interaction between PKCα and β1 integrins was reported (66). Integrin expression following E2 treatment both in tumors and colonies growing in Matrigel was not altered (results not shown), but this does not rule out the possibility that enhanced PKCα/integrin signaling may lead to secretion of an antiangiogenic factor that mediates tumor regression in vivo. Another potential mediator of ECM interactions is syndecan-4, a transmembrane proteoglycan known to physically interact with PKCα (67, 68). Our laboratory is currently investigating this potential pathway.
Our results indicate that E2-induced tumor regression may also require the participation of the ER itself. We find that E2-induced tumor regression can be prevented by co-administration of fulvestrant (Figs. 5A, B), a SERD currently approved as a second-line endocrine therapy that binds to and causes complete destruction of the ER (69). ERα expression is downregulated in T47D:A18/PKCα tumors in response to E2 or fulvestrant alone, but is retained in tumors treated with the E2+fulvestrant combination, most evident on Day 8 (Fig. 7). E2 is reported to cause rapid downregulation of the ER that is dependent upon coactivator recruitment and new protein synthesis whereas destruction of the ER by fulvestrant is independent of these processes (70). In our T47D:A18/PKCα tumor model, ERα regulation by the combination of E2+fulvestrant appears to be dissimilar from regulation by either E2 or fulvestrant treatment alone. Perhaps this differential ERα regulation is vital in the reversal of the growth inhibitory effects observed with E2. Similar to our model, MCF-7TAMLT E2-induced tumor regression is also abrogated by fulvestrant, implicating the participation of the ER (33).
We previously reported that ER function is reduced 10-fold in T47D:A18/PKCα cells as assessed by ERE-luciferase reporter assays (37). This suggested to us that classical ERE-mediated signaling may not be the mechanism whereby the ER mediates E2-induced tumor regression. However, we find that 5 classically ERE-regulated genes, pS2, PR, TGFα, C3 and cathepsin D are upregulated in tumors from E2-treated mice (Fig. 8). Except for TGFα, transcription of the other genes is not induced by fulvestrant. Interestingly, all 5 genes are induced by the combination of E2+fulvestrant to a similar level as E2 treatment alone. We conclude that transcriptional induction of these genes is independent of tumor response to E2, therefore classical signaling is not likely to mediate tumor growth inhibition. Since interaction of T47D:A18/PKCα cells with the ECM appears to be crucial for E2 to exhibit growth inhibitory effects, an attractive scenario is that tumor growth inhibition is mediated by the plasma membrane ER (71). The plasma membrane ER interacts with G proteins affecting downstream signaling cascades including ERK, PI3K and PKC (72-74). There is evidence that estradiol can directly bind and activate PKCα at the plasma membrane through non-genomic effects in endometrial cancer cells and rat colon (75, 76). The fact that the membrane impermeable E2-BSA conjugate can inhibit colony formation in Matrigel equally well as E2 (Fig. 9), suggests that the plasma membrane ER is more likely to mediate the E2-growth inhibitory effect. Alternatively, we do not rule out the genomic non-classical ER signaling with other transcription factors such as AP-1 or Sp1(77, 78). We are currently pursuing these possibilities.
We described here the characterization of a tamoxifen-resistant T47D:A18/PKCα tumor model that has several similarities and distinctions with the MCF-7 derived tumor models. This T47D:A18/PKCα tumor model is a unique tool to further study potential therapeutic targets for tamoxifen resistant breast cancer, especially since we and others have evidence that PKCα overexpression may be a predictive marker of tamoxifen resistance (38, 46). It may be possible to identify patients that would benefit from treatment with E2 or E2-like compounds simply by screening for PKCα expression. Perhaps the success rate of the PKCα antisense oligonucleotide Affinitak (LY900003/ISIS 3521) (79) can be improved by identification of patients with PKCα overexpressing tumors. Alternatively, the plasma membrane ER may be a potential novel therapeutic target. Finally, our findings have important implications for the application of fulvestrant and aromatase inhibitors in patients that harbor PKCα-overexpressing tumors. Based on our findings, the efficacy of fulvestrant may potentially be compromised in patients with circulating estrogens. Furthermore, E2 deprivation created by aromatase inhibitors may cause tumor growth. We are currently testing the latter hypothesis in a preclinical tumor model.
Materials and Methods
Cell Culture Conditions
Human breast cancer cell line T47D:A18 is a hormone-responsive clone that has been previously described (80), and was maintained in phenol red-containing RPMI-1640 supplemented with 10% fetal bovine serum (FBS). Stable transfectant cell lines T47D:A18/neo and T47D:A18/PKCα (37) were maintained in RPMI-1640 (phenol-red) supplemented with 10% FBS-containing G418 (500 μg/ml). When indicated, prior to treatment with E2 or fulvestrant for protein isolation, western blot or Matrigel experiments, cell lines were placed in phenol red-free RPMI-1640 supplemented with 10% 3× dextran-coated charcoal-treated FBS (E2- depleted media) for 3 days.
Growth of Cells in Matrigel
T47D:A18/neo and T47D:A18/PKCα cells were maintained either in phenol-red free RPMI (E2-depleted) media for three days or in phenol red-containing RPMI supplemented with 10% FBS. Matrigel (Becton Dickinson; Lincoln Park, NJ) was thawed overnight at 4°C and E2 (10-9 M), E2-BSA (10-9 M) or vehicle (ethanol) was added to the Matrigel (phenol red-free, phenol red-containing, or growth factor reduced Matrigel). Six-well plates were coated with 800 μl Matrigel/well, and incubated at 37°C for 30 min. Cells were suspended at 5 × 10³ cells/ml in 1.3 ml of either phenol red-containing RPMI media or phenol red-free RPMI with E2 or E2-BSA (10-9 M) supplemented with 500 μg/ml G418 and spread on pre-gelled Matrigel. Plates were incubated at 37°C for 3 weeks; media was replaced to the top of the Matrigel every 3 days. Five 1.0 cm2 areas were counted under 5X power, and the average number of colonies ± SEM was determined.
Growth of T47D:A18/PKCα Tumors In Vivo
T47D:A18/PKCα cells were injected bilaterally (1×10⁷ cells/site) into the axillary mammary fat pads of ovariectomized nude 4-6 week old athymic mice (Harlan Sprague Dawley, Madison, WI). Mice were randomized into treatment groups consisting of at least 10 mice/group. E2 was administered via silastic capsules (1.0 cm) implanted subcutaneously between the scapulae. The 1.0 cm capsules produce a mean serum E2 level of 379.5 pg/ml (81) and were replaced every 8 weeks. Fulvestrant, ICI 182,780, (a generous gift from AstraZeneca Pharmaceuticals, Macclesfield, Cheshire, UK) was injected subcutaneously at a dose of 5 mg (0.1 ml peanut oil) per animal once per week. Tumor cross sectional area was determined weekly using Vernier calipers and calculated using the formula: length/2 X width/2 X π. Mean tumor area was plotted against time in weeks to monitor tumor growth. The mice were sacrificed by CO2 inhalation and cervical dislocation, tumors were excised and either immediately fixed in 10% buffered formalin for TUNEL assay, stored in RNAlater buffer (Ambion, Inc., Austin, TX) or snap frozen in liquid nitrogen and stored at -80°C. The Animal Care and Use Committee of the University of Illinois at Chicago approved all of the procedures involving animals.
Tumor and Cell Protein Isolation and Western Blot
Tumors were ground in liquid nitrogen into a fine powder and resuspended in cell lysis buffer (20 mM Tris-HCl, pH 7.5; 150 mM NaCl; 1 mM Na2EDTA; 1 mM EGTA; 1% Triton; 2.5 mM sodium pyrophosphate; 1 mM beta-glycerophosphate; 1 mM Na3VO4; 1 μg/ml leupeptin; 1mM PMSF; 2% glycerol) and homogenized. The tumor lysate was centrifuged at 12,000 RPM for 15 min. at 4°C. Protein concentration was determined by the BCA method (BioRad Laboratories, Hercules, CA) and was stored at -80°C. Equal amounts of protein were run in a standard western blot protocol using the following antibodies: Fas (B-10, Santa Cruz Biotech, Santa Cruz, CA), FasL (G2474, BD Pharmingin, San Jose, CA), phospho473-Akt and T-Akt (Cell Signaling Technology, Beverly, MA) ERα (G-20, Santa Cruz Biotech). All the antibodies were diluted in TBS-T (20mM Tris, 7.6; 137mM NaCl; 0.1% Tween20) containing 5% dry milk. Either the ECL Chemiluminescent Detection system (Amersham, Arlington Heights, IL) or the Supersignal West Dura western detection system (Pierce, Rockford, IL) was used to visualize the target band. Equal loading of total protein per lane was assessed by blotting with β-actin antibody (Sigma-Aldrich). Chemiluminescent signal was captured using a Chemi Doc™ Gel Documentation System (Bio-Rad Laboratories).
Assessment of Apoptosis
The identification of apoptotic cells in situ was determined using the ApopTag® TUNEL Apoptosis Detection kit (Chemicon International, Inc., Temecula, CA). This method detects DNA fragments by end-labeling 3′-hydroxyl DNA with digoxigenin using terminal deoxynucleotidyl transferase (TdT). An anti-digoxigenin antibody conjugated with peroxidase is bound and visualized with peroxidase substrate. Tissue sections of T47D:A18/PKCα tumors were 5-μm thick and spread on silanized slides. Paraffin-embedded tissue sections were deparaffinized and progressively rehydrated. Sections were then pretreated with proteinase K from Sigma-Aldrich (20 μg/ml for 20 min at room temperature). Endogenous peroxidase was blocked with 0.3% H2O2 in PBS. ApopTag® Plus Peroxidase In Situ Apoptosis Detection Kit (Chemicon) was then used according to the manufacturer's instructions. Staining of nuclei was expressed as the percentage of TUNEL-positive apoptotic cells in each tumor. TUNEL-positive cells were counted in 10 different high-power fields (X40) from 6 sections representing at least 3 independent tumors of each group. Repeated measures were obtained at 8, 12, and 15 days post-E2 capsule implantation.
Generation of T47D:A18/PKCα/Fas shRNA stable transfectant
T47D:A18/PKCα cells were transfected with MISSION™ shRNA lentiviral particles for Fas (Sigma-Aldrich, St. Louis, MO) following the manufacturer's instructions. T47D:A18/PKCα cells were suspended in culture medium (2 X 10⁴ cells/mL medium) and seeded in each well of a 12-well plate. After 30 hour incubation, media was removed and 1 mL fresh media with hexadimethrine bromide (8 μg/mL) (Sigma-Aldrich) was added. Hexadimethrine bromide was used to enhance transduction according to the manufacturer's instructions. Lentiviral transduction particles for Fas were provided in a set of 4 clones. For each clone, 4 μL of particles (4 X 10⁴ transducing units) were added into the wells. Media containing the lentiviral particles were removed and fresh media was added after 18 hr incubation at 37°C in a humidified atmosphere containing 5% CO2. Drug selections with puromycin (InvivoGen, San Diego CA) at 1 μg/mL and G418 (500 μg/mL) were started on the following day. T47D:A18/PKCα cells were transfected with MISSION™ non-target shRNA control transduction particles (Sigma-Aldrich) and selected in the same way to serve as a negative control. Individual colonies were picked following three weeks of selection and screened for Fas expression by Western blot.
Real Time PCR analysis of estrogen responsive genes
For each treatment and control 3 independent tumor samples were available. RNA was extracted using the Rneasy Mini kit (Qiagen, Valencia, CA) and reverse transcribed with the Retroscript kit (Ambion). Taqman Gene Expression Assays were purchased from Applied Biosystems (Foster City, CA). The following assays were used: HPRT1, cat.# Hs99999909_m1, C3, cat.# Hs00163811_m1, PGR, cat.# Hs01556702_m1, CTSD cat.# Hs00157205_m1, TFF1, cat.# Hs00907239_m1, TGFA, cat.# Hs00608187_m1. PCR reactions were run in duplicate to check for reproducibility, and the Ct values were averaged. The PCR reaction was conducted in an Applied Biosystems 7900HT Real-Time PCR System. The 20 μl reaction mix consisted of 1X Taqman Universal PCR master mix, 1X gene expression assay and 10 ng cDNA template. PCR conditions were 50°C for 2 minutes and 95 °C for 10 minutes followed by 40 cycles of 95 °C for 15 seconds and 60 °C for 1 minute. For data analysis, the comparative Ct method was used, with HPRT1 serving as housekeeping gene.
Transient transfection and luciferase assays
Prior to transient transfection, T47D:A18/neo and T47D:A18/PKCα cells were maintained for 3 days in phenol red free, E2-depleted RPMI-1640 media supplemented with G418. After stripping, cells were transiently transfected by electroporation as previously described, (37). Briefly, 8 X 10⁶ cells were harvested and resuspended in 0.5 mL of serum-free, phenol red free RPMI 1640 medium. ERE-tk-Luc plasmid containing the luciferase reporter gene controlled by the ERE (82) (5 μg) and β-galactosidase (β-gal, 1 μg) expressing plasmid pCMVβ were added to the cell suspension and incubated for 5 min at room temperature. The cells were pulsed at 250 volts at 950 mF, resuspended in whole culture medium, and incubated at 37°C in a humidified CO2 incubator overnight. On the following day, media containing E2 (10-9 M), E2-BSA conjugate (10-9 M) (Sigma-Aldrich) or vehicle (ethanol) were added.
Luciferase activities were measured using Luciferase Reporter Gene Assay System from Applied Biosystems (Bedford, MA). β-gal signals were measured with Galacto-Light Plus™ assay systems (Applied Biosystems, Bedford, MA). After 18 - 20 hours incubation, cells were washed with ice-cold PBS and lysed in the lysis buffer provided. The cell lysates were cleared by centrifugation and luciferase activity and β-gal signals were determined after adding corresponding substrates and read by a Monolight 2010 luminometer (Analytical Luminescence Laboratory, San Diego, CA). β-gal signals were applied to normalize the luciferase activity.
Statistical Analysis
Differences in mean tumor area between groups of three or more were measured using analysis of variance (ANOVA) test followed by Bonferroni Multiple Comparisons Test. Differences in three or more groups were measured using ANOVA followed by Tukey-Kramer Multiple Comparisons Post-Test. Unpaired Student's t-test was used to determine statistical significance between two groups and was used to analyze data obtained from the colony formation assays, TUNEL stain, and western blots. The GraphPad InStat Version 3.06 statistical software package was used (GraphPad Software, San Diego, CA) and SPSS 13, SPSS, Inc.(Chicago, IL). All statistical tests were two-sided.
Supplementary Material
Fig. 1: A., B.) Growth of T47D:A18/neo and T47D:A18/PKCα cells in growth factor-reduced Matrigel. A.) Cells were grown in phenol red-containing media and seeded into growth factor-reduced Matrigel. ***Comparison of the number of T47D:A18/neo colonies was statistically greater than the number of T47D:A18/PKCα colonies at P <0.001. B.) Cells were grown in phenol red-free RPMI and seeded into phenol red-free, growth factor-reduced Matrigel. Cells were either not treated (Control) or treated with E2 (10-9 M). ***Comparison of the number of colonies in the Control versus E2-treated cells was statistically different at P < 0.001.
Fig. 2.: Immunohistochemical analysis of T47D:A18/PKCα tumors at various days following E2 treatment. 40X magnification.
Acknowledgments
We are grateful to Dr. Mohamed Nasr for technical assistance and helpful discussions.
Grant support: This work was supported by the Susan G. Komen Breast Cancer Foundation and NIH RO1 CA122914 awarded to D.A.T.
References
- 1.Fisher B, Costantino JP, Wickerham DL, et al. Tamoxifen for prevention of breast cancer: report of the National Surgical Adjuvant Breast and Bowel Project P-1 Study. J Natl Cancer Inst. 1998;90(18):1371–88. doi: 10.1093/jnci/90.18.1371. [DOI] [PubMed] [Google Scholar]
- 2.Jordan VC. Designer estrogens. Sci Am. 1998;279(4):60–7. doi: 10.1038/scientificamerican1098-60. [DOI] [PubMed] [Google Scholar]
- 3.Ring A, Dowsett M. Mechanisms of tamoxifen resistance. Endocr Relat Cancer. 2004;11(4):643–58. doi: 10.1677/erc.1.00776. [DOI] [PubMed] [Google Scholar]
- 4.Encarnacion CA, Ciocca DR, McGuire WL, Clark GM, Fuqua SA, Osborne CK. Measurement of steroid hormone receptors in breast cancer patients on tamoxifen. Breast Cancer Res Treat. 1993;26(3):237–46. doi: 10.1007/BF00665801. [DOI] [PubMed] [Google Scholar]
- 5.Karnik PS, Kulkarni S, Liu XP, Budd GT, Bukowski RM. Estrogen receptor mutations in tamoxifen-resistant breast cancer. Cancer Res. 1994;54(2):349–53. [PubMed] [Google Scholar]
- 6.Robertson JF. Oestrogen receptor: a stable phenotype in breast cancer. Br J Cancer. 1996;73(1):5–12. doi: 10.1038/bjc.1996.2. [DOI] [PMC free article] [PubMed] [Google Scholar]
- 7.Osborne CK, Schiff R. Growth factor receptor cross-talk with estrogen receptor as a mechanism for tamoxifen resistance in breast cancer. Breast. 2003;12(6):362–7. doi: 10.1016/s0960-9776(03)00137-1. [DOI] [PubMed] [Google Scholar]
- 8.Kahlert S, Nuedling S, van Eickels M, Vetter H, Meyer R, Grohe C. Estrogen receptor alpha rapidly activates the IGF-1 receptor pathway. J Biol Chem. 2000;275(24):18447–53. doi: 10.1074/jbc.M910345199. [DOI] [PubMed] [Google Scholar]
- 9.Schiff R, Massarweh SA, Shou J, Bharwani L, Mohsin SK, Osborne CK. Cross-talk between estrogen receptor and growth factor pathways as a molecular target for overcoming endocrine resistance. Clin Cancer Res. 2004;10(1 Pt 2):331S–6S. doi: 10.1158/1078-0432.ccr-031212. [DOI] [PubMed] [Google Scholar]
- 10.Borg A, Baldetorp B, Ferno M, et al. ERBB2 amplification is associated with tamoxifen resistance in steroid- receptor positive breast cancer. Cancer Lett. 1994;81(2):137–44. doi: 10.1016/0304-3835(94)90194-5. [DOI] [PubMed] [Google Scholar]
- 11.Dowsett M. Overexpression of HER-2 as a resistance mechanism to hormonal therapy for breast cancer. Endocr Relat Cancer. 2001;8(3):191–5. doi: 10.1677/erc.0.0080191. [DOI] [PubMed] [Google Scholar]
- 12.Arpino G, Green SJ, Allred DC, et al. HER-2 amplification, HER-1 expression, and tamoxifen response in estrogen receptor-positive metastatic breast cancer: a southwest oncology group study. Clin Cancer Res. 2004;10(17):5670–6. doi: 10.1158/1078-0432.CCR-04-0110. [DOI] [PubMed] [Google Scholar]
- 13.Tangkeangsirisin W, Hayashi J, Serrero G. PC cell-derived growth factor mediates tamoxifen resistance and promotes tumor growth of human breast cancer cells. Cancer Res. 2004;64(5):1737–43. doi: 10.1158/0008-5472.can-03-2364. [DOI] [PubMed] [Google Scholar]
- 14.Jordan NJ, Gee JM, Barrow D, Wakeling AE, Nicholson RI. Increased constitutive activity of PKB/Akt in tamoxifen resistant breast cancer MCF-7 cells. Breast Cancer Res Treat. 2004;87(2):167–80. doi: 10.1023/B:BREA.0000041623.21338.47. [DOI] [PubMed] [Google Scholar]
- 15.Shoman N, Klassen S, McFadden A, Bickis MG, Torlakovic E, Chibbar R. Reduced PTEN expression predicts relapse in patients with breast carcinoma treated by tamoxifen. Mod Pathol. 2005;18(2):250–9. doi: 10.1038/modpathol.3800296. [DOI] [PubMed] [Google Scholar]
- 16.Coutts AS, Murphy LC. Elevated mitogen-activated protein kinase activity in estrogen-nonresponsive human breast cancer cells. Cancer Res. 1998;58(18):4071–4. [PubMed] [Google Scholar]
- 17.Gee JM, Robertson JF, Ellis IO, Nicholson RI. Phosphorylation of ERK1/2 mitogen-activated protein kinase is associated with poor response to anti-hormonal therapy and decreased patient survival in clinical breast cancer. Int J Cancer. 2001;95(4):247–54. doi: 10.1002/1097-0215(20010720)95:4<247::aid-ijc1042>3.0.co;2-s. [DOI] [PubMed] [Google Scholar]
- 18.Schiff R, Reddy P, Ahotupa M, et al. Oxidative stress and AP-1 activity in tamoxifen-resistant breast tumors In vivo. J Natl Cancer Inst. 2000;92(23):1926–34. doi: 10.1093/jnci/92.23.1926. [DOI] [PubMed] [Google Scholar]
- 19.Johnston SR, Lu B, Scott GK, et al. Increased activator protein-1 DNA binding and c-Jun NH2-terminal kinase activity in human breast tumors with acquired tamoxifen resistance. Clin Cancer Res. 1999;5(2):251–6. [PubMed] [Google Scholar]
- 20.Dumont JA, Bitonti AJ, Wallace CD, Baumann RJ, Cashman EA, Cross-Doersen DE. Progression of MCF-7 breast cancer cells to antiestrogen-resistant phenotype is accompanied by elevated levels of AP-1 DNA-binding activity. Cell Growth Differ. 1996;7(3):351–9. [PubMed] [Google Scholar]
- 21.Louie MC, Zou JX, Rabinovich A, Chen HW. ACTR/AIB1 functions as an E2F1 coactivator to promote breast cancer cell proliferation and antiestrogen resistance. Mol Cell Biol. 2004;24(12):5157–71. doi: 10.1128/MCB.24.12.5157-5171.2004. [DOI] [PMC free article] [PubMed] [Google Scholar]
- 22.Girault I, Lerebours F, Amarir S, et al. Expression analysis of estrogen receptor alpha coregulators in breast carcinoma: evidence that NCOR1 expression is predictive of the response to tamoxifen. Clin Cancer Res. 2003;9(4):1259–66. [PubMed] [Google Scholar]
- 23.Ingle JN, Ahmann DL, Green SJ, et al. Randomized clinical trial of diethylstilbestrol versus tamoxifen in postmenopausal women with advanced breast cancer. N Engl J Med. 1981;304(1):16–21. doi: 10.1056/NEJM198101013040104. [DOI] [PubMed] [Google Scholar]
- 24.Kennedy BJ. Massive estrogen administration in premenopausal women with advanced breast cancer. Cancer Chemother Rep. 1962;16:283–4. [PubMed] [Google Scholar]
- 25.Peethambaram PP, Ingle JN, Suman VJ, Hartmann LC, Loprinzi CL. Randomized trial of diethylstilbestrol vs. tamoxifen in postmenopausal women with metastatic breast cancer. An updated analysis Breast Cancer Res Treat. 1999;54(2):117–22. doi: 10.1023/a:1006185805079. [DOI] [PubMed] [Google Scholar]
- 26.Lonning PE, Taylor PD, Anker G, et al. High-dose estrogen treatment in postmenopausal breast cancer patients heavily exposed to endocrine therapy. Breast Cancer Res Treat. 2001;67(2):111–6. doi: 10.1023/a:1010619225209. [DOI] [PubMed] [Google Scholar]
- 27.Yao K, Lee ES, Bentrem DJ, et al. Antitumor action of physiological estradiol on tamoxifen-stimulated breast tumors grown in athymic mice. Clin Cancer Res. 2000;6(5):2028–36. [PubMed] [Google Scholar]
- 28.Song RX, Mor G, Naftolin F, et al. Effect of long-term estrogen deprivation on apoptotic responses of breast cancer cells to 17beta-estradiol. J Natl Cancer Inst. 2001;93(22):1714–23. doi: 10.1093/jnci/93.22.1714. [DOI] [PubMed] [Google Scholar]
- 29.Santen RJ, Song RX, Zhang Z, Yue W, Kumar R. Adaptive hypersensitivity to estrogen: mechanism for sequential responses to hormonal therapy in breast cancer. Apoptotic action of estrogen Clin Cancer Res. 2004;10(1 Pt 2):337S–45S. doi: 10.1158/1078-0432.ccr-031207. [DOI] [PubMed] [Google Scholar]
- 30.Lewis JS, Osipo C, Meeke K, et al. Estrogen-induced apoptosis in a breast cancer model resistant to long-term estrogen withdrawal. J Steroid Biochem Mol Biol. 2005;94(13):131–41. doi: 10.1016/j.jsbmb.2004.12.032. [DOI] [PubMed] [Google Scholar]
- 31.Chisamore MJ, Ahmed Y, Bentrem DJ, Jordan VC, Tonetti DA. Novel antitumor effect of estradiol in athymic mice injected with a T47D breast cancer cell line overexpressing protein kinase calpha. Clin Cancer Res. 2001;7(10):3156–65. [PubMed] [Google Scholar]
- 32.Shim WS, Conaway M, Masamura S, et al. Estradiol hypersensitivity and mitogen-activated protein kinase expression in long-term estrogen deprived human breast cancer cells in vivo. Endocrinology. 2000;141(1):396–405. doi: 10.1210/endo.141.1.7270. [DOI] [PubMed] [Google Scholar]
- 33.Osipo C, Gajdos C, Liu H, Chen B, Jordan VC. Fulvestrant reverses estradiol-induced regression of tamoxifen-stimulated breast cancer by regulating Fas, HER2/neu, and NF-kB. Journal of the National Cancer Institute. 2003;95:1597–608. doi: 10.1093/jnci/djg079. [DOI] [PubMed] [Google Scholar]
- 34.Liu H, Lee ES, Gajdos C, et al. Apoptotic action of 17beta-estradiol in raloxifene-resistant MCF-7 cells in vitro and in vivo. J Natl Cancer Inst. 2003;95(21):1586–97. doi: 10.1093/jnci/djg080. [DOI] [PubMed] [Google Scholar]
- 35.Curtin JF, Cotter TG. Live and let die: regulatory mechanisms in Fas-mediated apoptosis. Cell Signal. 2003;15(11):983–92. doi: 10.1016/s0898-6568(03)00093-7. [DOI] [PubMed] [Google Scholar]
- 36.Toillon RA, Descamps S, Adriaenssens E, et al. Normal breast epithelial cells induce apoptosis of breast cancer cells via Fas signaling. Exp Cell Res. 2002;275(1):31–43. doi: 10.1006/excr.2002.5490. [DOI] [PubMed] [Google Scholar]
- 37.Tonetti DA, Chisamore MJ, Grdina W, Schurz H, Jordan VC. Stable transfection of protein kinase C alpha cDNA in hormone-dependent breast cancer cell lines. Br J Cancer. 2000;83(6):782–91. doi: 10.1054/bjoc.2000.1326. [DOI] [PMC free article] [PubMed] [Google Scholar]
- 38.Tonetti DA, Morrow M, Kidwai N, Gupta A, Badve S. Elevated protein kinase C alpha expression may be predictive of tamoxifen treatment failure. Br J Cancer. 2003;88(9):1400–2. doi: 10.1038/sj.bjc.6600923. [DOI] [PMC free article] [PubMed] [Google Scholar]
- 39.Dempsey EC, Newton AC, Mochly-Rosen D, et al. Protein kinase C isozymes and the regulation of diverse cell responses. Am J Physiol Lung Cell Mol Physiol. 2000;279(3):L429–38. doi: 10.1152/ajplung.2000.279.3.L429. [DOI] [PubMed] [Google Scholar]
- 40.Mackay HJ, Twelves CJ. Protein kinase C: a target for anticancer drugs? Endocr Relat Cancer. 2003;10(3):389–96. doi: 10.1677/erc.0.0100389. [DOI] [PubMed] [Google Scholar]
- 41.Nabha SM, Glaros S, Hong M, et al. Upregulation of PKC-delta contributes to antiestrogen resistance in mammary tumor cells. Oncogene. 2005;24(19):3166–76. doi: 10.1038/sj.onc.1208502. [DOI] [PubMed] [Google Scholar]
- 42.Borner C, Wyss R, Regazzi R, Eppenberger U, Fabbro D. Immunological quantitation of phospholipid/Ca2+-dependent protein kinase of human mammary carcinoma cells: inverse relationship to estrogen receptors. Int J Cancer. 1987;40(3):344–8. doi: 10.1002/ijc.2910400310. [DOI] [PubMed] [Google Scholar]
- 43.Fournier DB, Chisamore M, Lurain JR, Rademaker AW, Jordan VC, Tonetti DA. Protein kinase C alpha expression is inversely related to ER status in endometrial carcinoma: possible role in AP-1-mediated proliferation of ER-negative endometrial cancer. Gynecol Oncol. 2001;81(3):366–72. doi: 10.1006/gyno.2001.6164. [DOI] [PubMed] [Google Scholar]
- 44.Ways DK, Kukoly CA, deVente J, et al. MCF-7 breast cancer cells transfected with protein kinase C-alpha exhibit altered expression of other protein kinase C isoforms and display a more aggressive neoplastic phenotype. J Clin Invest. 1995;95(4):1906–15. doi: 10.1172/JCI117872. [DOI] [PMC free article] [PubMed] [Google Scholar]
- 45.Manni A, Buckwalter E, Etindi R, et al. Induction of a less aggressive breast cancer phenotype by protein kinase c-α and -β overexpression. Cell Growth & Differentiation. 1996;7:1187–98. [PubMed] [Google Scholar]
- 46.Assender J, Gee J, Lewis I, IO E, Robertson JF, Nicholson RI. Protein kinase C isoform expression as a predictor of disease outcome on endocrine therapy in breast cancer. J Clin Pathol. 2007;60(11):1216–21. doi: 10.1136/jcp.2006.041616. [DOI] [PMC free article] [PubMed] [Google Scholar]
- 47.Frankel LB, Lykkesfeldt AE, Hansen JB, Stenvang J. Protein Kinase C alpha is a marker for antiestrogen resistance and is involved in the growth of tamoxifen resistant human breast cancer cells. Breast Cancer Res Treat. 2007;104(2):165–79. doi: 10.1007/s10549-006-9399-1. [DOI] [PubMed] [Google Scholar]
- 48.Jordan VC, Osipo C, Schafer JM, Fox JE, Cheng D, Liu H. Changing role of the oestrogen receptor in the life and death of breast cancer cells. Breast. 2003;12(6):432–41. doi: 10.1016/s0960-9776(03)00149-8. [DOI] [PubMed] [Google Scholar]
- 49.Wijayaratne AL, McDonnell DP. The human estrogen receptor-alpha is a ubiquitinated protein whose stability is affected differentially by agonists, antagonists, and selective estrogen receptor modulators. J Biol Chem. 2001;276(38):35684–92. doi: 10.1074/jbc.M101097200. [DOI] [PubMed] [Google Scholar]
- 50.Seo HS, Larsimont D, Querton G, et al. Estrogenic and anti-estrogenic regulation of estrogen receptor in MCF-7 breast-cancer cells: comparison of immunocytochemical data with biochemical measurements. Int J Cancer. 1998;78(6):760–5. doi: 10.1002/(sici)1097-0215(19981209)78:6<760::aid-ijc14>3.0.co;2-u. [DOI] [PubMed] [Google Scholar]
- 51.Van Den Bemd GJ, Kuiper GG, Pols HA, Van Leeuwen JP. Distinct effects on the conformation of estrogen receptor alpha and beta by both the antiestrogens ICI 164,384 and ICI 182,780 leading to opposite effects on receptor stability. Biochem Biophys Res Commun. 1999;261(1):1–5. doi: 10.1006/bbrc.1999.0864. [DOI] [PubMed] [Google Scholar]
- 52.Reid G, Hubner MR, Metivier R, et al. Cyclic, proteasome-mediated turnover of unliganded and liganded ERalpha on responsive promoters is an integral feature of estrogen signaling. Mol Cell. 2003;11(3):695–707. doi: 10.1016/s1097-2765(03)00090-x. [DOI] [PubMed] [Google Scholar]
- 53.Nardulli AM, Katzenellenbogen BS, Monsma FJ, Jr, Miller MA, Ziegler YS, Katzenellenbogen JA. Dynamics of estrogen receptor turnover in uterine cells in vitro and in uteri in vivo. doi: 10.1210/endo-119-5-2038. [DOI] [PubMed] [Google Scholar]; Characterization of the estrogen receptor and its dynamics in MCF-7 human breast cancer cells using a covalently attaching antiestrogen. Endocrinology. 1986;119(5):2038–46. doi: 10.1210/endo-115-1-143. [DOI] [PubMed] [Google Scholar]
- 54.Dauvois S, White R, Parker MG. The antiestrogen ICI 182780 disrupts estrogen receptor nucleocytoplasmic shuttling. J Cell Sci. 1993;106(Pt 4):1377–88. doi: 10.1242/jcs.106.4.1377. [DOI] [PubMed] [Google Scholar]
- 55.Ingle JN. Estrogen as therapy for breast cancer. Breast Cancer Res. 2002;4(4):133–6. doi: 10.1186/bcr436. [DOI] [PMC free article] [PubMed] [Google Scholar]
- 56.Osipo C, Gajdos C, Cheng D, et al. Reversal of tamoxifen resistant breast cancer by low dose estrogen therapy. J Steroid Biochem Mol Biol. 2005;93(25):249–56. doi: 10.1016/j.jsbmb.2004.12.005. [DOI] [PubMed] [Google Scholar]
- 57.Song RX, Santen RJ. Apoptotic action of estrogen. Apoptosis. 2003;8(1):55–60. doi: 10.1023/a:1021649019025. [DOI] [PubMed] [Google Scholar]
- 58.Ingle JN. Sequencing of endocrine therapy in postmenopausal women with advanced breast cancer. Clin Cancer Res. 2004;10(1 Pt 2):362S–7S. doi: 10.1158/1078-0432.ccr-031200. [DOI] [PubMed] [Google Scholar]
- 59.Romanova LY, Alexandrov IA, Nordan RP, Blagosklonny MV, Mushinski JF. Cross-talk between protein kinase C-alpha (PKC-alpha) and -delta (PKC-delta): PKC-alpha elevates the PKC-delta protein level, altering its mRNA transcription and degradation. Biochemistry. 1998;37(16):5558–65. doi: 10.1021/bi9731807. [DOI] [PubMed] [Google Scholar]
- 60.Lin X, Yu Y, Zhao H, Zhang Y, Manela J, Tonetti DA. Overexpression of PKC alpha is required to impart estradiol inhibition and tamoxifen-resistance in a T47D human breast cancer tumor model. Carcinogenesis. 2006;27(8):1538–46. doi: 10.1093/carcin/bgl002. [DOI] [PubMed] [Google Scholar]
- 61.Faridi J, Wang L, Endemann G, Roth RA. Expression of constitutively active Akt-3 in MCF-7 breast cancer cells reverses the estrogen and tamoxifen responsivity of these cells in vivo. Clin Cancer Res. 2003;9(8):2933–9. [PubMed] [Google Scholar]
- 62.Weigelt B, Bissell MJ. Unraveling the microenvironmental influences on the normal mammary gland and breast cancer. Semin Cancer Biol. 2008;18(5):311–21. doi: 10.1016/j.semcancer.2008.03.013. [DOI] [PMC free article] [PubMed] [Google Scholar]
- 63.Ivaska J, Kermorgant S, Whelan R, Parsons M, Ng T, Parker PJ. Integrin-protein kinase C relationships. Biochem Soc Trans. 2003;31(Pt 1):90–3. doi: 10.1042/bst0310090. [DOI] [PubMed] [Google Scholar]
- 64.Carey I, Williams CL, Ways DK, Noti JD. Overexpression of protein kinase C-alpha in MCF-7 breast cancer cells results in differential regulation and expression of alphavbeta3 and alphavbeta5. Int J Oncol. 1999;15(1):127–36. doi: 10.3892/ijo.15.1.127. In Process Citation. [DOI] [PubMed] [Google Scholar]
- 65.Noti JD, Johnson AK. Integrin alpha 5 beta 1 suppresses apoptosis triggered by serum starvation but not phorbol ester in MCF-7 breast cancer cells that overexpress protein kinase C-alpha. Int J Oncol. 2001;18(1):195–201. doi: 10.3892/ijo.18.1.195. [DOI] [PubMed] [Google Scholar]
- 66.Parsons M, Keppler MD, Kline A, et al. Site-directed perturbation of protein kinase C-integrin interaction blocks carcinoma cell chemotaxis. Mol Cell Biol. 2002;22(16):5897–911. doi: 10.1128/MCB.22.16.5897-5911.2002. [DOI] [PMC free article] [PubMed] [Google Scholar]
- 67.Keum E, Kim Y, Kim J, et al. Syndecan-4 regulates localization, activity and stability of protein kinase C-alpha. Biochem J. 2004;378(Pt 3):1007–14. doi: 10.1042/BJ20031734. [DOI] [PMC free article] [PubMed] [Google Scholar]
- 68.Lim ST, Longley RL, Couchman JR, Woods A. Direct binding of syndecan-4 cytoplasmic domain to the catalytic domain of protein kinase C alpha (PKC alpha) increases focal adhesion localization of PKC alpha. J Biol Chem. 2003;278(16):13795–802. doi: 10.1074/jbc.M208300200. [DOI] [PubMed] [Google Scholar]
- 69.Morris C, Wakeling A. Fulvestrant (‘Faslodex’)-a new treatment option for patients progressing on prior endocrine therapy. Endocr Relat Cancer. 2002;9(4):267–76. doi: 10.1677/erc.0.0090267. [DOI] [PubMed] [Google Scholar]
- 70.Long X, Nephew KP. Fulvestrant (ICI 182,780)-dependent interacting proteins mediate immobilization and degradation of estrogen receptor-alpha. J Biol Chem. 2006;281(14):9607–15. doi: 10.1074/jbc.M510809200. [DOI] [PubMed] [Google Scholar]
- 71.Levin ER. Integration of the extranuclear and nuclear actions of estrogen. Mol Endocrinol. 2005;19(8):1951–9. doi: 10.1210/me.2004-0390. [DOI] [PMC free article] [PubMed] [Google Scholar]
- 72.Thomas P, Pang Y, Filardo EJ, Dong J. Identity of an estrogen membrane receptor coupled to a G protein in human breast cancer cells. Endocrinology. 2005;146(2):624–32. doi: 10.1210/en.2004-1064. [DOI] [PubMed] [Google Scholar]
- 73.Migliaccio A, Castoria G, Di Domenico M, et al. Steroid-induced androgen receptor-oestradiol receptor beta-Src complex triggers prostate cancer cell proliferation. Embo J. 2000;19(20):5406–17. doi: 10.1093/emboj/19.20.5406. [DOI] [PMC free article] [PubMed] [Google Scholar]
- 74.Levin ER, Pietras RJ. Estrogen receptors outside the nucleus in breast cancer. Breast Cancer Res Treat. 2008;108(3):351–61. doi: 10.1007/s10549-007-9618-4. [DOI] [PubMed] [Google Scholar]
- 75.Alzamora R, Harvey BJ. Direct binding and activation of protein kinase C isoforms by steroid hormones. Steroids. 2008;73(910):885–8. doi: 10.1016/j.steroids.2008.01.001. [DOI] [PubMed] [Google Scholar]
- 76.Yang JZ, O'Flatharta C, Harvey BJ, Thomas W. Membrane ERalpha-dependent activation of PKCalpha in endometrial cancer cells by estradiol. Steroids. 2008;73(11):1110–22. doi: 10.1016/j.steroids.2008.04.012. [DOI] [PubMed] [Google Scholar]
- 77.Saville B, Wormke M, Wang F, et al. Ligand-, cell-, and estrogen receptor subtype (alpha/beta)-dependent activation at GC-rich (Sp1) promoter elements. J Biol Chem. 2000;275(8):5379–87. doi: 10.1074/jbc.275.8.5379. [DOI] [PubMed] [Google Scholar]
- 78.Kushner PJ, Agard DA, Greene GL, et al. Estrogen receptor pathways to AP-1. J Steroid Biochem Mol Biol. 2000;74(5):311–7. doi: 10.1016/s0960-0760(00)00108-4. [DOI] [PubMed] [Google Scholar]
- 79.Roychowdhury D, Lahn M. Antisense therapy directed to protein kinase C-alpha (Affinitak, LY900003/ISIS 3521): potential role in breast cancer. Semin Oncol. 2003;30(2 Suppl 3):30–3. doi: 10.1053/sonc.2003.37273. [DOI] [PubMed] [Google Scholar]
- 80.Pink JJ, Bilimoria MM, Assikis J, Jordan VC. Irreversible loss of the oestrogen receptor in T47D breast cancer cells following prolonged oestrogen deprivation. Br J Cancer. 1996;74(8):1227–36. doi: 10.1038/bjc.1996.521. published erratum appears in Br J Cancer 1997;75(10):1557. [DOI] [PMC free article] [PubMed] [Google Scholar]
- 81.O'Regan RM, Cisneros A, England GM, et al. Effects of the antiestrogens tamoxifen, toremifene, and ICI 182,780 on endometrial cancer growth. J Natl Cancer Inst. 1998;90(20):1552–8. doi: 10.1093/jnci/90.20.1552. [DOI] [PubMed] [Google Scholar]
- 82.Catherino WH, Jordan VC. Increasing the number of tandem estrogen response elements increases the estrogenic activity of a tamoxifen analogue. Cancer Lett. 1995;92(1):39–47. doi: 10.1016/0304-3835(95)03755-l. [DOI] [PubMed] [Google Scholar]
Associated Data
This section collects any data citations, data availability statements, or supplementary materials included in this article.
Supplementary Materials
Fig. 1: A., B.) Growth of T47D:A18/neo and T47D:A18/PKCα cells in growth factor-reduced Matrigel. A.) Cells were grown in phenol red-containing media and seeded into growth factor-reduced Matrigel. ***Comparison of the number of T47D:A18/neo colonies was statistically greater than the number of T47D:A18/PKCα colonies at P <0.001. B.) Cells were grown in phenol red-free RPMI and seeded into phenol red-free, growth factor-reduced Matrigel. Cells were either not treated (Control) or treated with E2 (10-9 M). ***Comparison of the number of colonies in the Control versus E2-treated cells was statistically different at P < 0.001.
Fig. 2.: Immunohistochemical analysis of T47D:A18/PKCα tumors at various days following E2 treatment. 40X magnification.