

Abstract
Multiphoton fluorescence lifetime imaging microscopy (FLIM) is a noninvasive, cellular resolution, three-dimensional functional imaging technique. This study investigates the potential for in vivo pre-cancer diagnosis with metabolic imaging via multiphoton FLIM of the endogenous metabolic co-factor, NADH. The dimethylbenz[α]anthracene (DMBA)-treated hamster cheek pouch model of oral carcinogenesis and MCF10A cell monolayers were imaged using multiphoton FLIM at 780 nm excitation. The cytoplasm of normal hamster cheek pouch epithelial cells had short (0.29 ± 0.03 ns) and long lifetime components (2.03 ± 0.06 ns), attributed to free and protein-bound NADH, respectively. Low grade pre-cancers (mild to moderate dysplasia) and high grade pre-cancers (severe dysplasia and carcinoma in situ) were discriminated from normal tissues by their decreased protein-bound NADH lifetime (p<0.05). Inhibition of cellular glycolysis and oxidative phosphorylation in cell monolayers produced an increase and decrease, respectively, in the protein-bound NADH lifetime (p<0.05). The results of this study indicate that the decrease in protein-bound NADH lifetime with dysplasia is due to a shift from oxidative phosphorylation to glycolysis, consistent with the predictions of neoplastic metabolism. This study demonstrates that multiphoton FLIM is a powerful tool for the non-invasive characterization and detection of epithelial pre-cancers in vivo.
Keywords: metabolism, oral cancer, multiphoton microscopy, animal model
Introduction
Fluorescence lifetime imaging microscopy (FLIM) is a functional imaging technique that probes the excited state lifetime of a fluorophore. The excited state lifetime can be altered by the fluorophore microenvironment, including factors such as local pH, temperature, viscosity and oxygen concentration (1). FLIM, which relies on the temporally resolved fluorescence signal, is advantageous over fluorescence intensity or spectral measurements for small volume tissue imaging because it is independent of fluorophore concentration, and minimally affected by tissue absorption and scattering, and fluctuations in excitation intensity (2). Multiphoton excited FLIM can generate three-dimensional images of fluorophore lifetimes with cellular and sub-cellular resolution (1). The near infrared (NIR) excitation used in multiphoton microscopy (3) allows for greater penetration depths (4) and improved tissue viability (5) compared to single-photon excitation. An intuitive application of multiphoton FLIM is to exploit the endogenous fluorescence contrast from electron carriers, reduced nicotinamide adenine dinucleotide (NADH) and flavin adenine dinucleotide (FAD) already present in tissue for the early detection of cancer.
One of the hallmarks of carcinogenesis is a shift from cellular oxidative phosphorylation to cellular glycolysis for ATP production (Warburg Effect (6, 7)). The endogenous fluorophore NADH is the principal electron acceptor in glycolysis and electron donor in oxidative energy metabolism. NADH has a short and long lifetime component, respectively depending on whether it is in a free or protein-bound state (8). The short lifetime of NADH in its free state is due to dynamic quenching by the adenine moiety (2). Many enzymes bind to NADH in the metabolic pathway (9), and as favored metabolic pathways shift with cancer progression, the distribution of NADH binding sites change (10). The fluorescence lifetime of protein-bound NADH changes depending on the enzyme it is bound to (11). This suggests that changes in metabolism with cancer development can be probed by the lifetime of protein-bound NADH.
The goal of our work was to exploit multiphoton FLIM of protein-bound NADH for metabolic imaging of epithelial pre-cancers in vivo. To our knowledge, this is the first study to image changes in the lifetime of protein-bound NADH and relative abundance of free and protein-bound NADH with neoplastic progression in vivo. The study described in this paper consists of two parts. In the first part of the study, changes in the lifetime of protein-bound NADH and relative abundance of free and protein-bound NADH with inhibition of specific metabolic pathways were quantified. Specifically, multiphoton FLIM was carried out on an MCF10A cell culture model before and after inhibition with 3-bromopyruvate or cobalt chloride (CoCl2). Glycolysis was inhibited with 3-bromopyruvate, which inhibits glyceraldehyde-3-phosphate dehydrogenase and 3-phosphoglycerate kinase in a competitive manner (12, 13). Oxidative phosphorylation was inhibited with CoCl2, which mimics hypoxia by increasing the generation of reactive oxygen species during normoxia; up-regulating hypoxia-inducible factor-1α, erythropoietin, and glycolytic enzymes (14, 15). CoCl2 and 3-bromopyruvate produced a decrease and increase, respectively in the lifetime of protein-bound NADH, and both perturbations produced a decrease in the abundance of protein-bound NADH relative to free NADH. The results of these characterization studies suggest that protein-bound NADH fluorescence lifetimes would be particularly sensitive to changes in glycolysis and/or oxidative phosphorylation.
In the second part of the study, multiphoton FLIM was used to investigate the lifetime of protein-bound NADH and the relative abundance of free and protein-bound NADH in normal and dysplastic tissues in the dimethylbenz[α]anthracene (DMBA)- treated hamster cheek pouch model of carcinogenesis at 780 nm excitation. The DMBA treated hamster cheek pouch model was selected for this study because it has been shown to mimic the dysplasia-carcinoma sequence in the human oral cavity (16–18) and different stages of dysplasia and carcinoma can be examined over a relatively short period of time. The results of this study indicate that the protein-bound NADH lifetime decreases with low grade pre-cancers (mild to moderate dysplasia) and high grade pre-cancers (severe dysplasia and carcinoma in situ (CIS)) compared to normal tissues, and the abundance of protein-bound NADH relative to free NADH decreases with low grade pre-cancers in vivo.
Materials and Methods
Imaging Instrumentation
Two separate custom designed multiphoton time-domain lifetime systems were employed at the University of Wisconsin for the cell culture and in vivo experiments. The system used for cell culture experiments was constructed around a Nikon Eclipse TE300 (19). A titanium-sapphire laser (Spectra-Physics-Millennium/Tsunami, 82 MHz, 100 fs) pumped by a 5 W Millenia was used as an excitation source at 780 nm excitation for FLIM, and at both 780 nm and 890 nm excitation for intensity redox imaging. Other components include a Nikon 40x Plan Apo oil-immersion lens (N.A. =1.3), and a dichromatic mirror (BG39, Schott, Elmsford, NY) that allowed the 780 nm excitation light to reflect onto the sample and wavelengths between 400 nm and 600 nm to transmit to the detector. Intensity and FLIM data were collected pixel-by-pixel by a laser scanning unit (based on a BioRad, MRC-600) and a GaAsP photon counting PMT (H7422, Hamamatsu) connected to a time correlated single photon counting (TCSPC) system (SPC-730, Becker & Hickl).
All in vivo multiphoton FLIM images were collected with a second system constructed around a Nikon Diaphot 200 microscope (20). The excitation source is a titanium-sapphire laser (Coherent, Mira; 76 MHz, 120 fs) pumped by an 8 W solid-state laser (Coherent, Verdi). Other components include a 60x oil immersion objective (Nikon, PlanApo NA=1.4), and a dichromatic mirror (650DCSP, Chroma Technology, Rockingham, VT) to reflect the 780 nm excitation light onto the sample and transmit wavelengths between 400 nm and 650 nm to the detector. FLIM data were collected pixel-by-pixel with a laser scanning unit (BioRad, MRC-600), a fast photon-counting PMT (Becker & Hickl, PMH-100), and TCSPC electronics (Becker & Hickl, SPC-830). To control the power coupled to the system, a variable neutral density filter wheel was positioned before the entrance to the scanning unit. Acquisition for both systems was done with WiscScan (21), a lab developed software package.
Cell Culture Perturbation Experiments
MCF10A cells were obtained from the American Type Culture Collection (22). The cells remained free of Mycoplasma and other contaminants and were propagated by adherent culture according to established protocols (23). MCF10A cells were grown in DMEM- F12 supplemented with 5% horse serum, 20 ng/mL epidermal growth factor, 10 μg/mL insulin, and 0.5 mg/mL hydrocortisone. Plated cells were stored in a 10% CO2 incubator at 37°C and cultured every 3 to 4 days. Cells were detached from the flasks by trypsinization and triply washed in 10 mL of PBS. A hemacytometer was used to determine the concentration of the cells by counting the number of cells per milliliter. Upon determination of the concentration of the cells, the volumes required to plate 25,000 and 1,000,000 cells per dish were calculated, respectively. MCF10A cells at the two different densities were plated on lysine coated cover glass bottom Petri dishes (size, 35 mm; P35G-0–41-C, MatTek, Ashland, MA) and immersed in their standard growth media. Two different cell concentrations were used for these experiments because previous work has shown that the lifetime of NADH in cell culture depends on the cell confluency (due to changes in metabolism with cell confluency) (24).
Redox ratio images (25), which are defined as the fluorescence intensity of FAD divided by the sum of the fluorescence intensities of FAD and NADH, can be used to measure relative changes in the oxidation-reduction state of cells. Redox ratio imaging was used to verify that the concentrations and incubation times of 3-bromopyruvate and CoCl2 produced changes in cellular metabolism. Cells were either left untreated (control), treated with 300 μM 3-bromopyruvate (Sigma-Aldrich, St. Louis, MO) for 60 to 90 minutes to inhibit glycolysis, or treated with 200 μM CoCl2 (Sigma-Aldrich, St. Louis, MO) for 60 to 90 minutes to inhibit oxidative phosphorylation, as verified by changes in the redox ratio. NADH lifetime and intensity images were collected at a two-photon excitation wavelength of 780 nm and FAD intensity images were collected at 890 nm excitation, (26). At the completion of the final image acquisition, cell viability was confirmed under light microscopy (using the same microscope) by trypan blue exclusion. All cell dishes remained viable throughout any given imaging session.
The average power for the cell imaging experiments was approximately 15 mW, and the scan area for each image plane was 256×256 pixels (165×165 μm). Single photon counting was done at a rate of approximately 500 × 105 photons/s for a total of 60 seconds with a pixel dwell time of approximately 11.5 μs (i.e., 11.5 μs dwell time on each of 256×256 pixels). Thus, over ~80 frames were averaged to generate each image. Photon count rates at the beginning and end of image acquisition were monitored to ensure that photobleaching did not occur. The instrument response function (IRF) was measured using a second harmonic generated signal from a β-BaB2O4 crystal (20). The full width at half maximum (FWHM) of the IRF was 0.313 ns for the cell culture experiments. This represents the IRF of the overall system where the components that mainly contribute to temporal degradation are the transient time spread of the detector, optical dispersion at mirrors and through lenses, and light scattering at diaphragms.
DMBA-Treated Hamster Cheek Pouch Model of Oral Cancer
A total of 13 DMBA-treated and 9 control male Golden Syrian hamsters were evaluated in this study (average weight: 156 ±13 g). Animal care and procedures were in accordance with the guidelines in the U.S. Department of Health and Human Services and National Institutes of Health “Guide for the Care and Use of Laboratory Animals” and approved by the Institutional Animal Care and Use Committee at the University of Wisconsin. For each hamster, the right cheek pouch was either treated three times per week with 0.5% DMBA (by weight, Sigma-Aldrich, St. Louis, MO) in mineral oil (DMBA-treated animals), or the right cheek pouch was treated at the same frequency with mineral oil only (control animals) for a total of 16 weeks. The treatment schedule and procedures were established from previous studies (27, 28). At 16–21 weeks after the commencement of DMBA or mineral oil treatment, the cheek pouch of each animal was imaged using multiphoton FLIM at an excitation wavelength of 780 nm, which falls within the absorption band of NADH (26). This wavelength was also selected because statistically significant differences in tissue fluorescence intensity have been observed between normal tissues, dysplasias and carcinomas in the hamster cheek pouch model with multiphoton microscopy at a two-photon excitation wavelength of 780 nm (28).
Prior to imaging, each hamster was anesthetized with an intra-peritoneal injection of a mixture of 2.5 mg/kg acepromazine, 200 mg/kg ketamine, and 5 mg/kg xylazine. Next, the cheek pouch was inverted and stretched over an 8 mm diameter cork, pinned to the sides of the cork with two 27-gauge needles, and then wiped with saline. A cover slip was secured on the objective side of a 10 mm diameter opening in the imaging stage using Vaseline. The animal was placed on its stomach, and the cork was secured to the imaging stage of the inverted microscope such that the cheek was flush against the cover slip. The microscope objective was centered within the 10 mm opening of the imaging stage prior to image collection.
The average power incident on the sample ranged from approximately 3.3 – 7.2 mW. Single photon counting was done at a rate of approximately 500 × 105 photons/s for 45 seconds to 5 minutes with a pixel dwell time of approximately 6.25 μs. The scan area at each image plane was 256×256 pixels (140×140 μm). Photon count rates at the beginning and end of image acquisition were monitored to ensure that photobleaching did not occur. The image z-stacks were generated using a 10 μm z-step size.
To ensure instrument consistency between experimental days, the lifetime of a known and stable instrument standard, 20 μm diameter Fluoresbrite YG (yellow green) microspheres (Polysciences Inc.) was imaged at the beginning of each day of the in vivo experiments (n=14). The microspheres were measured under the same experimental conditions as the in vivo measurements, except the power at the sample and the integration time were adjusted to achieve a single photon count rate of approximately 500 × 105 from the significantly brighter microspheres. The lifetime decay curves measured from the microspheres were fit to a single exponential decay model using SPCImage software (see below). The average lifetime for the microspheres (n=14) was 2.13 ± 0.11 ns. The measured value for the lifetime of these spheres is consistent with that reported in other studies (~2.2 ± 0.1 ns) (24, 29). The IRF measured using a second harmonic generated signal from a β-BaB2O4 crystal had a FWHM of 0.190 ± 0.002 ns for the in vivo experiments. The IRF for the in vivo experiments differs from that of the cell culture experiments due to different detectors and optical paths in the two multiphoton FLIM systems.
After in vivo imaging, a biopsy was taken from the imaged site (center of the 10 mm stage opening) with a 3 mm diameter dermal biopsy punch. The biopsy was placed in 10% buffered formalin and submitted for histopathology. The tissue biopsies were cut and stained with hematoxylin and eosin (H&E), and read by a board certified veterinary pathologist (Annette Gendron-Fitzpatrick). Diagnosis was based on established criteria (30), with tissues assigned to one of the following categories: normal, hyperplasia, mild dysplasia, moderate dysplasia, severe dysplasia, papillary hyperplasia/papilloma, carcinoma in situ (CIS), or squamous cell carcinoma (SCC). The diagnosis for a given biopsy was determined from an evaluation of multiple sections cut from that biopsy. If any of these tissue biopsies were found to have more than one diagnosis (for example, severe dysplasia and SCC), the most severe diagnosis was assigned to that biopsy. FLIM images were taken from a microscopic field of view (140×140 μm), thus it was difficult to mark the precise image site on the biopsy. The approach taken in this study was to assign a diagnosis to each image stack based on the most severe pathologic diagnosis of the entire corresponding biopsy sample. This approach was consistent with that reported in our previous study which employed multiphoton microscopy to characterize the NADH intensity in the hamster cheek pouch model of carcinogenesis (28).
Analysis of the Fluorescence Lifetime Decay Curves
SPCImage software (Becker & Hickl) was used to analyze the fluorescence lifetime decay curves (24). First, the measured lifetime decay curve was binned over the pixel of interest and the 8 nearest neighbor pixels. Each set of binned pixels was fit independently. Next, the measured instrument response was convolved with the model, and this reconvolved model was fit to the measured lifetime decay curve for a given set of binned pixels. This produced a lifetime decay curve with a peak value of approximately 100 counts. The lifetime decay curve of the pixel of interest was then fit to a double-exponential decay model shown below.
F(t) is the fluorescence intensity at time t after the excitation light has ceased, τ1 and τ2 are the fluorophore lifetimes (τ1 is the short lifetime component and τ2 is the long lifetime component), and α1 and α2 are the relative contributions of the lifetime components (i.e. α1 + α2 = 100%), and C is a constant pertaining to the level ofbackground light present in most practical situations. The lifetime for the pixel of interest was calculated by finding the global minimum of the χ2 value. The minimum calculated lifetime constrained by the fit model in SPCImage was 0.1 ns, which is close to the temporal response of the multiphoton FLIM system. The mean and standard deviation of the χ2 value (a χ2 value close to one indicates a good fit) for the entire field of view of all in vivo hamster cheek pouch images and in vitro cell culture image planes was 1.05 ± 0.05 and 1.01 ± 0.01, respectively. A survey of χ2 values on a few samples indicated that the double-exponential decay model improved the χ2 value of the fit over the single-exponential decay model, and the triple-exponential decay model did not improve theχ2 value of the fit compared to the double-exponential decay model. The presence of two distinctly different lifetimes for free and protein-bound NADH (8, 31) also indicates that NADH fluorescence decay curves are best fit to a double-exponential decay model. Simulated fluorescence lifetime decay curves indicate that the τ1, τ2, α1, and α2 recovered with SPCImage from high SNR decay curves are accurate to within 1%, and results achieved from simulated lifetime decay curves with an SNR similar to the measured in vivo and in vitro lifetime decay curves are accurate to within 6%.
Quantification of Variables from the FLIM Images for Statistical Analyses
Cell culture
All FLIM and fluorescence intensity images at a given cell density (low or high) were obtained on the same day (for a total of two experimental days, one for each of the two cell densities). For the analysis of cell culture lifetime images, the region of interest (ROI) containing the cells was selected, and the fluorescence intensity threshold in SPCImage was adjusted so that signals from the nucleus were below the threshold. The region of interest included as few as 2 cells (low cell density) or as many as 60 cells (high cell density). Next, the lifetimes of all pixels in the region of interest were calculated, and the mean value of τ1, τ2, and α2 were recorded for each of the three ROI per dish. The redox ratio [fluorescence intensity of FAD/(FAD+NADH)] was calculated from the mean intensity of the 890 nm excitation images (FAD) and the mean intensity of the corresponding 780 nm excitation images (NADH). The mean redox ratio was recorded for each of the three regions of interest per dish. All redox ratio images at a given cell density were collected under identical experimental conditions on the same day. High density cells included control cells (n=8 total ROI from 4 dishes), cells treated with 3-bromopyruvate (n=6 total ROI from 2 dishes), and cells treated with CoCl2 (n=6 total ROI from 2 dishes). Low density cells included control cells (n=5 total ROI from 2 dishes), cells treated with 3-bromopyruvate (n=6 total ROI from 2 dishes), and cells treated with CoCl2 (n=6 total ROI from 2 dishes).
Hamster cheek pouch model
The epithelium and stroma were analyzed separately by choosing volumes of interest based on morphology. For the analysis of the epithelial layer, three cells were randomly chosen in each image plane within a depth stack of multiple image planes within an animal. The fluorescence intensity threshold in SPCImage was adjusted so that signals from the nucleus were below the threshold, and the lifetimes were calculated per pixel from all pixels within each cell. Separate matrices for τ1, τ2, and α2 for each cell were exported to Matlab (The Mathworks, Inc., Natick, MA). Then the mean and standard deviation of each of these parameters was calculated for each cell. The nuclear diameter was measured in an arbitrary orientation for the same set of cells for which the lifetime analysis was performed. The epithelial layer thickness was measured by counting the number of image planes (10 μm z-steps) between the first layer of epithelial cells and the first layer in which fibrillar collagen was observed, or the working distance of the objective was reached.
In the stromal layer, the lifetime was averaged for the entire field of view (256 × 256 pixels) of one image plane containing collagen fibrils within the cheek pouch of each animal.
Changes in cellular lifetime with depth in the epithelium within an animal were evaluated by averaging all three cells within an image plane and using paired non-parametric Wilcoxon Signed Rank tests to compare the first and last plane in the epithelium within an animal. All cells within an animal were averaged to perform comparisons between disease states using unpaired non-parametric Wilcoxon Rank-Sum tests. The cellular coefficient of variation (cell standard deviation/cell mean) was calculated for each cell as a measure of intracellular variability (32), and comparisons of all cells across disease states were made using both unpaired Wilcoxon Rank-Sum tests and unpaired t-tests. Exact p-values were computed, all p-values are two-sided, and a p-value of < 0.05 was considered statistically significant. Parametric methods (linear mixed effects models with log-transformed outcome variables) were used for validation purposes and led to similar results. SAS version 6.12 (Cary, NC) and Matlab (The Mathworks, Inc., Natick, MA) were used for all statistical analyses.
Results
Cell Culture Perturbation Studies
Figure 1 shows multiphoton FLIM images of control cells, cells treated with CoCl2 and cells treated with 3-bromopyruvate for cells plated at high density. This figure shows qualitative differences between the control and the two treated groups. CoCl2 decreases the protein bound NADH lifetime and 3-bromopyrvate increases the protein bound NADH lifetime relative to that in the control group.
Figure 1. Multiphoton FLIM of high density MCF10A cells imaged in cell culture.

Cells were untreated (control), treated with CoCl2, or treated with 3-bromoppyruvate. The color-coded value is τ2, the protein-bound NADH lifetime (780 nm excitation).
Perturbation with 3-bromopyruvate produced a statistically significant increase in the redox ratio and CoCl2 produced a statistically significant decrease in the redox ratio, reflecting an alteration in the metabolism with these perturbations (Figure 2(c), p<0.05). The results for high density and low density cells are separated because previous work has shown that the cellular lifetime of NADH depends on the cell confluency (due to changes in metabolism with cell confluency) (24). The fluorescence lifetimes at 780 nm excitation (τ1 = 0.30 ± 0.03 ns and τ2 = 2.40 ± 0.07 ns, averaged for control cells at low and high cell densities) are consistent with free and protein-bound NADH, respectively (8, 31). The fluorescence lifetimes at 890 nm excitation (τ1 = 0.15 ± 0.01 ns, τ2 = 2.44 ± 0.06 ns, α2 = 17 ± 2 %, averaged for control cells at low and high cell densities) are consistent with FAD fluorescence (33). The focus of these experiments is changes in protein-bound NADH with metabolic perturbations, so the statistical analyses of the lifetime of free NADH (τ1), and the lifetimes of FAD are not shown. Perturbation with 3-bromopyruvate caused an increase in the fluorescence lifetime of protein-bound NADH (τ2) and a decrease in the relative contribution of protein-bound NADH to the overall lifetime decay (α2) in cells plated at both low and high densities (Figure 2(a) and (b), p<0.05). Perturbation with CoCl2 caused a decrease in the fluorescence lifetime of protein-bound NADH (τ2) and a decrease in α2 in cells plated at low and high cell densities (Figure 2(a) and (b), p<0.05).
Figure 2. NADH fluorescence lifetimes and redox ratios of MCF10A cell monolayers.
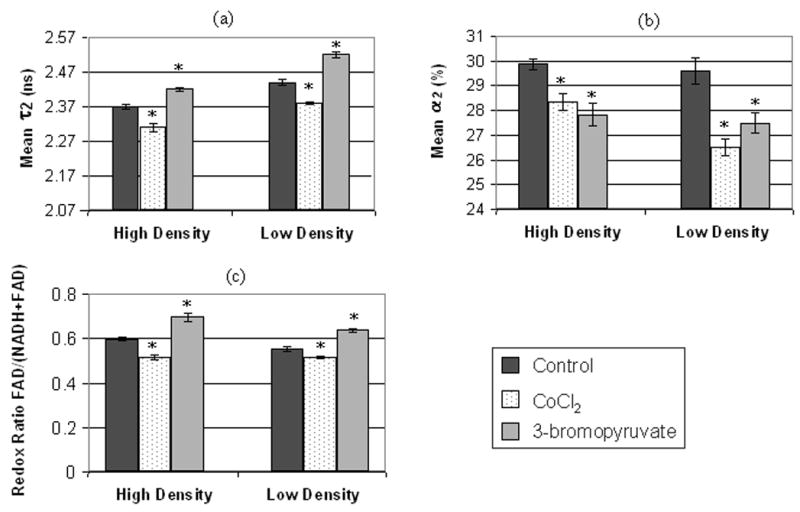
Bar plots include the mean and standard error of (a) τ2 (protein-bound NADH lifetime), (b) α2 (percent contribution of protein-bound NADH) and (c) the redox ratio [fluorescence intensity of FAD/(NADH+FAD)] for cells plated at either high density or low density. Values are plotted for control cells (high density, n=8; low density, n=5), cells treated with 3-bromopyruvate (high density, n=6; low density, n=6), which inhibits glycolysis, and cells treated with CoCl2 (high density, n=6; low density, n=6), which inhibits oxidative phosphorylation. Statistically significant differences (p<0.05, unpaired Wilcoxon Rank-Sum Tests) exist between control vs. 3-bromopyruvate treated and control vs. CoCl2 treated cells for the variables marked with an asterisk (*). The multiphoton FLIM excitation wavelength is 780 nm.
Hamster Cheek Pouch Pathology
Histopathology was used as the gold standard for tissue diagnosis. Of the 22 cheek pouches imaged (one per animal), 9 were diagnosed as normal (the 9 control animals), and of the 13 DMBA-treated animals 2 were diagnosed with mild dysplasia, 4 with moderate dysplasia, 4 with severe dysplasia, 2 with CIS and 1 with SCC. For the purpose of statistical analyses, the tissue samples were divided into three categories: normal (n=9), low grade pre-cancer (mild dysplasia and moderate dysplasia, n=6) and high grade pre-cancer (severe dysplasia and CIS, n=6). High grade pre-cancers are more likely to progress to cancer than low grade pre-cancers (34). The single SCC sample was not included in the statistical analysis.
Multiphoton FLIM Images of Normal, Pre-Cancerous and Cancerous Tissue in vivo
The hamster cheek pouch has three distinct layers: an acellular superficial layer, an epithelium and an underlying stroma. Three-dimensional image stacks of fluorescence lifetimes and the fractional contribution of the long lifetime component of these different layers (Figure 3) were used to determine whether multiphoton FLIM can differentiate histologically confirmed normal and dysplastic tissues.
Figure 3. Three-dimensional multiphoton FLIM images of the normal and pre-cancerous hamster cheek pouch in vivo.
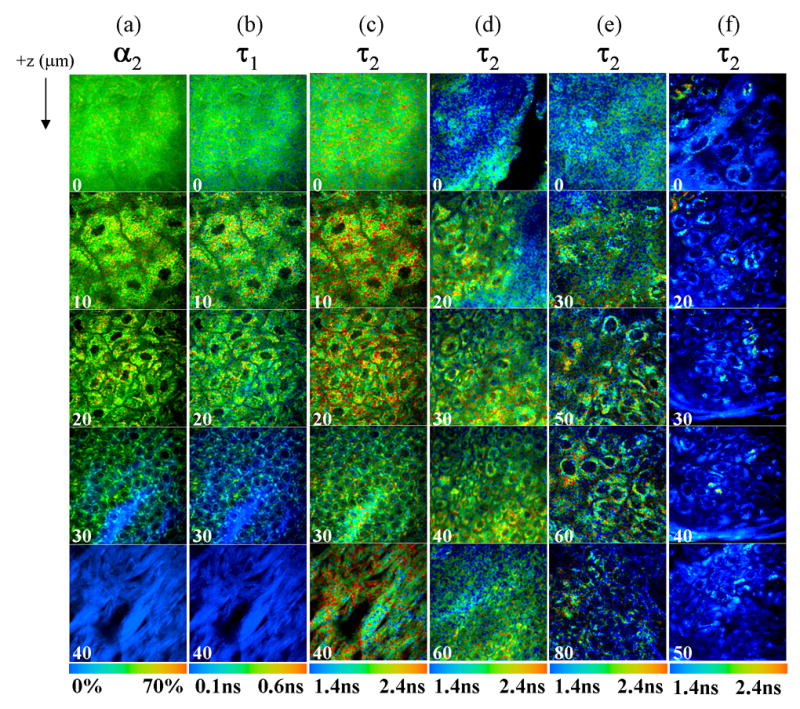
Multiphoton FLIM of the normal hamster cheek pouch (a, b, c), low grade pre-cancer (d, mild dysplasia), high grade pre-cancer (e, severe dysplasia), and SCC (f) measured in vivo at 780 nm excitation. Images are color coded to values of α2 (contribution of long lifetime component; a), τ1 (short lifetime component; b), and τ2 (long lifetime component; c, d, e, f). The color bar range is at the bottom of each montage. Note that τ1, τ2 and α2 each have a different color scale. The numbers in the lower left corner of each image indicate the depth below the tissue surface in microns, and each image is 100 μm × 100 μm.
In the normal cheek pouch (Figs. 3(a–c)), the acellular superficial layer fluorescence (0 μm) has a fairly uniform distribution of long lifetime contribution (α2), short lifetime (τ1), and long lifetime (τ2). However, in low-grade (Fig. 3(d)) and high grade pre-cancers, (Fig. 3(e)), the τ2 of the superficial layer is non-uniform. There was no acellular superficial layer in the one SCC sample (Fig. 3(f)). The cytoplasmic fluorescence of the cells in the epithelium of the normal cheek pouch (Fig. 3(a–c), between 10 – 30 μm depths) has a short (τ1) and long (τ2) lifetime component consistent with free and protein-bound NADH, respectively (8, 31) (percent contribution of protein- bound NADH, α2). The nuclear to cytoplasmic ratio of the cells increases with depth in the epithelium. However, this trend is not observed in the high grade pre-cancer (Fig. 3(e)) or the SCC (Fig. 3(f)). The cellular fluorescence distribution in the high grade pre-cancer and SCC is also more perinuclear compared to normal tissue. The predominant lifetime component in the normal and pre-cancerous epithelial cells is the free NADH lifetime (τ1). The protein-bound NADH lifetime (τ2) of pre-cancerous and cancerous cells appears to be shorter than normal cells. The lifetime of structural proteins in the stromal layer is much different than the lifetime of NADH in the epithelial cells. In the stromal layer of the normal cheek pouch (Fig. 3(a–c), 40 μm depth) τ1 is the predominant lifetime component (the contribution of τ2 is negligible) and its value is similar to the temporal response of the FLIM system and thus is attributed to the second harmonic generation (SHG) of fibrillar collagen (which has a zero lifetime (35)). The stromal layer in the pre-cancers and SCC is at a much greater depth than 40 μm.
Statistical Analyses of Fluorescence Lifetime Parameters
Features that were qualitatively observed to change with pre-cancer development in the multiphoton FLIM images were next quantified to determine if these observed differences were statistically significant. First, morphological variables were quantified, and statistical tests revealed that the epithelial thickness of high grade pre-cancers (52 ± 19μm) are greater than normal (18 ± 5 μm). All hamster cheek pouches were imaged to the depth of the bottom plane in the epithelium, except for one low grade pre-cancerous sample, in which the signal was completely attenuated before the last epithelial plane was imaged. Thus, the epithelial thickness of low grade pre-cancers is slightly underestimated (34 ± 19 μm) due to this one sample. Statistical tests also revealed that the nuclear diameter of low grade (7.5 ± 0.5 μm) and high grade (7.5 ± 0.4 μm) pre-cancers are greater than normal (6.3 ± 0.3 μm) (p<0.05). More extensive analysis of morphological changes quantified from multiphoton intensity images of the DMBA- treated hamster cheek pouch at 780 nm excitation is included in a previous paper (28).
The range of τ1 in normal epithelial cells was 0.29 ± 0.03 ns (consistent with free NADH). The focus of this study is changes in cellular protein-bound NADH with pre- cancer development (τ2 in the cells), so the statistical analysis of the lifetime of free NADH is not shown.
Changes in cellular lifetime with depth in the epithelium are shown in Figure 4. Changes in τ2 and α2 with depth were only evaluated within the epithelium of the hamster cheek pouch, where pre-cancer arises. The change in lifetime with depth within the epithelium was determined from a paired comparison of the first (superficial layer) vs. last (basal layer) imaged plane of the epithelium within an animal where the greatest differences in morphology are expected. The bottom plane imaged in the epithelium of normal tissue (18 ± 2 μm) was less than that of low grade pre-cancers (34 ± 19 μm) and that of low grade pre-cancers was less than that of high grade pre-cancers (52 ± 19 μm). This is expected, since one of the hallmarks of epithelial pre-cancer development is thickening of the epithelial layer with neoplasia. Paired statistical tests revealed no change in cellular τ2 or α2 with depth within the epithelium of normal tissues and high grade pre-cancers (p>0.05). However, cellular τ2 and α2 were found to decrease with depth within the epithelium of low grade pre-cancers (p<0.05). Note that the depth of the last imaged plane in the epithelium of normal tissues is much less than pre-cancerous tissues, and thus it is not possible to compare the changes in τ2 and α2 over the same depth between these two tissue types.
Figure 4. Change in cellular lifetime with depth in the normal and pre-cancerous hamster cheek pouch in vivo.
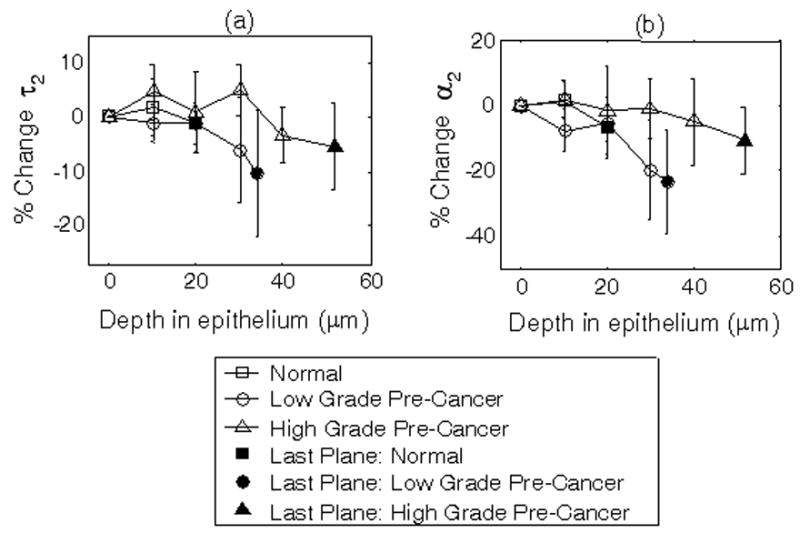
Percent change in cellular τ2 (protein-bound NADH lifetime; a) and α2 (percent contribution of protein-bound NADH; b) with depth within the epithelium of the hamster cheek pouch in vivo measured with multiphoton FLIM at 780 nm excitation. Within each animal, τ2 and α2 of three cells per image plane were averaged, and then the percent changes in τ2 and α2 of each plane were calculated relative to those of the most superficial plane in the epithelium (defined as the first layer of cells below the acellular superficial layer). Next, the percent change in τ2 and α2 at each depth were averaged for all animals. Solid circles represent the mean percent change for the last plane of the epithelium for all animals, plotted at the mean depth of the last plane in the epithelium of all animals relative to the most superficial plane in the epithelium. Paired Wilcoxon Signed Rank Tests of the first vs. last plane in the epithelium within an animal indicated a statistically significant decrease in τ2 and α2 with depth (p<0.05) in low-grade pre-cancers.
Statistical tests also revealed that normal and dysplastic tissues are differentiated with the mean cellular protein-bound NADH lifetime (τ2) (Table 1). The protein-bound NADH lifetime (τ2) of both low grade and high grade pre-cancerous cells are statistically lower than normal (p<0.05). The relative contribution of protein-bound NADH (α2) for low grade pre-cancerous cells is also statistically lower than normal.
Table 1. NADH fluorescence lifetimes of normal and pre-cancerous cells in the hamster cheek pouch in vivo.
Mean and standard deviation of cellular τ2 (protein-bound NADH lifetime) and α2 (percent contribution of protein-bound NADH) averaged for all cells within an animal for all normal animals (n=9), low grade pre-cancerous animals (n=6) and high grade pre-cancerous animals (n=6) from multiphoton FLIM at 780 nm excitation. Statistically significant differences (p<0.05, unpaired Wilcoxon Rank-Sum Tests) exist between normal vs. low grade pre-cancer (*) for τ2 and α2, and between normal vs. high grade pre-cancer (*) for τ2.
| τ2 (ns) | α2 (%) | |
|---|---|---|
| Normal (n=9 animals) | 2.03 ±0.06 | 37 ±3 |
| Low Grade (n=6 animals) | 1.58 ±0.35* | 32 ±4* |
| High Grade (n=6 animals) | 1.83 ±0.16* | 37 ±4 |
Normal vs. low grade/high grade pre-cancer p<0.05
Intracellular variability was assessed with the cellular coefficient of variation (32) (Figure 5). Intracellular τ2 and α2 variability for high grade and low grade pre-cancers is statistically greater than normal (p<0.05), and intracellular α2 variability for low grade pre-cancers is statistically greater than high grade pre-cancers (p<0.05).
Figure 5. Intracellular fluorescence lifetime variability of normal and pre-cancerous cells in the hamster cheek pouch in vivo.
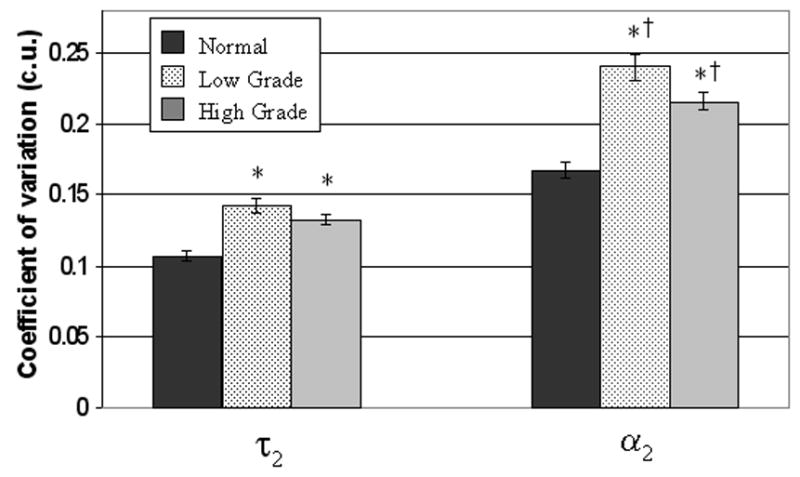
Mean and standard error of the cellular coefficient of variation (cell standard deviation/cell mean) for τ2 (protein-bound NADH lifetime) and α2 (percent contribution of protein-bound NADH) for all normal cells (n=81 cells), low grade pre-cancerous cells (n=72 cells) and high grade pre-cancerous cells (n=111 cells) measured with multiphoton FLIM in the hamster cheek pouch in vivo at 780 nm excitation. The coefficient of variation assesses the extent of variability within a cell relative to its mean (intracellular variability) (32). Unpaired Wilcoxon Rank Sum Tests (and t-tests) revealed statistically significant differences (p<0.05) in the coefficient of variation of τ2 and α2 between normal cells and all pre-cancerous cells (*), and in the coefficient of variation of α2 between low grade and high grade pre-cancerous cells (†) (p<0.05).
The mean α2 (1.5 ± 0.6 %) and τ1 (0.10 ± 0.003 ns) of normal and dysplastic collagen confirms that the collagen signal is 99% SHG (which has zero lifetime (35), the minimum calculated lifetime constrained by the fit model is 0.1 ns).
Discussion
The results of this study indicate that multiphoton FLIM provides structural (cellular-level morphology in three spatial dimensions) and metabolic (NADH lifetime) information that discriminates between normal tissue and pre-cancers in vivo. The morphological differences identified with pre-cancer development (increased nuclear diameter and epithelial thickness) are consistent with a previous multiphoton microscopy study of the DMBA-treated hamster cheek pouch (28). These morphological changes are also consistent with previous histopathology studies (16, 30, 36). However, multiphoton FLIM has the advantage of resolving these structural differences in vivo without the need for physical sectioning, and providing functional images of tissue metabolism with the NADH fluorescence lifetime. The protein-bound NADH fluorescence lifetime discriminated normal vs. high grade and normal vs. low grade pre-cancers in vivo (Table 1). The amount of protein-bound NADH relative to free NADH (α2) also decreased with low grade pre-cancer compared to normal (Table 1).
Cell culture perturbation studies (Figure 2) revealed that the protein-bound NADH lifetime component (τ2) increases with the addition of 3-bromopyruvate and decreases with the addition of CoCl2 (consistent with previous work (24, 31, 37)), and these lifetime changes increase and decrease with the redox ratio, respectively. It is expected that the addition of 3-bromopyruvate causes inhibition of glycolysis, thus resulting in an increase in the redox ratio while COCl2 causes inhibition of oxidative phosphorylation thus decreasing the redox ratio in cell culture. It should be emphasized that the results in Figure 2 are not intended for comparison of the merits of the redox ratio vs. the fluorescence lifetime. The purpose of showing the redox ratios was to use an independent method other than the fluorescence lifetime to show that there are changes in the redox state of the cells with the specific metabolic perturbations used in this study.
Changes in cellular metabolism with cancer development in vivo are more complex than the simple chemical perturbations to cellular metabolism in cell monolayers. Alterations in cellular metabolism with neoplasia development in vivo can be due to a number of factors including genetic changes, changes in tissue vascularization, and changes in metabolic demand (6). The purpose of Figure 2 was to show that the fluorescence lifetime is sensitive to changes in cellular metabolism in simple cell monolayers using known chemical perturbations. However, the cell monolayer results cannot be directly applied to the in vivo results due to the complex changes in metabolism with neoplasia development in vivo.
The short lifetime component (τ1) and long lifetime component (τ2) of the normal epithelial cells measured in vivo in the hamster cheek pouch are within the range of published values of free NADH and protein-bound NADH, respectively, in cell culture, tissue slices and in vivo tissue (8, 31, 37–39). However, the published lifetimes of free and protein-bound NADH vary widely depending on the biological system investigated. It is also possible that flavin adenine dinucleotide (FAD) could contribute to the measured lifetime at a two-photon excitation wavelength of 780 nm. However, in vivo multiphoton fluorescence images collected at 900 nm excitation (optimal for the two-photon excitation of FAD (26)) did not show any measurable fluorescence with our in vivo FLIM system, indicating that FAD is unlikely to contribute to the observed lifetime at 780 nm excitation in the hamster cheek pouch. Note that the FLIM system used for the in vivo experiments was not optimized for 900 nm excitation (due to low laser power and detection efficiency), but the system used for the cell culture experiments was optimized for collection at both 780 nm and 890 nm, so FAD fluorescence was observed in the cell culture experiments. Another source of fluorescence at this excitation wavelength is NADPH. Previous studies have shown that the concentration of NADH is about 5 times greater than NADPH (40), the NADH quantum yield is 1.25 – 2.5 times greater than NADPH (41), and metabolic perturbations produce fluorescence changes dominated by NADH (42). Thus, its likely that NADPH is responsible for a low, relatively constant fluorescence background in these studies (37).
Normal and pre-cancerous tissues were differentiated with the cellular protein- bound NADH lifetime (τ2), with low grade and high grade pre-cancerous tissues having a lower τ2 than normal (Table 2). The Warburg effect predicts that neoplasias favor glycolysis over oxidative phosphorylation under aerobic conditions (6, 7), and given the results of the cell perturbation study (Figure 2), the measured decrease in protein-bound NADH lifetime with neoplasia is consistent with increased levels of glycolysis. This shift to glycolysis could be due to either the Warburg effect or the Pasteur effect (43), which is increased glycolysis due to hypoxia. Changes in the distribution of NADH enzyme binding sites associated with preferred metabolic pathways in neoplastic tissues (10) may be responsible for the change in protein-bound NADH lifetime with pre-cancer. However, further studies are required to test this hypothesis.
Increased intracellular τ2 and α2 variability were observed in pre-cancerous tissues, and low grade pre-cancers had increased intracellular α2 variability compared to high grade pre-cancers (Fig. 5). This could be due to heterogeneous NADH binding and microenvironments within the cells. FLIM studies of pre-cancerous cells in vivo at higher magnifications with perturbations to cytosolic and mitochondrial metabolism could further investigate the heterogeneity of lifetimes within individual cells.
The lifetime of low grade pre-cancers was found to decrease with depth in the epithelium, while the lifetime of normal and high grade pre-cancers did not change with depth (Fig. 4). Neoplastic cells originate near the basement membrane and can move progressively upward through the epithelium (9). In a low grade pre-cancer, the epithelium is only partially occupied by the less differentiated neoplastic cells, while in a high-grade pre-cancer the full thickness of the epithelium is occupied by these cells (44). It may be speculated that increased heterogeneity in cell populations in low grade pre-cancers may be partly responsible for the variation in lifetime with depth in these tissues.
Multiphoton FLIM is ideal for pre-cancer detection in squamous epithelial tissues because the penetration depth of multiphoton FLIM (dependent on the optical properties of the organ site, but up to 0.3 mm in human skin (45), for example) is comparable to the thickness of the epithelium in a variety of tissues including the cervix and oral cavity (46). Multiphoton FLIM could also be used for other clinical applications, including non-invasive glucose monitoring in diabetics (47) and metabolic monitoring for tumor therapy. In the near-term, the important findings from multiphoton FLIM studies could guide the design and development of practical time-gated fluorescence detection schemes for clinical applications. In long-term, portable technology could be engineered to enable multiphoton FLIM in a clinical setting.
Acknowledgments
The authors would also like to thank John White, Axel Bergmann, and Jayne Squirrell for their scientific input, and Kristin Vrotsos and Paolo Provenzano for their help with animal and cell culture experiments, respectively. This work was supported by the National Institutes of Health (R01 EB000184) and the Department of Defense, Predoctoral Traineeship Award W81XWH-04–1–0330 (for M.S.).
Abbreviations
- FLIM
Fluorescence Lifetime Imaging Microscopy
- SHG
Second Harmonic Generation
- DMBA
dimethylbenz[α]anthracene
- CIS
Carcinoma in Situ
- SCC
Squamous Cell Carcinoma
References
- 1.Suhling K, French PM, Phillips D. Time-resolved fluorescence microscopy. Photochem Photobiol Sci. 2005;4(1):13–22. doi: 10.1039/b412924p. [DOI] [PubMed] [Google Scholar]
- 2.Lakowicz JR. Principles of Fluorescence Spectroscopy. Plenum Publishers; New York: 1999. [Google Scholar]
- 3.Denk W, Strickler JH, Webb WW. Two-photon laser scanning fluorescence microscopy. Science. 1990;248(4951):73–76. doi: 10.1126/science.2321027. [DOI] [PubMed] [Google Scholar]
- 4.Centonze VE, White JG. Multiphoton excitation provides optical sections from deeper within scattering specimens than confocal imaging. Biophys J. 1998;75(4):2015–2024. doi: 10.1016/S0006-3495(98)77643-X. [DOI] [PMC free article] [PubMed] [Google Scholar]
- 5.Squirrell JM, Wokosin DL, White JG, Bavister BD. Long-term two-photon fluorescence imaging of mammalian embryos without compromising viability. Nat Biotechnol. 1999;17(8):763–767. doi: 10.1038/11698. [DOI] [PMC free article] [PubMed] [Google Scholar]
- 6.Gulledge CJ, Dewhirst MW. Tumor oxygenation: a matter of supply and demand. Anticancer Res. 1996;16(2):741–749. [PubMed] [Google Scholar]
- 7.Warburg O. The Metabolism of Tumors, Constabel. London: 1930. [Google Scholar]
- 8.Lakowicz JR, Szmacinski H, Nowaczyk K, Johnson ML. Fluorescence lifetime imaging of free and protein-bound NADH. Proc Natl Acad Sci U S A. 1992;89(4):1271–1275. doi: 10.1073/pnas.89.4.1271. [DOI] [PMC free article] [PubMed] [Google Scholar]
- 9.Alberts B, Johnson A, Lewis J, Raff M, Roberts K, Walter P. Molecular Biology of the Cell. Garland Science; New York: 2002. [Google Scholar]
- 10.Banerjee S, Bhatt DK. Histochemical studies on the distribution of certain dehydrogenases in squamous cell carcinoma of cheek. Indian J Cancer. 1989;26(1):21–30. [PubMed] [Google Scholar]
- 11.Iweibo I. Protein fluorescence and electronic energy transfer in the determination of molecular dimensions and rotational relaxation times of native and coenzyme-bound horse liver alcohol dehydrogenase. Biochim Biophys Acta. 1976;446(1):192–205. doi: 10.1016/0005-2795(76)90110-0. [DOI] [PubMed] [Google Scholar]
- 12.Jones AR, Gillan L, Milmlow D. The anti-glycolytic activity of 3-bromopyruvate on mature boar spermatozoa in vitro. Contraception. 1995;52(5):317–320. doi: 10.1016/0010-7824(95)00217-x. [DOI] [PubMed] [Google Scholar]
- 13.Lee AW, DJ States Colony-stimulating factor-1 requires PI3-kinase-mediated metabolism for proliferation and survival in myeloid cells. Cell Death Differ. 2006 doi: 10.1038/sj.cdd.4401884. [DOI] [PubMed] [Google Scholar]
- 14.Chandel NS, Maltepe E, Goldwasser E, Mathieu CE, Simon MC, Schumacker PT. Mitochondrial reactive oxygen species trigger hypoxia-induced transcription. Proc Natl Acad Sci U S A. 1998;95(20):11715–11720. doi: 10.1073/pnas.95.20.11715. [DOI] [PMC free article] [PubMed] [Google Scholar]
- 15.Hervouet E, Pecina P, Demont J, Vojtiskova A, Simonnet H, Houstek J, Godinot C. Inhibition of cytochrome c oxidase subunit 4 precursor processing by the hypoxia mimic cobalt chloride. Biochem Biophys Res Commun. 2006;344(4):1086–1093. doi: 10.1016/j.bbrc.2006.04.014. [DOI] [PubMed] [Google Scholar]
- 16.White FH, Gohari K, Smith CJ. Histological and ultrastructural morphology of 7,12 dimethylbenz(alpha)-anthracene carcinogenesis in hamster cheek pouch epithelium. Diagn Histopathol. 1981;4(4):307–333. [PubMed] [Google Scholar]
- 17.Andrejevic S, Savary JF, Fontolliet C, Monnier P, van Den Bergh H. 7,12-dimethylbenz[a]anthracene-induced ‘early’ squamous cell carcinoma in the Golden Syrian hamster: evaluation of an animal model and comparison with ‘early’ forms of human squamous cell carcinoma in the upper aero-digestive tract. Int J Exp Pathol. 1996;77(1):7–14. doi: 10.1046/j.1365-2613.1996.956095.x. [DOI] [PMC free article] [PubMed] [Google Scholar]
- 18.Chen CT, Chiang HK, Chow SN, Wang CY, Lee YS, Tsai JC, Chiang CP. Autofluorescence in normal and malignant human oral tissues and in DMBA-induced hamster buccal pouch carcinogenesis. J Oral Pathol Med. 1998;27(10):470–474. doi: 10.1111/j.1600-0714.1998.tb01914.x. [DOI] [PubMed] [Google Scholar]
- 19.Wokosin DL, Squirrell JM, Eliceiri KW, White JG. An optical workstation with concurrent independent multiphoton imaging and experimental laser microbeam capabilities. Rev Sci Instrum. 2003;74(1) doi: 10.1063/1.1524716. [DOI] [PMC free article] [PubMed] [Google Scholar]
- 20.Bird DK, Eliceiri KW, Fan CH, White JG. Simultaneous two-photon spectral and lifetime fluorescence microscopy. Appl Opt. 2004;43(27):5173–5182. doi: 10.1364/ao.43.005173. [DOI] [PubMed] [Google Scholar]
- 21.Nazir MZ, Eliceiri KW, Ahmed A, Hashmi A, Agarwal V, Rao Y, Kumar S, Lukas T, Nasim M, Rueden C, Gunawan R, White JG. WiscScan: A Software Defined Laser-Scanning Microscope. Scanning . 2006 Submitted. [Google Scholar]
- 22.http://www.atcc.org,
- 23.Keely PJ, Fong AM, Zutter MM, Santoro SA. Alteration of collagen-dependent adhesion, motility, and morphogenesis by the expression of antisense alpha 2 integrin mRNA in mammary cells. J Cell Sci. 1995;108(Pt 2):595–607. doi: 10.1242/jcs.108.2.595. [DOI] [PubMed] [Google Scholar]
- 24.Bird DK, Yan L, Vrotsos KM, Eliceiri KW, Vaughan EM, Keely PJ, White JG, Ramanujam N. Metabolic mapping of MCF10A human breast cells via multiphoton fluorescence lifetime imaging of the coenzyme NADH. Cancer Res. 2005;65(19):8766–8773. doi: 10.1158/0008-5472.CAN-04-3922. [DOI] [PubMed] [Google Scholar]
- 25.Chance B, Schoener B, Oshino R, Itshak F, Nakase Y. Oxidation-reduction ratio studies of mitochondria in freeze-trapped samples. NADH and flavoprotein fluorescence signals. J Biol Chem. 1979;254(11):4764–4771. [PubMed] [Google Scholar]
- 26.Huang S, Heikal AA, Webb WW. Two-photon fluorescence spectroscopy and microscopy of NAD(P)H and flavoprotein. Biophys J. 2002;82(5):2811–2825. doi: 10.1016/S0006-3495(02)75621-X. [DOI] [PMC free article] [PubMed] [Google Scholar]
- 27.Skala MC, Palmer GM, Zhu C, Liu Q, Vrotsos KM, Marshek-Stone CL, Gendron-Fitzpatrick A, Ramanujam N. Investigation of fiber-optic probe designs for optical spectroscopic diagnosis of epithelial pre-cancers. Lasers Surg Med. 2004;34(1):25–38. doi: 10.1002/lsm.10239. [DOI] [PMC free article] [PubMed] [Google Scholar]
- 28.Skala MC, Squirrell JM, Vrotsos KM, Eickhoff JC, Gendron-Fitzpatrick A, Eliceiri KW, Ramanujam N. Multiphoton microscopy of endogenous fluorescence differentiates normal, precancerous, and cancerous squamous epithelial tissues. Cancer Res. 2005;65(4):1180–1186. doi: 10.1158/0008-5472.CAN-04-3031. [DOI] [PMC free article] [PubMed] [Google Scholar]
- 29.Schonle A, Glatz M, Hell SW. Four-dimensional multiphoton microscopy with time-correlated single-photon counting. Applied Optics. 2000;39(34):6306–6311. doi: 10.1364/ao.39.006306. [DOI] [PubMed] [Google Scholar]
- 30.MacDonald DG, Saka SM. Structural Indicators of the High Risk Lesion. Cambridge Univ. Press; Cambridge: 1991. [Google Scholar]
- 31.Schneckenburger H, Wagner M, Weber P, Strauss WSL, Sailer R. Autofluorescence lifetime imaging of cultivated cells using a UV picosecond laser diode. J Fluorescence. 2004;14:649–654. doi: 10.1023/b:jofl.0000039351.09916.cc. [DOI] [PubMed] [Google Scholar]
- 32.Gibbons J, Chakraborti S. Nonparametric Statistical Inference. Marcel Dekker; New York: 1992. [Google Scholar]
- 33.Tanaka F, Tamai N, Yamazaki I. Picosecond-resolved fluorescence spectra of D-amino-acid oxidase. A new fluorescent species of the coenzyme. Biochemistry. 1989;28(10):4259–4262. doi: 10.1021/bi00436a021. [DOI] [PubMed] [Google Scholar]
- 34.Sawaya GF, Brown AD, Washington AE, Garber AM. Clinical practice. Current approaches to cervical-cancer screening. N Engl J Med. 2001;344(21):1603–1607. doi: 10.1056/NEJM200105243442107. [DOI] [PubMed] [Google Scholar]
- 35.Campagnola PJ, Loew LM. Second-harmonic imaging microscopy for visualizing biomolecular arrays in cells, tissues and organisms. Nat Biotechnol. 2003;21(11):1356–1360. doi: 10.1038/nbt894. [DOI] [PubMed] [Google Scholar]
- 36.Xiang YV. Quantitative study on esophageal cytology. I. Quantitative morphologic studies of normal, dysplastic and malignant squamous cells. Zhonghua Zhong Liu Za Zhi. 1990;12(2):92–94. [PubMed] [Google Scholar]
- 37.Vishwasrao HD, Heikal AA, Kasischke KA, Webb WW. J Biol Chem. 2005. Conformational dependence of intracellular NADH on metabolic state revealed by associated fluorescence anisotrophy. [DOI] [PubMed] [Google Scholar]
- 38.Niesner R, Peker B, Schlusche P, Gericke KH. Noniterative biexponential fluorescence lifetime imaging in the investigation of cellular metabolism by means of NAD(P)H autofluorescence. Chemphyschem. 2004;5(8):1141–1149. doi: 10.1002/cphc.200400066. [DOI] [PubMed] [Google Scholar]
- 39.Konig K, Riemann I. High-resolution multiphoton tomography of human skin with subcellular spatial resolution and picosecond time resolution. J Biomed Opt. 2003;8(3):432–439. doi: 10.1117/1.1577349. [DOI] [PubMed] [Google Scholar]
- 40.Klaidman LK, Leung AC, Adams JD., Jr High-performance liquid chromatography analysis of oxidized and reduced pyridine dinucleotides in specific brain regions. Anal Biochem. 1995;228(2):312–317. doi: 10.1006/abio.1995.1356. [DOI] [PubMed] [Google Scholar]
- 41.Avi-Dor Y, Olson J, Doherty M, Kaplan N. Fluorescence of Pyridine Nucleotides in Mitochondria. J Biol Chem. 1962;237(7):2377–2383. [Google Scholar]
- 42.Chance B, Williamson J, Jamieson D, Schoener B. Properties and kinetics of reduced pyridine nucleotide fluorescence of the isolated and in vivo rat heart. Biochem Z. 1965;341:357–377. [Google Scholar]
- 43.Schroeder T, Yuan H, Viglianti BL, Peltz C, Asopa S, Vujaskovic Z, Dewhirst MW. Spatial heterogeneity and oxygen dependence of glucose consumption in R3230Ac and fibrosarcomas of the Fischer 344 rat. Cancer Res. 2005;65(12):5163–5171. doi: 10.1158/0008-5472.CAN-04-3900. [DOI] [PubMed] [Google Scholar]
- 44.Pavlova I, Sokolov K, Drezek R, Malpica A, Follen M, Richards-Kortum R. Microanatomical and biochemical origins of normal and precancerous cervical autofluorescence using laser-scanning fluorescence confocal microscopy. Photochem Photobiol. 2003;77(5):550–555. doi: 10.1562/0031-8655(2003)077<0550:maboon>2.0.co;2. [DOI] [PubMed] [Google Scholar]
- 45.So PT, Dong CY, Masters BR, Berland KM. Annu Rev Biomed Eng. Vol. 2. 2000. Two-photon excitation fluorescence microscopy; pp. 399–429. [DOI] [PubMed] [Google Scholar]
- 46.Cormack DH. Clinically Integrated Histology. Lipincott-Rave: Philadelphia, PA; 1998. [Google Scholar]
- 47.Evans ND, Gnudi L, Rolinski OJ, Birch DJ, Pickup JC. Glucose- dependent changes in NAD(P)H-related fluorescence lifetime of adipocytes and fibroblasts in vitro: potential for non-invasive glucose sensing in diabetes mellitus. J Photochem Photobiol B. 2005;80(2):122–129. doi: 10.1016/j.jphotobiol.2005.04.001. [DOI] [PubMed] [Google Scholar]