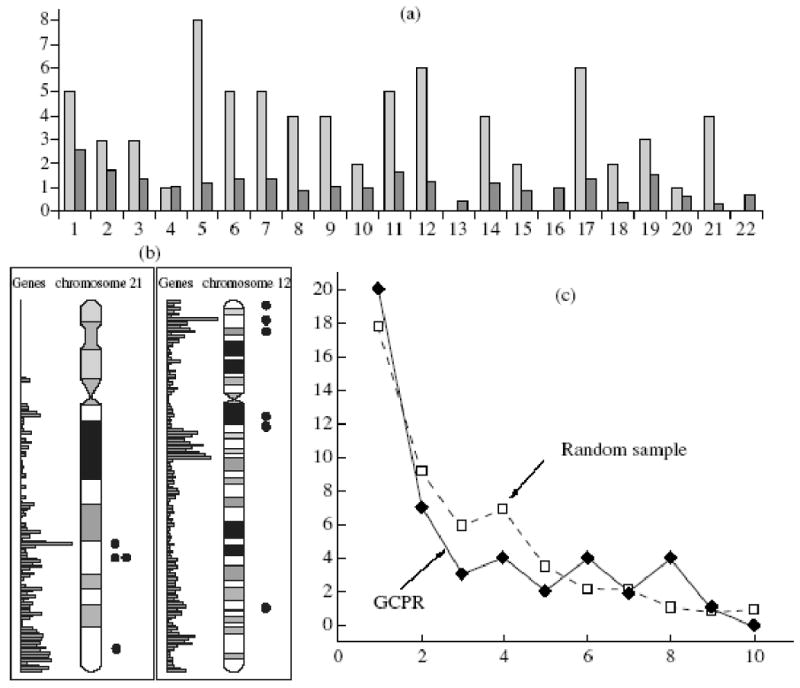
Figure 5.

Relation of genes that changed their protein representation (GCPR) during telomerization to the genome structure. (a) Distribution of GCPR by chromosomes; Abscissa: ordinal number of chromosome; ordinate: amount of GCPR ( ) and total amount of genes on each chromosome, thousands (
 ). (b) Examples GCPR distribution inside chromosomes. (c) total distribution of distances between GCPR (comparison to a random sample); abscissa: distance between GCPR, MB; ordinate: number of GCPR.
