

Abstract
We describe the fabrication of three-dimensional (3D) membranes with precisely patterned surface nanoporosity and their utilization in size selective sampling. The membranes were self-assembled as porous cubes from lithographically fabricated 2D templates [1] with face dimensions of 200 μm, volumes of eight nL, and monodisperse pores ranging in size from approximately 10 μm to 100 nm. As opposed to conventional sampling and filtration schemes where fluid is moved across a static membrane, we demonstrate sampling by instead moving the 3D nanoporous membrane through the fluid. This new scheme allows for straightforward sampling in small volumes, with little to no loss. Membranes with five porous faces and one open face were moved through fluids to sample and retain nanoscale beads and cells based on pore size. Additionally, cells retained within the membranes were subsequently cultured and multiplied using standard cell culture protocols upon retrieval.
INTRODUCTION
Filtration and separation techniques play a significant role in bioreactors, metal and acid recovery, and purifying liquid streams. [2] With the advent of nanoscale filtration, many new applications have emerged in microfluidics, environmental sciences, food purification and bioengineering [3-6] where it is necessary to filter or sample small micro to nanoscale objects in fluids. In the environmental sciences, nanofiltration membranes are a prime example of how new filtration technologies are finding solutions to traditional problems. In many cases these compounds take decades to degrade and as environmental regulations evolve, the filtration and separation of these compounds have become increasingly important. [7] In contrast with established treatment methods, reverse osmosis and nanofiltration technologies have been shown to be beneficial in separating highly branched molecular structures such as pesticides and biologically active pharmaceutical products. These organic compounds, which are present in a range of ng/L concentrations, are primarily separated using size-based exclusion principles. [8] These principles are primarily dependent on membrane pore size and distribution.
Nanofiltration is also important in sampling for medical diagnostics and treatment. As an example, micrometastases are cells that detach from a primary tumor and circulate through the blood stream in low concentrations. They occur in approximately one third of cancer patients and are too small to be detected by current diagnostic tests. [9] Therefore it is necessary to sample a peripheral blood sample for circulating tumor cells in order to detect metastatic cancer. These circulating tumor cells are significantly larger than peripheral blood leukocytes and have been sampled and separated by size exclusion filtration methods. [10, 11] In certain circumstances, however, large volumes of biological fluids may not be available. For instance, the recommended blood sample size from infants and small children is 0.5−2 mL; this can be a significant amount of their total blood volume. [12] The ability to perform size selective sampling with reduced volumes (50−200 μL) could minimize risk. We propose and demonstrate a straightforward process that utilizes 3D nanoporous membranes to sample both beads and cells from a small volume of liquid based on size. As opposed to conventional nanofiltration where the fluid is moved across a static membrane, our strategy utilizes 3D nanoporous membranes that are moved through the solution to be sampled.
EXPERIMENTAL SECTION
Microfabrication
The 3D membranes were fabricated as hollow cubes with controlled monodisperse porosity using a combination of microfabrication and self-assembly. The membranes are 200 μm (a side) and consist of five porous and one open face (Fig. 1a). First, 2D interconnected nickel (Ni) cruciforms held together by solder hinges were constructed using conventional microfabrication. These templates self-assembled into 3D hollow cubic structures when heated above the melting point of the solder hinges. The self-assembly was driven by the minimization of surface area of liquid solder, and is described in detail elsewhere. [1] Microporous membranes (Fig. 1a) were fabricated by lithographically patterning an 8×8 monodisperse array of 5−10 μm pores on 2D cruciforms before assembly. This corresponds to a porosity of 3.14−12.5% per face, respectively. To further minimize the pore size of the 3D membranes, gold (Au) was coated on the inside and outside of the cubes by electrodeposition after assembly. We used a pulsed waveform during electrodeposition for better control over the thickness and quality of the deposited Au film. The final size of the pores was determined by the duration and current density of electrodeposition. Typical times to reduce 5 μm pores were approximately 18 minutes at 1.5 mA/cm2, yielding approximately 1.5 μm pores (porosity of 0.3% per face) (Fig. 1b) and approximately 27 minutes to yield approximately 100 nm pores (porosity of 0.0013% per face) (Fig. 1c). Electrodeposition of Au for longer times, typically 30 minutes or more, resulted in the complete closure of the pores (not shown). Since the micropores were lithographically patterned and then systematically reduced, they were regular in shape and monodisperse in size. In addition to this pore-attenuating method, other strategies for patterning nanopores, such as electron beam lithography and anodization, are being explored.
Figure 1.
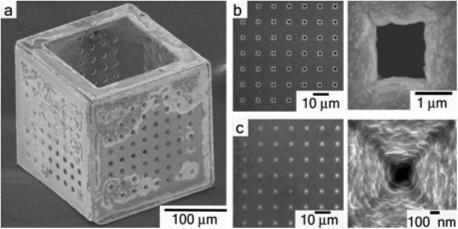
a, Scanning electron micrograph (SEM) of a 200 μm three dimensional membrane with 10 μm pores on five faces and a large 150 μm pore on the sixth face. b, Zoomed-in detail of an array of 1.5 μm diameter pores on a single face of the membrane and a single micropore. c, Zoomed-in detail of an array of 100 nm diameter pores on a single face of the membrane and a single nanopore.
To characterize the pore size achieved by the Au electrodeposition, scanning electron microscope (SEM) images of porous membranes (processed at various electrodeposition times) were taken using a JEOL JSM-6700F Field-Emission SEM at 10 kV. Bead sampling experiments were performed with fluorescent beads (Polysciences, Inc) ranging in size from 1 μm to 50 nm. The beads were prepared by sonicating the purchased bulk solutions for 10 minutes to ensure monodisperse and homogeneous samples. The beads were then transferred to PCR tubes and sonicated for an additional five minutes prior to sampling.
Thiol Coating
To reduce unwanted surface interactions of beads to the membrane surface, a fluorinated thiol (1H,1H,2H,2H-Perfluorodecanethiol, Aldrich) coating was applied to the assembled porous membranes following standard self-assembled monolayer (SAM) procedures [13, 14]. Briefly, all samples and glassware were cleaned in 200 proof ethanol that had been deoxygenated by purging with nitrogen gas for 2 hours. The membranes were then immersed in a 3 mM solution of the thiol in ethanol for 24 hours to ensure the assembly of a uniform SAM. The reaction was then stopped by removing the thiol solution and rinsing the membranes with deoxygenated ethanol. The nanoporous membranes were then stored in vials containing deoxygenated ethanol and backfilled with dry nitrogen until ready for use.
Cell Culture
We utilized L929 fibroblast cells for all cell sampling experiments. Cells were cultured using standard procedures. [15] The cell media consisted of 85% Minimum Essential Medium Eagles containing L-glutamine and sodium bicarbonate with 10% horse serum, supplemented with MEM non-essential amino acids and sodium pyruvate. Confluent cells were separated from the bottom of the 75 cm2 culture flasks by exposure to trypsin-EDTA and were resuspended in 5 mL of media (104 cells per mL). This seeding density was verified by removing a sample of the resuspended cells, staining with Trypan blue, and using a hemacytometer to determine the number of viable cells.
For cell sampling, aliquots containing 200 μL of the 104 cell solution were pipetted into PCR tubes and warmed in a 37°C water bath to maintain optimal cell temperature during the sampling procedure. Au-coated membranes were first rinsed in deionized water and phosphate buffered saline and then soaked in L929 fibroblast cell media prior to use. These membranes were transferred into the PCR tubes (2 membranes per tube) that were then rotated vertically (tumbled along the long axis of the PCR tube) at an approximate speed of 30 revolutions/minute. The membranes were periodically monitored to confirm that they tumbled freely within the cell solution. After tumbling for 45 minutes, the membranes were transferred into a Petri dish containing 37°C media and were rinsed by gentle pipetting. The membranes were then either washed in phosphate buffered saline to remove serum esterase activity and stained for immediate imaging, or transferred to glass-bottom dishes (MatTek Corp.) and incubated for 48 hours prior to staining.
Cells retained within the membrane were stained with the LIVE/DEAD® assay stain to determine cell viability. [16] The LIVE/DEAD® stain contains two chemicals: Calcein AM, which stains live cells green upon conversion to calcein in the presence of ubiquitous intracellular esterase activity and ethidium homodimer-1, which enters cells through damaged membranes and fluoresces red upon binding to nucleic acids. The remaining cells in the PCR tubes were stained using the Trypan blue exclusion test to verify that the tumbling procedure had not harmed the cells within the PCR tubes; Trypan blue is a vital stain used to selectively stain dead cells. Cells and membranes were imaged using a Nikon Labophot fluorescence microscope with a QImaging QICAM Fast 1394 camera. We utilized a B-3A Nikon filter which spanned the excitation and emission spectra for both the fluorescent beads and the fluorophores in the LIVE/DEAD® assay. For the LIVE/DEAD® assay, calcein AM was excited/emitted at 495/520 nm and ethidium homodimer-1 was excited/emitted at 530/615 nm.
RESULTS AND DISCUSSION
Sampling of Polystyrene Beads
The porous membranes fabricated in this paper were shaped as cubes with five porous faces and one open face. In contrast to a 2D flat membrane, the 3D membranes have a finite encapsulation volume and a greater surface area to volume ratio. The porous membranes were also small, mobile and easily introduced and removed from the fluid to be sampled by pipetting This trait allowed for minimal sample volumes, much lower than other sampling strategies; the fluids sampled typically had volumes of 50 to 200 μL. Additionally, there was minimal fluid loss. To facilitate sampling of all regions within a fluid, membranes were moved either in a controlled manner or autonomously, for periods of hours to days. In most of the experiments membranes were tumbled in solution using a rotary motor, however, membranes coated with 1 μm-thick platinum (Pt) could also be moved autonomously to sample in a 3% hydrogen peroxide solution for approximately 48 hours. Membrane movement was driven by the liberation of oxygen gas formed during the decomposition of hydrogen peroxide on the Pt-coated surfaces. This autonomous motion has been utilized previously to move micro-nanoscale objects. [17] A video demonstrating autonomous membrane movement is included in the supplementary section. Since the membranes were fabricated with ferromagnetic Ni frames, they could also be tumbled using oscillating magnetic fields. All three sampling processes required only periodic monitoring; hence, it was possible to leave the membranes tumbling in solution for long periods of time.
We utilized 200 μL aqueous solutions of commercial monodisperse fluorescent beads to demonstrate size-based sampling. After tumbling for approximately four hours, the membranes were removed from the solution and imaged using a fluorescence microscope. When membranes with approximately 100 nm pores were tumbled in a solution containing 1 μm diameter beads, these orange colored beads were observed (Fig. 2). However, we observed that in addition to capturing beads within the membranes, there was a tendency for beads to stick to the rim of the open face and outer surfaces of the cubic membranes (Fig. 2a) during tumbling. This adherence grew more frequent with increasing surface roughness and once it occurred, the beads tended to aggregate more during tumbling and could not be dislodged by pipetting or vortexing. However, we found that surface adherence of beads on faces of the membranes was greatly reduced (Fig. 2b) on membranes coated with a fluorinated thiol (1H,1H,2H,2H-Perfluorodecanethiol).
Figure 2.

(a-b) Bright field and fluorescent images demonstrating the effectiveness of fluorinated thiol treatment on preventing the adhesion of 1 μm orange beads to the surface of the micromembranes. a, An untreated Au-coated micromembrane with 1 μm beads adhered to the surface and b, a fluorinated thiol coated micromembrane with no beads adhered to the surface.
Subsequent experiments were performed with thiol-coated membranes tumbled in PCR tubes on the rotary motor (Fig. 3a). We utilized membranes with different pore sizes to selectively sample and capture beads of a particular size from an aqueous solution containing a mixture of 1 μm, 200 nm and 50 nm beads. In these experiments, we mixed approximately 106 yellow/orange fluorescent 1 μm beads, 108 green fluorescent 200 nm beads and 1010 red fluorescent 50 nm beads in a deionized water solution. These concentrations of beads were chosen to achieve equal fluorescence intensities based on calibration studies performed on individual differently-sized beads using a Gemini XPS plate reader with SpectraMaxPro software. Since the 50 nm beads were smaller and had lower surface area per bead, more of them were needed to achieve the same overall fluorescence intensity as compared with that of the 200 nm and 1 μm beads. When membranes with pore sizes of approximately 500 nm were used, only 1 μm beads were collected from a sampling mixture containing all three bead sizes (Fig. 3b). After sampling the three bead mixture with a smaller membrane consisting of 100 nm pores, both 1 μm and 200 nm beads were visible within the micromembrane (data not shown). To verify that the 50 nm beads were not sampled, the experiment was repeated with only the 200 nm (green) and 50 nm (red) beads and only green fluorescence was detected within the membrane (Fig. 3c) indicating that predominantly 200 nm beads were captured within the membrane, while 50 nm beads escaped through the 100 nm pores. An experiment was also performed in which only 50 nm beads were sampled in a 100 nm pored membrane; no beads were detected within the cubic membrane (data not shown).
Figure 3.

a, Schematic diagram depicting three dimensional membranes tumbling in a PCR tube. (b-d) Fluorescence images of membranes retrieved after tumbling in an aqueous solution of beads. b, When a membrane with 100 nm pores was tumbled in an aqueous solution of 1 μm orange fluorescent beads; these beads were observed within the membrane on retrieval. c, When a membrane with 100 nm pores was tumbled in an aqueous solution containing a mixture of 200 nm green and 50 nm red fluorescent beads; only green fluorescence was observed within the membrane on retrieval. d, When a membrane with no exit pores was tumbled in an aqueous solution containing a mixture of 1 μm yellow/orange, 200 nm green and 50 nm red fluorescent beads; all three colors were seen in the image. e, Progressive zoomed-in SEM images of the membrane in d, showing all three sized beads. Also shown in the inset is a single 1 μm trapped in a pore.
To further rule out the possibility that the 50 nm beads were not observed in the membranes due to their lower specific fluorescent intensity, we repeated the experiment using membranes with no exit pores (the pores were closed completely during electrodeposition). Prior to imaging, the micromembranes were pipetted out of the bead solution and rinsed with DI to wash away any free floating beads in solution. Upon retrieval from the solution, images obtained from within the membrane showed all three fluorescing colors (Fig. 3d). In addition to fluorescence microscopy, we also obtained SEM images (Fig. 3e) of these membranes that show all three beads present within the membrane. This control experiment with closed pores corroborated the result discussed earlier with 100 nm pore membranes, i.e. 200 nm beads were captured within a 100 nm pore size membrane, while the 50 nm beads escaped through the pores. These experiments demonstrate that our nanoporous membranes can selectively sample nanoscale beads based on their size from small volumes of liquid.
To quantify the separation process, we calculated the sieving coefficient,
| (1) |
where S is the sieving coefficient, Ci is the initial concentration and Cf is the final concentration of beads in the solution. The concentration of beads in the solution was determined using a Gemini XPS plate reader. [18] A solution consisting of approximately 106 yellow/orange fluorescent 1 μm beads/ml, 108 green fluorescent 200 nm beads/ml and 1010 red fluorescent 50 nm beads/ml was split into two 200 μl PCR tubes. One tube was a control and contained a solution with no membranes, the other was the test solution with five closed pore membranes. The two PCR tubes were tumbled on the rotary motor for 24 hours. After tumbling and removal of the micromembranes from the test PCR tube, the fluorescent intensities of both the control sample and the test sample solutions were determined using the fluorescent plate reader. By utilizing the relationship between fluorescence intensity units and concentration, a comparison between the control and test sample solutions was used to determine the average sieving coefficient of 0.76 for the five micromembranes. Thus, the five membranes entrapped approximately 24% of the beads under the conditions used in our experiments.
Further work needs to be done to investigate the ability of the micromembranes to selectively sieve low concentrations of a target object from a highly concentrated test solution. In the case of circulating tumor cells, while they occur in much lower numbers than blood cells, their size is significantly greater. Therefore, the test blood sample could also be pre-concentrated using standard filter methods, if necessary, prior to sampling. In our sampling methodology, as demonstrated in our experiments, the ability to use multiple micromembranes within a limited volume of test solution, will increase the probability of selectively sampling and collecting the low concentrations of target objects, thereby increasing the sieving coefficient. It should be emphasized that a highlight of our methodology is that our nanoporous membranes are inexpensive to fabricate and can be reused.
Since our sampling methodology involves tumbling, increased sampling times also affect the amount of objects collected. We investigated this relationship between sampling times and the amount of beads sampled by performing timed experiments. Twenty closed-face cubic membranes (no pores) were thiol-coated and distributed between 5 different PCR tubes containing the three-sized bead mixture described above. They were then set to tumble on the rotary motor for time periods of 30 minutes, two hours, four hours, eight hours and 24 hours. After the designated time, the micromembranes were pipetted from the sampling mixture and rinsed in DI water prior to imaging. Figure 4 illustrates that as sampling times increased from two to 24 hours, the number of beads collected also increased.
Figure 4.
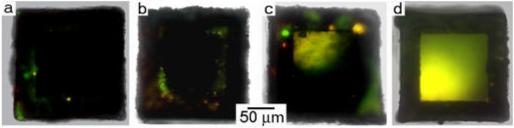
(a-d) Timed experiments of fluorescent bead intensity of the micromembranes illustrating increasing bead capture with increased sampling time over a period of 24 hours. a, 30 minutes; b, 2 hours; c, 8 hours; and d, 24 hours.
Cell Sampling
The membrane sampling process utilizing tumbling was biologically compatible, and was used to sample biological entities. Additionally, the Au electrodeposition passivated the metallic surfaces of the membranes and made them bio-inert for cell culture. [19] We utilized the sampling process to capture trypsinized fibroblast cells in 50−200 μL media solutions. When retrieved from the solutions after 45 minutes of tumbling, the membranes were rinsed and immediately stained for cell viability. We observed viable green fluorescing cells within the membrane that were clearly visible and could be counted (Fig. 5a). On average over four trials, 50−75 viable, green fluorescing cells were observed; no dead, red fluorescing cells were seen. This experiment highlights the minimally invasive and benign attributes of our sampling methodology towards cells. We were also able to multiply the cells captured within the membrane using standard cell culture procedures. Here, we first rinsed the membranes in media and pipetted them up and down to remove cells adherent to the outer surfaces of the membrane. We verified that the rinsing did not dislodge or damage the captured cells within the membrane. After incubation for 48 hours, the cells had multiplied, filling the membrane and even covering the tops and sides of the micromembranes (Fig. 5b). This cell culture experiment was repeated six times.
Figure 5.

a, Bright-field (left) and fluorescent (right) images focused on the top face of an Au-coated membrane with entrapped fibroblast cells, stained with the LIVE/DEAD® assay immediately after tumbling showing 50–75 green fluorescent live cells; no dead red fluorescent cells were observed b, Bright-field (left) and fluorescent (right) images such as that in a, but following 48 h of incubation in cell culture media. The cells have multiplied and filled the membrane, even covering the tops and sides.
CONCLUSION
In conclusion, we have demonstrated a straightforward strategy to sample objects and cells in small microliter volumes of liquid based on size. As a first step towards cell separations, the mobile membranes were used to entrap fibroblast cells. Since the surfaces were porous, media diffused into and out of the membranes, permitting subsequent culture. This porosity provides control over the local cell microenvironment in 3D and utilizes minimal reagents, thereby complementing other microfluidic methods in bioengineering. [20] Three-dimensional membrane sampling has the potential to be used for the isolation and culture of stem cells. [21] Size selective sieving, for example, with a 3 μm porous filter has been shown to isolate mesenchymal stem cells from bone marrow aspirates [22] and human embryonic stem cells have been successfully cultured in lithographically fabricated microwells with dimensions similar to our membranes. [23]
In addition to sampling, the membranes could provide an attractive platform for enabling minimally invasive separation based on size. However, in order to achieve more advanced separations, it will be necessary to increase the propensity of the objects to remain within the membrane once they enter. For example, it should be possible to chemically functionalize the interior walls of the membrane so that objects adhere to it. [19] Other possible strategies to facilitate a higher retention within the membrane include directional steering of the membrane in the fluid and modification of the shape and size of the open face. At the present time, there is no preferential direction for motion of the membrane during tumbling. Since our membranes are magnetic, this motion could be directed by engineering magnetic anisotropy into the faces of the membrane and moving it with a directional magnetic field. Also, manipulation and remote guidance of similarly shaped metallic cubes in microchannels have been demonstrated in detail in a previous publication [24]. Micromanipulation of our micromembranes within microfluidic channels has the potential to further decrease the sample size needed for sieving over PCR tubes.[25] Modification of the shape, size and symmetry of the open face can be used to prevent smaller objects of interest from exiting the membrane and larger, unwanted ones from entering. This modification can be readily achieved by making changes to the initial photomask designs used in the microfabrication process; our fabrication and assembly process allows the construction of cube shaped membranes with anisotropic porosity on one or all faces. By controlling the dimensions of the open face, we can design micromembranes that limit the size of objects able to enter it. This exclusion based on window size would be particularly important in preventing larger biological debris from clogging the membranes during cell separation experiments.
It should be noted that changes in the pore size, distribution and density affect the separation characteristics of the 3D membranes. In the case where the porosity of the face is increased there is a corresponding increase in flux, whereas a decrease in porosity creates dead zones. These dead zones are areas where sampled material tends to aggregate such as the micromembrane edges and surface faces with no pores in the immediate vicinity, e.g. corners. It should be noted that a highlight of the fabrication process used to construct the 3D membranes is that the pores are defined by conventional 2D lithography which has demonstrated capabilities in terms of patterning a wide range of sizes, shapes and materials. Hence, we believe that it is straightforward to extend our approach to construct 3D micromembranes with a wide range of pore sizes, distributions and densities for different applications.
ACKNOWLEDGMENT
This work was supported by the NIH Grant: R21EB007487-01A1 and the NSF Grant MRSEC DMR05-20491. The content is solely the responsibility of the authors and does not necessarily represent the official views of the funding agencies. We acknowledge Anum Azam for her illustration contribution.
Footnotes
SUPPORTING INFORMATION AVAILABLE
Movie clip showing autonomous motion of a Pt coated membrane in a peroxide solution. This material is available free of charge via the Internet at http://pubs.acs.org.
REFERENCES
- 1.Leong T, Lester PA, Koh TL, Call E, Gracias DH. Langmuir. 2007;23:8747–8751. doi: 10.1021/la700913m. [DOI] [PubMed] [Google Scholar]
- 2.Schafer A. Nanofiltration Principles and Applications. Elsevier Inc; New York, NY: 2005. [Google Scholar]
- 3.Choi JW. Methods Mol Biol. 2006;321:65–81. doi: 10.1385/1-59259-997-4:65. [DOI] [PubMed] [Google Scholar]
- 4.Yu H. Anal Chim Acta. 1998;376:77–81. [Google Scholar]
- 5.Van Emon JM, Gerlach CL, Bowman K. J Chromatogr. 1998;B 715:211–228. doi: 10.1016/s0378-4347(98)00261-8. [DOI] [PubMed] [Google Scholar]
- 6.Singh PC, Singh RK. Trends Food Sci Technol. 1996;7:49–58. [Google Scholar]
- 7.Yamamoto H, Liljestrand HM, Shimizu Y, Morita M. Environ Sci Technol. 2003;37:2646–2657. doi: 10.1021/es026405w. [DOI] [PubMed] [Google Scholar]
- 8.Nakao S, Kimura S. Journal of Chemical Engineering of Japan. 1982;15:200–205. [Google Scholar]
- 9.Athanassiadou P, Grapsa D. Cancer Metastasis Rev. 2006;25:507–519. doi: 10.1007/s10555-006-9030-2. [DOI] [PubMed] [Google Scholar]
- 10.Fleischer RL, Price PB, Walker RM. Science. 1965;149:383–393. doi: 10.1126/science.149.3682.383. [DOI] [PubMed] [Google Scholar]
- 11.Vona G, Sabile A, Louha M, Sitruk V, Romana S, Schütze K, Capron F, Franco D, Pazzagli M, Vekemans M, Lacour B, Bréchot C, Paterlini-Bréchot P. Am J Pathol. 2000;156:57–63. doi: 10.1016/S0002-9440(10)64706-2. [DOI] [PMC free article] [PubMed] [Google Scholar]
- 12.Knudson RP, Alden ER. Pediatrics. 1980;65:505–507. [PubMed] [Google Scholar]
- 13.Graham D. Molecular Self-Assembly. Sigma Aldrich Company; Milwaukee WI: 2006. [Google Scholar]
- 14.Love JC, Estroff LA, Kriebel JK, Nuzzo RG, Whitesides GM. Chem Rev. 2005;105:1103–1169. doi: 10.1021/cr0300789. [DOI] [PubMed] [Google Scholar]
- 15. [21 July 2007]; L929, ATCC Number: CCL-1 product guide. Available from: http://www.atcc.org/
- 16. [10 September 2008]; Live/Dead Viability/Cytotoxicity Kit, Invitrogen Number: L3224 product guide. Available from: http://probes.invitrogen.com/
- 17.Ismagilov RF, Schwartz A, Bowden N, Whitesides GM. Angew Chem, Int Ed. 2002;41:65–654. [Google Scholar]
- 18.Dhillon S. Clinical Pharmacokinetics. Pharmaceutical Press; London UK: 2006. [Google Scholar]
- 19.Randall CL, Leong TG, Bassik N, Gracias DH. Adv Drug Delivery Rev. 2007;59:1547–1561. doi: 10.1016/j.addr.2007.08.024. [DOI] [PubMed] [Google Scholar]
- 20.Park TH, Shuler ML. Biotechnol Prog. 2003;19:243–253. doi: 10.1021/bp020143k. [DOI] [PubMed] [Google Scholar]
- 21.Metallo CM, Mohr JC, Detzel CJ, Pablo JJ, Wie BJ, Palecek SP. Biotechnol Prog. 2007;23:18–23. doi: 10.1021/bp060350a. [DOI] [PubMed] [Google Scholar]
- 22.Hung SC, Chen NJ, Hsieh SL, Li H, Ma HL, Lo WH. Stem Cells. 2002;20:249–258. doi: 10.1634/stemcells.20-3-249. [DOI] [PubMed] [Google Scholar]
- 23.Mohr JC, de Pablo JJ, Palecek SP. Biomat. 2006;27:6032–6042. doi: 10.1016/j.biomaterials.2006.07.012. [DOI] [PubMed] [Google Scholar]
- 24.Ye H, Randall CL, Leong TG, Slanac DA, Call EK, Gracias DH. Angew Chem, Int Ed. 2007;46:4991–4994. doi: 10.1002/anie.200604414. [DOI] [PubMed] [Google Scholar]
- 25.Pihl J, Karlsson M, Chiu DT. Drug Discov Today. 2005;10:1377–1383. doi: 10.1016/S1359-6446(05)03571-3. [DOI] [PubMed] [Google Scholar]