

Abstract
We describe a method to measure in vivo migration of human T cells by using the near-infrared (NIR) dye IRDye800CW. Labeling of Epstein–Barr virus-specific T cells with IRDye800CW did not affect viability, proliferation, or T cell function. Following tail vein injection into mice bearing subcutaneous tumors, the NIR signal could be measured in vivo at the tumor site. Analysis of tumors revealed T cell infiltration and an increased NIR signal, confirming T cell migration. To test specific migration with IRDye800CW, tumors were modified to express CCL5 to measure site-specific migration. The NIR signal was increased at CCL5-secreting tumors compared with control tumors. Together, these data suggest that IRDye800CW may be used to study the trafficking of T cells in a small animal model and may have potential as a short-term reporter molecule for human immunotherapy studies.
1. Introduction
Adoptive transfer of antigen-specific cytotoxic T lymphocytes (CTLs) is a promising therapy for cancer [1,2]; however, durable antitumor effects are seldom seen, despite the infusion of large numbers of highly specific antitumor CTLs [3]. Analysis of the migration of infused CTLs following labeling with radioisotopes such as 111In suggests that poor trafficking of CTLs to distant tumor metastases may be one reason for this shortcoming [4–6]. 111In and other radioisotopes have been shown to suppress T cell function, including proliferation and cytotoxicity [7], indicating that development of alternative imaging techniques that both are nontoxic to the cells and allow in vivo tracking of CTLs would be useful for understanding the migration and biodistribution of CTLs following adoptive transfer.
Bioluminescence imaging is now a common imaging tool in mice [8–11], where genetic modification of T cells with bioluminescent reporter genes allows detection and analysis of migration [12]. However, bioluminescence imaging requires injection of substrate (e.g., D-luciferin), and light emitted from this reaction can be attenuated by tissue light scattering and absorption by blood proteins including hemoglobin, myoglobin, and bilirubin, which limit detection sensitivity [13]. Other in vivo imaging techniques are available for monitoring the fate of adoptively transferred cells, including radiography, magnetic resonance imaging [14–16], and positron emission tomography [17,18]. While these methods allow deep tissue penetration, they are expensive and often lack sufficient resolution for precise trafficking studies.
Red (∼625–740 nm) to near-infrared (NIR, ∼700–1000 nm) fluorescence molecules have recently been used for noninvasive in vivo imaging because of their low tissue absorption compared with other fluorescent probes such as green fluorescent protein [13,19,20]. The high photon count generated from fluorescent probes (109 imagable photons per fluorescent molecule per second) allows greater resolution than nuclear imaging techniques (1 imaging photon event per radiotracer molecule) [21,22] permitting real-time, dynamic imaging of biological processes [20,23–25]. Swirski et al. demonstrated that murine splenocytes could be labeled with a biocompatible far-red fluorophore [VT680, 670 nm excitation (ex), 688 nm emissions (em)] that could be tracked noninvasively in mice with high sensitivity and resolution by in vivo optical imaging [20]. While this study demonstrated the feasibility of using fluorescent dyes for observing T cell migration, NIR dyes with longer wavelengths (>750 nm) may allow even greater tissue penetration and sensitivity. Adams et al. recently compared the in vivo sensitivity of far-red versus infrared dyes for detecting tumors in mice by using epidermal growth factor receptor antibody conjugated to either Cy5.5 (ex/em 660/710 nm), which has properties similar to VT680, or to the NIR dye IRDye800CW (ex/em 785/830 nm) [26]. This study demonstrated that IRDye800CW resulted in significantly reduced background noise and an enhanced signal-to-background ratio.
Here we examine the IRDye800CW for its ability to bind to human T cells and allow the tracking of migration following injection into immune deficient mice. Like VT680, IRDye800CW bears an N-hydroxysuccinimide (NHS) reactive group that allows the molecule to couple to free amino groups on proteins to form a stable conjugate. We hypothesized that incubating T cells with the NIR molecule would subsequently allow rapid and nontoxic in vivo NIR optical imaging. In this study, we demonstrate that IRDye800CW efficiently binds to T cell surface proteins without affecting T cell function while enabling the study of T cell trafficking and migration to distant tumor sites following intravenous injection.
2. Methods
Donors and cell lines
Peripheral blood was obtained with informed consent from healthy Epstein–Barr virus (EBV) seropositive individuals by using an approved protocol from the Baylor College of Medicine Institutional Review Board. Peripheral blood mononuclear cells (PBMCs) were isolated in BD Vacutainer CPT tubes [Becton Dickinson, Franklin Lakes, New Jersey (BD)]. PBMCs were used to generate EBV-transformed B cell lines (LCLs) as previously described [1,2]. LCL, nontransduced Karpas-299 (K-NT), and Karpas transduced to secrete the chemokine CCL5 (K-CCL5) were maintained in RPMI 1640 supplemented with 2 mM GlutaMAX-1 (Invitrogen, Carlsbad, California) and 10% fetal bovine serum (Hyclone, Logan, Utah). Cytotoxic T lymphocytes and T cell blasts were expanded and maintained in 45% RPMI 1640, 45% Click (Eagle Ham amino acids, Irvine Scientific, Santa Anna, California), 2 mM GlutaMAX-1, 10% fetal bovine serum, referred to hereafter as T cell media (TCM).
Generation of EBV-specific CTLs and OKT3 T cell blasts
EBV-specific CTLs were generated as previously described [1,2]. Briefly, PBMCs were stimulated in 24-well plates with autologous LCL at a responder-to-stimulator ratio of 40:1. After 1 week, CTLs were restimulated with LCL at a ratio of 40:1 in the presence of 50 U/ml(units per milliliter) IL-2 (Proleukin, Chiron, Emeryville, California). EBV-specific CTLs were further expanded by weekly restimulation in IL-2 containing TCM. To generate OKT3 T cell blasts, nontissue culture treated plates were coated with 1 μg/ml of OKT3 (anti-CD3 antibody; Ortho Biotech, Bridgewater, New Jersey) overnight at 4°C. After the plate was washed to remove excess antibody, 5 × 10⁵ PBMCs were plated in TCM supplemented with 100 U/ml IL-2. After 3 days, activated T cells were harvested and expanded in TCM containing IL-2.
Labeling CTLs with IRDye800CW NHS ester infrared dye
IRDye800CW and IRDye700DX (Li-Cor Biosciences, Lincoln, Nebraska) were diluted as per the manufacturer's recommendations in dimethyl-sulphoxide (DMSO) to a stock concentration of 1 μg/ml. Initial dye binding studies used IRDye700DX, and OKT3-activated T cells were labeled with an increasing concentration of dye (0–100 μg/ml). For labeling, T cells were resuspended at 1 × 10⁷ cells/ml in phosphate-buffered saline (PBS, pH 7.4) and incubated with dye for 2 h at room temperature. Following incubation, T cells were washed three times in PBS and either resuspended in PBS for injection or cultured in TCM. Subsequent experiments using IRDye800CW were carried out at a labeling concentration of 50 μg/ml per 1 × 10⁷ T cells.
Flow cytotometric analysis of IRDye700-labeled T cells
To examine the binding kinetics of IRDye700DX, we incubated OKT3-activated T cells with IRDye700DX, costained them with CD3 FITC (BD), and analyzed the cells on a FACScan flow cytometer (BD), comparing mean fluorescence intensity (MFI) to unlabeled T cells at increasing concentrations of IRDye700. To determine the loss of IRDye700 signal over time, “rested” T cells (sustained in IL-2 but not activated by OKT3 within 7 days) or “activated” T cells (2 days post OKT3 activation) were labeled and measured for IRDye700 MFI daily for 4 days.
ELIspot and cytotoxicity assays
Enzyme-linked immunosorbent spot (ELIspot) assays were performed as previously described [24,27]. Briefly, Multiscreen 96-well plates (Millipore, Bedford, Massachusetts) were coated with IFN-γ capture antibody overnight at 4°C. The wells were washed with PBS, then blocked with TCM with AB sera. CTLs were resuspended in media and 1 × 10⁵ CTLs per well were plated in triplicate into the plate along with 1 × 10⁴ autologous or allogeneic LCLs. In each assay, negative controls included CTLs alone and with MHC mismatched allogeneic LCLs. After 16–20 h, the plates were developed as previously published. The spot number was determined in an independent blinded fashion (ZellNet Consulting, Inc., New York, New York) using an automated ELIspot Reader System (Carl Zeiss, Inc., Thornwood, New York). For cytotoxicity assays, standard 4 h 51Cr assays were performed. First, autologous or MHC (major histocompatibility complex) mismatched allogeneic LCLs were labeled with 15 μM 51Cr (MP Biomedical, Solon, Ohio) for 90 min at 37°C, then washed and incubated with increasing numbers of effector T cells. After 4 h, supernatants were collected and analyzed in a γ counter (Cobra Spectrum, Packard Biosciences, Meriden, Connecticut). Specific cytotoxicity was calculated by using the following equation: % lysis = (experiment lysis − spontaneous release)/(maximum lysis − spontaneous release) × 100.
In vivo athymic nude xenograft murine model
All animal studies were approved by the Institutional Review Board of Baylor College of Medicine. To examine the effectiveness of IRDye800CW labeling for monitoring migration of T cells in vivo, six to eight-week-old female athymic nude mice (Harlan Sprague Dawley, Inc., Indianapolis, Indiana) were injected subcutaneously (s.c.) with 1 × 10⁷ LCL or 5 × 10⁶ Karpas (K-NT or K-CCL5) resuspended in 100 μl Matrigel (BD). After tumors were established (7–14 days), 1 × 10⁷ IRDye800CW-labeled T cells were injected intravenously (i.v.) in 200 μ1 PBS via the tail vein. T cell biodistribution was then measured by NIR fluorescence imaging at 1, 24, 48, and 72 h postinjection. Mice were sacrificed and tumors and organs were removed for imaging and immunohistochemistry at these time points.
NIR-fluorescence-enhanced intensified CCD in vivo imaging
For in vivo fluorescence-based optical imaging, we illuminated the animal with light from a laser diode (85 mA for 785 nm light) expanded to an ∼10 cm diameter area. We collected the re-emitted fluorescent light by an electron-multiplying CCD camera (Model PhotoMAX:512B, Princeton Instruments, Trenton, New Jersey). Filter sets positioned before the 50 mm lens included a bandpass filter (830 nm center wavelength for NIR dye) to transmit fluorescent emission light and a holographic notch-plus band rejection filter (785 nm center wavelength, Kaiser Optical Systems, Inc., Ann Arbor, Michigan, optical density at 1x reported to be >6) to reject back-scattered and reflected excitation light. For image acquisition we used V + + software (Digital Optics, Auckland, New Zealand). Data processing and analysis used Matlab software (The MathWorks, Inc., Natick, Massachusetts). The integration time for each image was 800 ms. Dynamic imaging data were collected for up to 20–40 min.
NIR-fluorescence confocal microscopy
IRDye800CW-dye-labeled T cell nucleus was counterstained with 1 μM of Sytox Green (Invitrogen, Carlsbad, California) in 95% ethanol for 15 min at 4°C. Images were recorded by a fluorescent microscope and an Olympus confocal microscope outfitted with NIR diode sources and filters (Model Fluoview 1000, Olympus America, Center Valley, Pennsylvania).
In vitro and in vivo migration assays
We used transwell migration assays to confirm that EBV-specific CTLs and OKT3-activated T cells migrate in response to CCL5 secreted by LCL and genetically modified Karpas tumor cells. Briefly, T cells were labeled with 0.1 mCi 51Cr for 90 min at 37°C. After the washing, 1.5 × 10⁵ labeled T cells were placed in the top chamber containing a 0.5 μm polycarbonate membrane insert (Transwell, Corning Inc., Corning, New York). Media containing soluble CCL5 (0–50 ng/ml) was placed in the bottom chamber to induce T cell chemotaxis. After incubation at 37°C for 3 h, the insert chamber was removed, and the cells were harvested and lysed in 1% Triton-X (Sigma). We measured 51Cr release and normalized it to spontaneous (media alone) and maximum (T cells placed directly in the lower chamber) release. To confirm that the NIR signal detected in LCL tumors was specific to T cell migration, an in vivo migration assay was developed. Here, 5 × 10⁶ K-NT (left) and K-CCL5 (right) were resuspended in Matrigel (BD) and injected s.c. into contralateral flanks. After 7 days, IRDye800CW-labeled T cells were injected i.v., and specific migration into either tumor was measured.
Immunohistochemical analysis of T cell infiltration
To verify that the NIR fluorescent signal originated from IRDye800CW-labeled T cells, we fixed mouse tissue (heart, liver, lungs, spleen, and tumor) in 10% neutral buffered formalin (v/v) (Richard-Allan Scientific, Kalamazoo, Michigan) and then placed it in paraffin blocks. Paraffin sections were then examined for histology following hematoxylin and eosin staining. To distinguish between infiltrating T cells and LCL tumor cells, paraffin sections were stained with human anti-CD3 (BD) antibody followed by biotinylated goat secondary antibody and then peroxidase-labeled streptavidin. CD3 antigen was visualized by incubation with aminoethylcarbazole (AEC) substrate in the presence of hydrogen peroxide. Nonimmune mouse IgG was used in place of specific antibody for negative control sections.
3. Results
Confocal analysis of IRDye800CW labeling on activated T cells
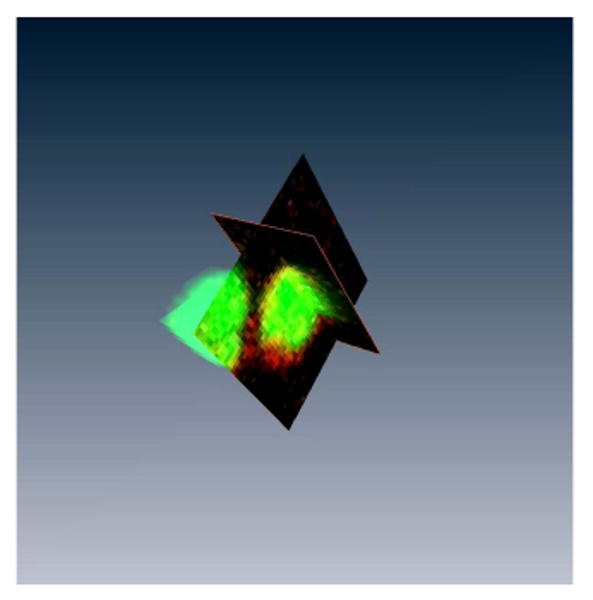
IRDye800CW contains an NHS ester reactive group that binds to primary and secondary amino groups on proteins and that has been commonly used for the conjugation of antibodies for immunoblot assays and as an in vivo imaging agent. To determine whether IRDye NHS ester reagents could bind directly to cell surface proteins, T cells were incubated with IRDye700CW NHS ester, which emits fluorescence light at 687 nm and is detectable by conventional flow cytometers. OKT3-activated T cells were first labeled with IRDye700DX and subsequently costained with CD3 FITC and analyzed by FACS [Fig. 1(a)]. Titration of IRDye700DX shows that maximal labeling of T cells occurs at a concentration of 50 μg/ml, at which >95% of all T cells are labeled with IRDye700DX [Figs. 1(a) and 1(b)]. This signal was relatively stable in nondividing (resting) T cells, where signal was detectable for 96 h [Fig. 1(c)]. In contrast, IRDye700DX signal was lost from rapidly dividing T cells 24–48 h after activation. Despite detecting binding of IRDye700DX by flow cytometry, the fluorescence was suboptimal owing to ineffective excitation with the 635 nm laser. Therefore we confirmed cell binding of the NIR variant, IRDye800CW, using a confocal microscope fitted with a NIR diode laser. This analysis showed that IRDye800CW binding is localized around the cell membrane, indicating that IRDye800CW, like IRDye700DX, binds to the T cell surface [Fig. 1(d)]. Binding of IRDye800CW is more clearly visualized when z-stack reconstruction of the confocal images is composed into a 3D movie (see Fig. 2, Media 1). Together, these results indicate that incubation of activated T cells with IRDye NHS ester dyes allows dye binding to cell surface proteins.
Fig. 1.
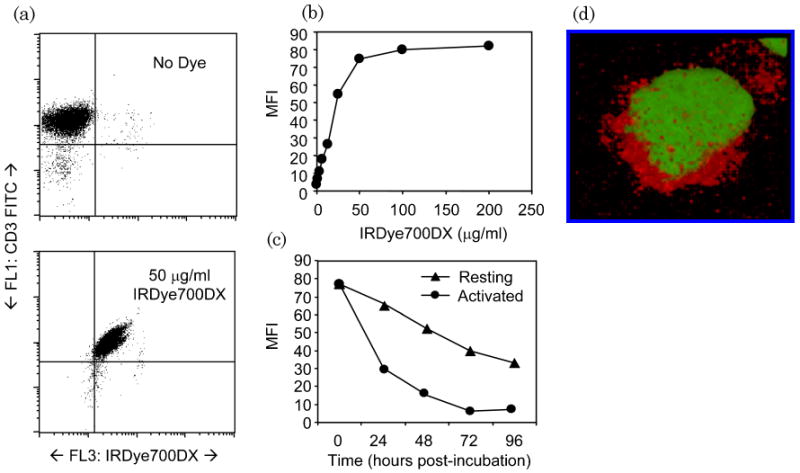
Labeling T cells with NHS ester dye. (a), (b) OKT3-activated T cells were incubated with IRDye700DX at concentrations between 0 and 200 μg/ml and analyzed by flow cytometry for MFI. Costaining with CD3 FITC shows that at 50 μg/ml, >90% of T cells are labeled with IRDye700DX. (c) Rested (>7 days post OKT3 stimulation) and activated (>2 days post stimulation) were labeled with IRDye700DX and analyzed for MFI daily. Activated T cells rapidly lost IRDye700DX signal, whereas nonproliferating T cells retained NIR signal. (Media 1) (d) To demonstrate that IRDye800CW binds to T cells, OKT3-stimulated T cells were incubated with IRDye800CW and then counterstained with Sytox Green. Cells were then fixed to a slide and examined by a confocal microscope fitted with a NIR diode source. Individual stack images were reconstructed to observe the colocalization of IRDye800CW.
Fig. 2.
Confocal microscopy of IRDye800CW-labeled OKT3-activated T cells. This movie is compiled from z-stack images from T cells costained with IRDye800CW and Sytox Green. Reconstruction of the images demonstrates the specific labeling of IRDye800CW on T cells.
IRDye800CW labeling does not affect EBV-specific CTL viability or function
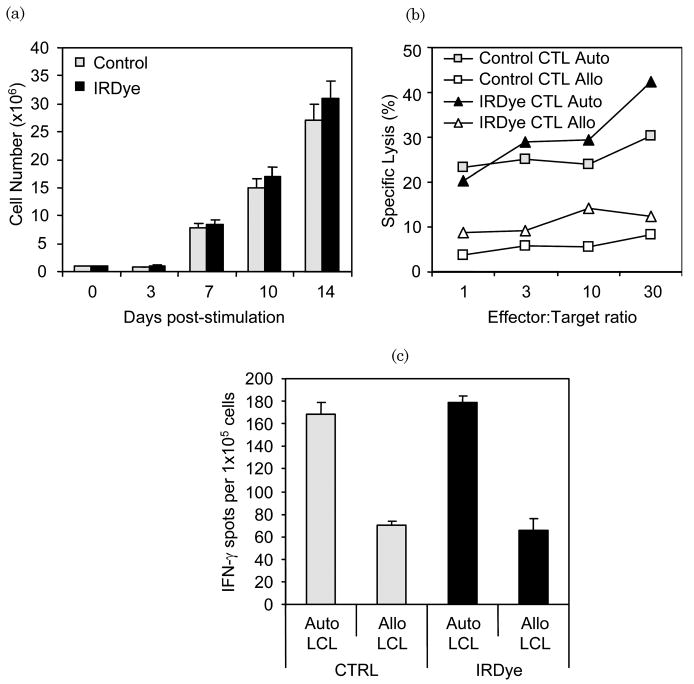
To test the effects of IRDye800CW labeling on T cell function, labeled and unlabeled EBV-specific CTLs were compared for proliferation, cytotoxicity and IFN-γ release following antigen stimulation. After labeling CTLs with IRDye800CW, there was no significant decrease in viability (>90%, not shown) and no effect on LCL-induced proliferation compared with nonlabeled CTLs [Fig. 3(a)]. Next, we cocultured EBV-specific CTLs with autologous or allogeneic (MHC mismatched) LCL and found that both IRDye800CW-labeled and nonlabeled EBV-specific CTLs produced IFN-γ in ELIspot assays in response to the autologous but not the allogeneic LCL, showing retention of MHC restricted antigen specificity [Fig. 3(b)]. Additionally, both labeled and nonlabeled CTLs had identical patterns of cytotoxicity against autologous but not allogeneic LCL [Fig. 3(c)]. Therefore, IRDye800CW labeling does not appreciably affect cell viability, proliferation, cytokine production (i.e., IFN-γ), or cytotoxic function.
Fig. 3.
IRDye800CW does not affect proliferation and function of EBV-specific CTLs. (a) IRDye800CW-labeled and nonlabeled EBV-specific CTLs were stimulated with autologous LCL enumerated for proliferation. No difference in CTL expansion was observed over a 14 day period. (b) IRDye800CW-labeled and nonlabeled CTLs were analyzed for the effect of IRDye800CW binding on cytotoxic function against autologous and allogeneic LCL. Both nonlabeled and IRDye800CW-labeled CTLs were capable of recognizing and lysing autologous LCL but not allogeneic LCL. (c) Labeled and unlabeled control CTLs were compared for IFN-γ production in an ELIspot assay against autologous and allogeneic LCL. IRDye800CW did not affect the ability of CTLs to produce IFN-γ.
Analysis of EBV-specific CTL migration in vivo using IRDye800CW
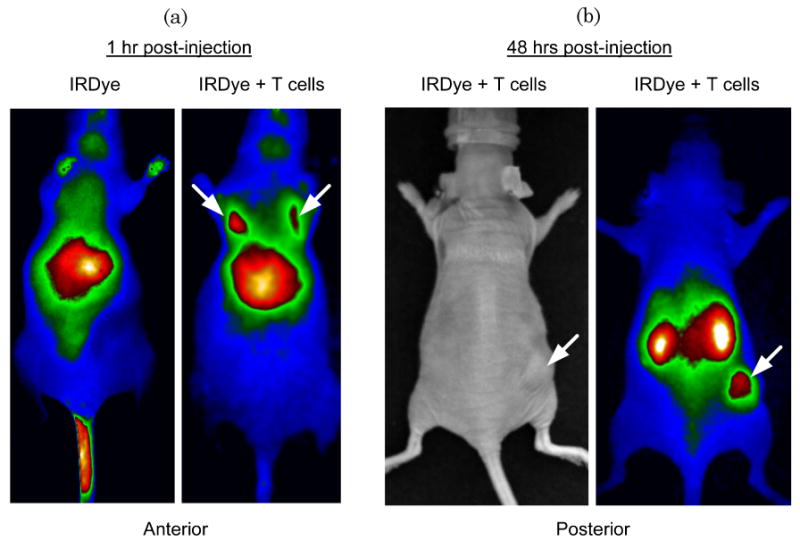
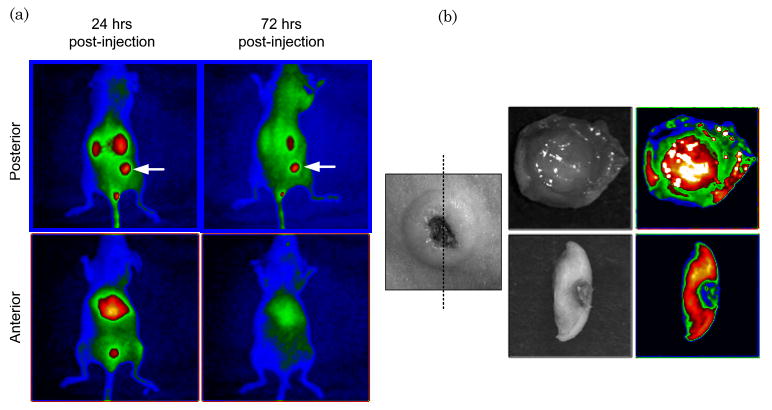
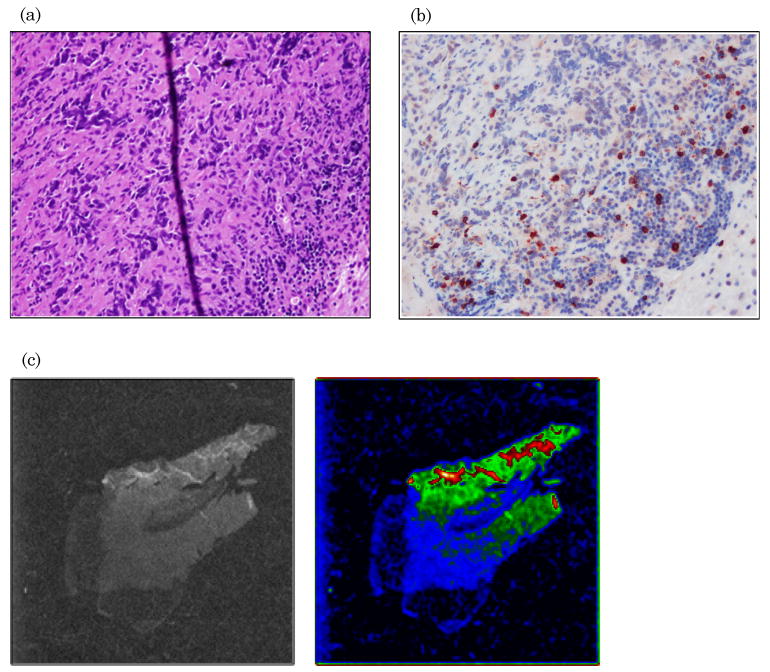
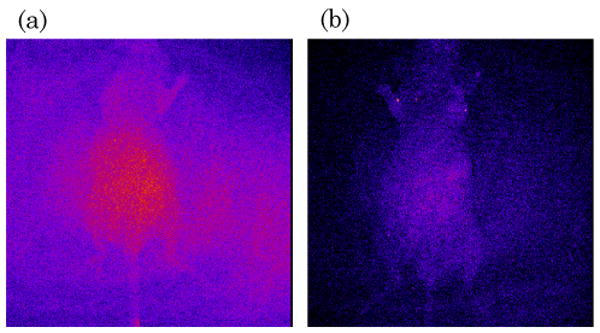
Previous studies used luciferase-transduced EBV-specific CTLs injected i.v. into SCID mice bearing s.c. LCL tumors to show that CTLs selectively migrate to the tumor site [12]. We used similar experiments to track migration of IRDye800CW-labeled CTLs following i.v. injection. We dynamically imaged the mice over the first 40 min post i.v. injection to measure cell-specific biodistribution following injection of either free dye or labeled CTLs. A greater signal from labeled CTLs was detected in the lungs of the mice compared with free IRDye800CW [Fig. 4(a) and 5, Media 2 and 3]. Similar data are obtained by using luciferase-transduced CTLs, which can also be detected in the lungs 1 h after i.v. injection (data not shown). Mice bearing s.c. LCL tumors on the right flank were then imaged at 48 h to measure subsequent accumulation of IRDye800CW signal at the tumor site. Figure 4(b) shows intense NIR signal at the site of the s.c. tumor, in addition to nonspecific NIR signal in the kidneys, as NIR signal accumulation occurs in mice injected with free IRDye800CW (data not shown). We also obtained images up to 72 h post CTL injection from additional animals, which continued to produce NIR fluorescence (Fig. 6). Posterior imaging of the mice again showed accumulation of the NIR signal in the urinary tract (kidneys, bladder) and at the tumor site. Signal was detected in the liver of animals when anterior imaging was performed [Fig. 6(a)]. Excised LCL tumor showed a strong NIR signal within the tumor itself [Fig. 6(b)]. To confirm that T cell infiltration of the tumor had occurred, excised tumors were paraffin embedded, sectioned, and stained (Fig. 7), showing infiltration of CD3+ human T cells within the tumor [Fig. 7(a) and 7(b)]. The same immunohistochemistry sections were also NIR-derived signal positive [Fig. 7(c)].
Fig. 4.
IRDye800CW allows measurement of biodistribution and migration of CTLs. (Media 2) (Media 3) (a) Athymic nude mice were injected s.c. with LCL cells followed by injection of either IRDye800CW dye alone (left panel) or EBV-specific CTLs labeled with IRDye800CW. After 1 h, mice were imaged for NIR signal. Mice injected with IRDye800CW alone show nonspecific NIR accumulation in the liver, whereas mice injected with CTL + IRDye800CW show that CTLs accumulate in the lungs shortly after i.v. injection. (b) After 48 h, mice with injected with IRDye800CW-labeled CTLs were examined for NIR signal. NIR signal accumulation was observed in the tumor site (indicated by an arrow) and nonspecific signal in the kidneys, demonstrating that IRDye800CW labeling can be used to detect migration of CTLs to distant tumor sites.
Fig. 5.
Dynamic imaging of mice injected with IRDye800CW alone or labeled T cells. Mice were injected with IRDye800CW alone in PBS, and images were taken at intervals of 800 ms for 40 min. Mice were injected with T cells labeled with IRDye800CW, and images were taken as above. Compilation of the images to generate a movie shows the accumulation of NIR signal in the lungs and liver of mice injected with IRDye800CW-labeled T cells, whereas mice injected only with dye show only nonspecific signal in the liver.
Fig. 6.
IRDye800CW NIR signal shows specific accumulation to LCL tumors. (a) Analysis of mice with s.c. LCL tumors (indicated by an arrow) demonstrate nonspecific NIR signal in the kidneys (posterior view) and liver (anterior view). However, NIR signal persists within the tumor site for up to 72 h post CTL injection (top left panel). (b) Excision of the LCL tumor and cross sectioning showed NIR signal within the LCL tumor, suggesting CTL infiltration.
Fig. 7.
CTLs infiltrate LCL tumor and are responsible for NIR signal. (a) Excised LCL tumors were sectioned and hematoxylin and eosin stained; (b) by immunohistochemistry for human anti-CD3 antibody. (c) The same tissue slices were subsequently examined on a microscope fitted with NIR filters. These tumor slices show the presence of NIR signal.
IRDye800CW labeling allows detection of enhanced migration of T cells to CCL5-producing tumors
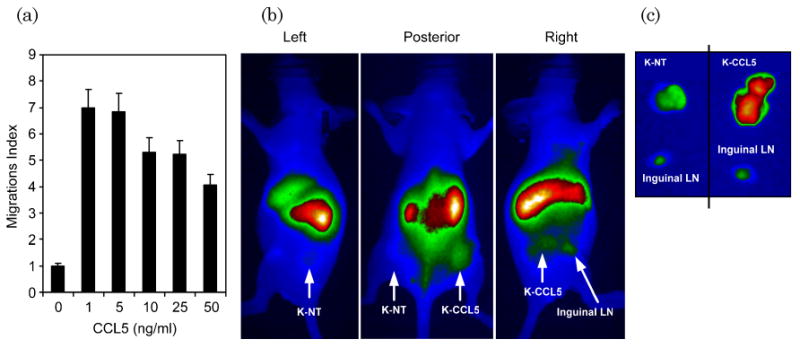
Activated CTLs express high levels of the chemokine receptor CCR5, which induces specific migration to the chemokine CCL5 [28]. Overexpression of CCL5 in the cell line Karpas-299, which does not normally produce the chemokine, allows CTL chemotaxis to be measured. We used transwell migration assays to demonstrate that CTLs would migrate to CCL5 in vitro [Fig. 8(a)]. Next, mice were injected with K-NT (left flank) and K-CCL5 (right flank) followed by injection of IRDye800CW-labeled CTLs. After 48 h, whole body imaging showed accumulation of NIR signal in the CCL5-producing tumor (K-CCL5) but not in the nontransduced tumor (K-NT) [Fig. 8(b)]. After excision we measured fluorescence signal from each tumor, and, as anticipated, NIR signal was greater from K-CCL5 than from K-NT [Fig. 8(c)]. As an internal control, the regional inguinal lymph nodes are shown for both sides, which also have limited NIR signal. These data suggest that NIR signal detected in LCL and Karpas tumors is due to the infiltration of IRDye800CW-labeled T cells rather than to nonspecific accumulation.
Fig. 8.
In vivo migration assays demonstrate specific NIR signal accumulation by CCL5-homing CTLs. (a) EBV-specific CTLs and OKT3 stimulated T cells express the chemokine CCR5 and migrate in response to CCL5 chemokine secretion. Here, EBV-specific CTLs show specific migration towards CCL5 in transwell migration assays. (b) To demonstrate specific NIR signal accumulation by CTLs, nonmodified Karpas tumor cells (K-NT) or Karpas cells transduced with the chemokine CCL5 (K-CCL5) were injected s.c. into the left and right flank, respectively. Next, IRDye800CW-labeled CTLs were injected i.v., and mice were imaged for NIR signal after 48 h. NIR signal accumulated in K-CCL5 tumors but not in K-NT tumors, demonstrating that NIR signal is dependent on migration of CTLs into the tumor tissue rather than any nonspecific accumulation. (c) Both K-NT and K-CCL5 tumors and local inguinal lymph nodes (LN) were excised and imaged for NIR signal. As observed by noninvasive imaging, K-CCL5 showed higher NIR signal than K-NT tumors, indicating that CTL migration was responsible for NIR signal accumulation.
4. Discussion
Adoptive transfer of antigen-specific CTLs for the treatment of cancer and infectious disease is dependent on the cellular trafficking to areas of disease. To follow the complex biological processes that govern lymphocyte migration, novel techniques for measuring T cell behavior in vivo are needed. In this study, we showed that an NIR fluorophore, IRDye800CW, allows tracking of T cell biodistribution and specific migration to distant tumor sites. We found that IRDye800CW rapidly and efficiently labeled both CD3-activated T cell blasts as well as EBV-specific CTLs without affecting their viability, proliferation, or function (e.g., cytotoxicity and IFN-γ production). Importantly, it was possible to detect the accumulation of IRDye800CW-labeled T cells following intravenous infusion in subcutaneous tumors up to 72 h post injection, demonstrating the stability and sensitivity of the NIR molecule.
Gamma scintography using radioisotopes such as 111In have been most commonly used to track the migration of immune cells following adoptive transfer [4–6]. However, as observed by Botti et al. [7], we found that labeling EBV-specific CTLs and OKT3-activated T cells with as little as 5 pCi/cell 111In-oxine resulted in significant radiation-induced toxicity and impairment of effector function (data not published). As demonstrated by this study and others, NHS ester dyes such as VT680 [20] and IRDye800CW do not affect the viability or function of labeled T cells, indicating that they appear to be generally biocompatible with T lymphocytes.
Swirski et al. demonstrated that T cell migration can be successfully monitored in vivo by optical imaging using VT680, which has excitation and emission of 670 and 688 nm, respectively [20]. One limitation to optical imaging is autofluorescence produced by host tissue, which can significantly reduce the signal-to-background ratio. However, the use of optical probes with higher emission wavelengths (∼800 nm) may improve sensitivity by reducing the background produced in the far-red spectrum. Indeed, a direct comparison between the NIR dye IRDye800CW and the far-red dye Cy5.5 indicated that NIR fluorescence reduced background and improved detection of tumors when conjugated to a tumor-specific antibody (epidermal growth factor receptor) [26]. This reduction may be essential for adoptive immunotherapy studies where the detection of a small number of cells is required.
While the in vivo imaging results from this study were encouraging, there were several limitations to the NIR NHS ester dyes that must be taken into consideration for adoptive therapy studies. First, unlike proteins that can be expressed in T cells through gene modification (e.g., green fluorescent protein and luciferase), IRDye800CW signal decreased rapidly in dividing cells, making it unsuitable for experiments addressing long-term persistence or in vivo proliferation. Additionally, we observed NIR signal accumulation in the liver and kidney, which not only limited the signal-to-background ratio at tumors injected near these organs, but also suggested that dye was released in vivo during the process of cell division or cell death. Excision of s.c. tumors showed T cell infiltration by immunohistochemistry and diffuse accumulation of NIR signal by confocal microscopy. However, because of technical issues regarding loss of NIR signal during formalin fixation and processing, we were unable to demonstrate NIR signal on CD3+ T cells within the tumor. Nevertheless, the NIR signal from IRDye800CW detected in s.c. tumors was dependent on T cell migration, indicating that this technique is sufficient for in vivo imaging studies using human T cells. In summary, these data suggest that use of IRDye800CW, like other NHS ester dyes, is an attractive method to follow the fate of cells in adoptive transfer studies with minimal manipulation.
References
- 1.Rooney CM, Smith CA, Ng CY, Loftin S, Li C, Krance RA, Brenner MK, Heslop HE. Use of gene-modified virus-specific T lymphocytes to control Epstein–Barr-virus-related lymphoproliferation. Lancet. 1995;345:9–13. doi: 10.1016/s0140-6736(95)91150-2. [DOI] [PubMed] [Google Scholar]
- 2.Heslop HE, Ng CY, Li C, Smith CA, Loftin SK, Krance RA, Brenner MK, Rooney CM. Long-term restoration of immunity against Epstein–Barr virus infection by adoptive transfer of gene-modified virus-specific T lymphocytes. Nat Med. 1996;2:551–555. doi: 10.1038/nm0596-551. [DOI] [PubMed] [Google Scholar]
- 3.Yee C, Thompson JA, Roche P, Byrd DR, Lee PP, Piepkorn M, Kenyon K, Davis MM, Riddell SR, Greenberg PD. Melanocyte destruction after antigen-specific immunotherapy of melanoma: direct evidence of T cell-mediated vitiligo. J Exp Med. 2000;192:1637–1644. doi: 10.1084/jem.192.11.1637. [DOI] [PMC free article] [PubMed] [Google Scholar]
- 4.Pockaj BA, Sherry RM, Wei JP, Yannelli JR, Carter CS, Leitman SF, Carasquillo JA, Steinberg SM, Rosenberg SA, Yang JC. Localization of 111indium-labeled tumor infiltrating lymphocytes to tumor in patients receiving adoptive immunotherapy. Augmentation with cyclophosphamide and correlation with response. Cancer Res. 1994;73:1731–1737. doi: 10.1002/1097-0142(19940315)73:6<1731::aid-cncr2820730630>3.0.co;2-h. [DOI] [PubMed] [Google Scholar]
- 5.Mitchell MS, Darrah D, Yeung D, Halpern S, Wallace A, Voland J, Jones V, Kan-Mitchell J. Phase I trial of adoptive immunotherapy with cytolytic T lymphocytes immunized against a tyrosinase epitope. J Clin Oncol. 2002;20:1075–1086. doi: 10.1200/JCO.2002.20.4.1075. [DOI] [PubMed] [Google Scholar]
- 6.Meidenbauer N, Marienhagen J, Laumer M, Vogl S, Heymann J, Andreesen R, Mackensen A. Survival and tumor localization of adoptively transferred Melan-A-specific T cells in melanoma patients. J Immunol. 2003;170:2161–2169. doi: 10.4049/jimmunol.170.4.2161. [DOI] [PubMed] [Google Scholar]
- 7.Botti C, Negri DR, Seregni E, Ramakrishna V, Arienti F, Maffioli L, Lombardo C, Bogni A, Pascali C, Crippa F, Massaron S, Remonti F, Nerini-Molteni S, Canevari S, Bombardieri E. Comparison of three different methods for radiolabelling human activated T lymphocytes. Eur J Nucl Med Mol Imaging. 1997;24:497–504. doi: 10.1007/BF01267680. [DOI] [PubMed] [Google Scholar]
- 8.Hardy J, Edinger M, Bachmann MH, Negrin RS, Fathman CG, Contag CH. Bioluminescence imaging of lymphocyte trafficking in vivo. Exp Hematol. 2001;29:1353–1360. doi: 10.1016/s0301-472x(01)00756-1. [DOI] [PubMed] [Google Scholar]
- 9.Nakajima A, Seroogy CM, Sandora MR, Tarner IH, Costa GL, Taylor-Edwards C, Bachmann MH, Contag CH, Fathman CG. Antigen-specific T cell-mediated gene therapy in collagen-induced arthritis. J Clin Invest. 2001;107:1293–1301. doi: 10.1172/JCI12037. [DOI] [PMC free article] [PubMed] [Google Scholar]
- 10.Costa GL, Sandora MR, Nakajima A, Nguyen EV, Taylor-Edwards C, Slavin AJ, Contag CH, Fathman CG, Benson JM. Adoptive immunotherapy of experimental autoimmune encephalomyelitis via T cell delivery of the IL-12 p40 subunit. J Immunol. 2001;167:2379–2387. doi: 10.4049/jimmunol.167.4.2379. [DOI] [PubMed] [Google Scholar]
- 11.Brown CE, Vishwanath RP, Aguilar B, Starr R, Najbauer J, Aboody KS, Jensen MC. Tumor-derived chemokine MCP-1/CCL2 is sufficient for mediating tumor tropism of adoptively transferred T cells. J Immunol. 2007;179:3332–3341. doi: 10.4049/jimmunol.179.5.3332. [DOI] [PubMed] [Google Scholar]
- 12.Vera J, Savoldo B, Vigouroux S, Biagi E, Pule M, Rossig C, Wu J, Heslop HE, Rooney CM, Brenner MK, Dotti G. T lymphocytes redirected against the κ light chain of human immunoglobulin efficiently kill mature B lymphocyte-derived malignant cells. Blood. 2006;108:3890–3897. doi: 10.1182/blood-2006-04-017061. [DOI] [PMC free article] [PubMed] [Google Scholar]
- 13.Ballou B, Ernst LA, Waggoner AS. Fluorescence imaging of tumors in vivo. Curr Med Chem. 2005;12:795–805. doi: 10.2174/0929867053507324. [DOI] [PubMed] [Google Scholar]
- 14.Moore A, Grimm J, Han B, Santamaria P. Tracking the recruitment of diabetogenic CD8+ T-cells to the pancreas in real time. Diabetes. 2004;53:1459–1466. doi: 10.2337/diabetes.53.6.1459. [DOI] [PubMed] [Google Scholar]
- 15.Anderson SA, Shukaliak-Quandt J, Jordan EK, Arbab AS, Martin R, McFarland H, Frank JA. Magnetic resonance imaging of labeled T-cells in a mouse model of multiple sclerosis. Ann Neurol. 2004;55:654–659. doi: 10.1002/ana.20066. [DOI] [PubMed] [Google Scholar]
- 16.Billotey C, Aspord C, Beuf O, Piaggio E, Gazeau F, Janier MF, Thivolet C. T-cell homing to the pancreas in autoimmune mouse models of diabetes: in vivo MR imaging. Radiology (Oak Brook, Ill) 2005;236:579–587. doi: 10.1148/radiol.2362040603. [DOI] [PubMed] [Google Scholar]
- 17.Koehne G, Doubrovin M, Doubrovina E, Zanzonico P, Gallardo HF, Ivanova A, Balatoni J, Teruya-Feldstein J, Heller G, May C, Ponomarev V, Ruan S, Finn R, Blasberg RG, Bornmann W, Riviere I, Sadelain M, O'Reilly RJ, Larson SM, Tjuvajev JG. Serial in vivo imaging of the targeted migration of human HSV-TK-transduced antigen-specific lymphocytes. Nat Biotechnol. 2003;21:405–413. doi: 10.1038/nbt805. [DOI] [PubMed] [Google Scholar]
- 18.Doubrovin MM, Doubrovina ES, Zanzonico P, Sadelain M, Larson SM, O'Reilly RJ. In vivo imaging and quantitation of adoptively transferred human antigen-specific T cells transduced to express a human norepinephrine transporter gene. Cancer Res. 2007;67:11959–11969. doi: 10.1158/0008-5472.CAN-07-1250. [DOI] [PubMed] [Google Scholar]
- 19.Frangioni JV. In vivo near-infrared fluorescence imaging. Curr Opin Chem Biol. 2003;7:626–634. doi: 10.1016/j.cbpa.2003.08.007. [DOI] [PubMed] [Google Scholar]
- 20.Swirski FK, Berger CR, Figueiredo JL, Mempel TR, von Andrian UH, Pittet MJ, Weissleder R. A near-infrared cell tracker reagent for multiscopic in vivo imaging and quantification of leukocyte immune responses. PLoS ONE. 2007 October 24;2(10):e1075. doi: 10.1371/journal.pone.0001075. [DOI] [PMC free article] [PubMed] [Google Scholar]
- 21.Wang W, Ke S, Wu Q, Charnsangavej C, Gurfinkel M, Gelovani JG, Abbruzzese JL, Sevick-Muraca EM, Li C. Near-infrared optical imaging of integrin αvB3 in human tumor xenografts. Mol Imaging. 2004;3:343–351. doi: 10.1162/15353500200404148. [DOI] [PubMed] [Google Scholar]
- 22.Houston JP, Ke S, Wang W, Li C, Sevick-Muraca EM. Quality analysis of in vivo near-infrared fluorescence and conventional gamma images acquired using a dual-labeled tumor-targeting probe. J Biomed Opt. 2005;10:054010. doi: 10.1117/1.2114748. [DOI] [PubMed] [Google Scholar]
- 23.Ke S, Wen X, Gurfinkel M, Charnsangavej C, Wallace S, Sevick-Muraca EM, Li C. Near-infrared optical imaging of epidermal growth factor receptor in breast cancer xenografts. Cancer Res. 2003;63:7870–7875. [PubMed] [Google Scholar]
- 24.Gottschalk S, Edwards OL, Sili U, Huls MH, Goltsova T, Davis AR, Heslop HE, Rooney CM. Generating CTLs against the subdominant Epstein–Barr virus LMP1 antigen for the adoptive immunotherapy of EBV-associated malignancies. Blood. 2003;101:1905–1912. doi: 10.1182/blood-2002-05-1514. [DOI] [PubMed] [Google Scholar]
- 25.Kwon S, Ke S, Houston JP, Wang W, Wu Q, Li C, Sevick-Muraca EM. Imaging dose-dependent pharmacokinetics of an RGD-fluorescent dye conjugate targeted to αvB3 receptor expressed in Kaposi's sarcoma. Mol Imaging. 2005;4:75–87. doi: 10.1162/15353500200505103. [DOI] [PubMed] [Google Scholar]
- 26.Adams KE, Ke S, Kwon S, Liang F, Fan Z, Lu Y, Hirschi K, Mawad ME, Barry MA, Sevick-Muraca EM. Comparison of visible and near-infrared wavelength-excitable fluorescent dyes for molecular imaging of cancer. J Biomed Opt. 2007;12:024017. doi: 10.1117/1.2717137. [DOI] [PubMed] [Google Scholar]
- 27.Leen AM, Sili U, Savoldo B, Jewell AM, Piedra PA, Brenner MK, Rooney CM. Fiber-modified adenoviruses generate subgroup cross-reactive, adenovirus-specific cytotoxic T lymphocytes for therapeutic applications. Blood. 2003;103:1011–1019. doi: 10.1182/blood-2003-07-2449. [DOI] [PubMed] [Google Scholar]
- 28.Hess C, Means TK, Autissier P, Woodberry T, Altfeld M, Addo MM, Frahm N, Brander C, Walker BD, Luster AD. IL-8 responsiveness defines a subset of CD8 T cells poised to kill. Blood. 2004;104:3463–3471. doi: 10.1182/blood-2004-03-1067. 123. [DOI] [PubMed] [Google Scholar]