

Abstract
A new sample processing workflow that uses high intensity focused ultrasound to rapidly reduce and alkylate cysteines, digest proteins and then label peptides with 18O was developed for quantitative proteomics applications. Each step was individually refined to minimize reaction times, peptide loses and undesired by-products or modifications. By using this novel workflow, mouse plasma proteins were successfully denatured, alkylated, in-solution digested, and 18O labelled in < 10 min for subsequent analysis by liquid chromatography-electrospray ionization high resolution mass spectrometry. Performance was evaluated in terms of the number of mouse plasma peptides and proteins identified in a shotgun approach and the quantitative dynamic range. The results were compared with previously published results obtained using conventional sample preparation methods and were found to be similar. Advantages of the new method include greatly simplified and accelerated sample processing, as well as being readily amenable to automation.
Introduction
Spurred by scientific advances, mass spectrometry (MS)-based proteomics has become a key technology utilized in systems biology studies for studying protein changes within an organism under contrasting conditions. A typical differential expression proteomics workflow involves a step in which liberated proteins of interest are denatured using either chaotropic chemicals (e.g., urea or guanidine HCl) or mass spectrometer compatible surfactants, and the disulfide bonds and free cysteine residues are reduced and alkylated. Following digestion with a protease (usually trypsin), relative quantitation is achieved by isotopically labeling (e.g., 18O labeling) one sample followed by an equal addition of an unlabeled control for analysis by liquid chromatography (LC)-MS. This workflow from tissue/cell/body fluid to mass spectrometric data accumulation typically requires several days. As a result, a number of workflow optimization studies1-3 have focused on improving and accelerating proteolytic digestions which in turn would increase throughput.
In order to accelerate enzymatic reaction rates, only a few parameters, e.g. temperature and pressure, hold the greatest potential for significantly enhancing protease activity4. For example, the use of microwave radiation to increase temperature has allowed tryptic or acid digestions to occur in < 5 min5. Additionally, the application of high intensity focused ultrasound (HIFU) to increase pressure and perhaps mass transfer has resulted in much faster protein digestion for both in-gel and in-solution digestions 6. Santos et al. also reported the use of different ultrasonic devices that enhanced performance of a single protein by in-solution digestion7.
In the study reported herein, we applied HIFU in a new proteomics workflow that not only enhances the rate of protein digestion, but also can be used to denature, alkylate, and isotopically label resultant peptides in minutes. HIFU sonication time and amplitude were optimised to minimize overall sample preparation time, while at the same time preventing undesirable by-products. The workflow was demonstrated using mouse plasma proteins, and method performance was evaluated in terms of the number of peptides and proteins identified in a shotgun approach, as well as the quantitative dynamic range.
Methods
Materials and reagents
Sequencing grade trypsin was obtained from Promega (Madison,WI), Tris[2-carboxyethyl]phosphine (TCEP) and BCA protein assay was purchased from Pierce (Rockford IL, USA). Nα-Benzoyl-L-arginine 4-nitroanilide hydrochloride (LBAPNA), bovine serum albumin (BSA), urea, iodoacetamide (IAA), ammonium bicarbonate, formic acid, 18O water, mouse plasma, and HPLC grade solvents were purchased from Sigma-Aldrich (St. Louis, MO).
Assay of enzymatic activity and residual activity
The enzymatic activity of trypsin under an ultrasonic field was measured by hydrolyzing L-BAPNA in 25 mM ammonium bicarbonate buffer (pH 8.2). In detail, a 20 μg trypsin vial was transferred to a 2 mL reaction tube of 25 mM ammonium bicarbonate buffer (pH 8.2) and 20 μl of L-BAPNA (10 mg/ml in DMF) and placed on ice. To initiate the enzymatic reaction, 200 μL of the solution was transferred to a 600 μL centrifuge tube and sonicated using a Sonicator 3000 instrument and 3.2 mm Microtip (Mixonix, Farmingdale, NY, USA) at 1.5%, 2%, and 2.5% of the maximum operating frequency of 20 KHz and output power of 600 Watts. Aliquots taken after sonication were acidified and stored on ice. Each aliquot was analyzed (at room temperature) by measuring the absorbance at 405 nm with a UV/vis spectrophotometer, and the activity was calculated from the absorbance over time.
In-solution digestion
BSA was used for evaluating the method under different conditions. First, two equal aliquots of 200 μg of BSA were denatured in 8 M urea and then reduced and alkylated simultaneously with 5 mM TCEP and 50 mM iodoacetamide in 25 mM ammonium bicarbonate (pH 8.25) for either 3 or 5 min under ultrasonic irradiation. 20 μg aliquots from the reduced and alkylated samples were diluted 10-fold with 25 mM ammonium bicarbonate to decrease the urea, TCEP, and IAA concentration. Trypsin was added (1:50 protease-to-protein ratio) to a final volume of 200 μL, and the solutions were sonicated for 1, 2 or 3 min at 2% of the maximum ultrasound amplitude. Finally, the enzymatic digests were transferred to new centrifuge tubes, acidified, and frozen with liquid N2 to stop the reaction. The samples were then dried by centrifugal evaporation and stored at -20 °C.
To evaluate digestion consistency, a mixture of four standard proteins - Ribonuclease A, gliceraldehyde-3-phosphate-dehydrogenase, myoglobin and bovine serum albumin - was subsequently digested. Five aliquots containing 10 μg of each protein were processed as described above.
Mouse plasma, representative of proteomic sample complexity, was diluted 5-fold using 8 M urea in 25 mM ammonium bicarbonate. A 200μL aliquot of the mixture (total protein content of 800 μg) was reduced and alkylated in 3 min, as described above. The sample was diluted 4-fold using 25 mM ammonium bicarbonate, digested with trypsin in a 1:50 (w/w) trypsin-to-protein ratio, and sonicated for 1 min under the same conditions specified above. Formic acid was added until the solution was acidic (pH < 3) to stop the reaction (as an additional precaution) and to eliminate ammonium bicarbonate. The samples were frozen in liquid nitrogen and dried by centrifugal evaporation.
Post-digestion 18O labeling
Samples were prepared as previously described8 with minor modifications. Briefly, dried peptides were cleaned by loading them onto a methanol-activated 1-mL SPE C18 Discovery solid phase extraction (SPE) column (Supelco, Bellefonte, PA). They were washed with 4 mL of 0.1% trifluoroacetic acid (TFA)/5% acetonitrile (ACN). Peptides were eluted from the SPE column with 1 mL of 0.1% TFA/80% ACN and then lyophilized. The resulting peptide samples were reconstituted in 25 mM ammonium bicarbonate, and the residual trypsin activity was quenched by boiling the samples for 10 min before snap-freezing them in liquid nitrogen. The total peptide concentration in each sample was again measured using a BCA protein assay. 100 μg of the desalted peptides were dried by centrifugal evaporation and re-dissolved in 400 mL of 100 mM ammonium acetate (pH 6.75) with 2 μg sequence grade trypsin, and the resulting mixture was split between two 0.6-ml centrifuge tubes. After drying again by vacuum centrifugation, the samples were dissolved in 200 μL of either H2 16O or H2 18O (95%, Sigma-Aldrich) and sonicated for 5 min. Labeling was stopped by adding formic acid to 1%.
MS analysis
Different LC-MS systems were used for various analyses. For standard protein analyses, either 500 fmol of BSA digest or 0.1 μg total protein from the protein mixture were analyzed by LC-MS/MS, using an Agilent HPLC-Chip system coupled to a MSD XCT Ultra ion trap (Agilent Technologies, Santa Clara, CA). An Agilent autosampler was used to load the samples at 4 °C. Separations were performed on the chip that contained a 40-nL enrichment column and a 43 mm × 75 μm analyticl column, both packed with 5 μm ZORBAX 300SB C18 particles. A flow rate of 1 μL/min was employed for loading and enriching the sample. Peptides were eluted at 600 nL/min by using either 1) a 5 min gradient from 5% to 90% Solvent B (0.5% formic acid, 90% acetonitrile; Solvent A: 0.5% formic acid in water:acetonitrile 97:3), with a separation window of ~2 min and total analysis time of 12 min or 2) a 55 min gradient from 5% to 90% Solvent B. A blank was run between each sample to eliminate the possibility of cross contamination among different samples.
An Agilent LC1100 system equipped with a nano-pump (Agilent Technologies, Santa Clara, CA) was used to evaluate plasma digestions and 18O labeling. Peptides were eluted using a 30-min linear gradient of 10% to 60% mobile phase B (as above for BSA). The LC system was coupled on-line with an LTQ-Orbitrap mass spectrometer. Data was collected in a data-dependent mode where the ten most abundant ions were selected for tandem MS in the ion trap after a full, high resolution FTMS survey scan. A dynamic exclusion time of 1 min and a normalized collision energy of 35% were used for the entire run.
For the extensive analysis of the mouse plasma proteome, 2 μg of the digested peptides were analyzed using a capillary LC system coupled online to a hybrid LTQ-Orbitrap mass spectrometer (Thermo-Fisher, San Jose, CA) with an in-house developed ESI source9. Reversed-phase capillary columns were prepared by slurry packing 5-μm Jupiter C18 bonded particles (Phenomenex, Torrence, CA) into a 150 μm × 65 cm fused silica capillary (Polymicro Technologies, Phoenix, AZ) that utilized a 2-μm stainless steel retaining screen within a stainless steel union (Valco Instruments Co., Houston, TX). The mobile phases consisted of 0.2% acetic acid and 0.05% TFA in water (A) and 0.1% TFA in 90% acetonitrile/10% water (B). A custom-built capillary high pressure LC system was used to evaluate the digestion. The system consisted of a vacuum degasser (Jones Chromatography Inc., Lakewood, CO) in which mobile phases were degassed online and two 10,000 psi syringe pumps (Teledyne ISCO, Lincoln, NE) that shared a single controller and were used to supply mobile phases to the system, i.e., one dedicated to mobile phase A and the other to mobile phase B. The HPLC system was equilibrated at 5,000 psi with 100% mobile phase A for initial starting conditions. After loading the peptides onto the column, mobile phase A was held constant at 100% A for 20 min. An exponential gradient elution was performed by increasing mobile phase B from 0 to 77% over 100 min, using a stainless steel mixing chamber, followed by column washing at ~100% B for 10 min.
Protein identification and validation
Mouse plasma digests were searched using SEQUEST10 against an IPI Mus musculus database downloaded from NCBI. Database search parameters included a dynamic modification for Met oxidation and for carbamidomethylation of Cys. Peptide identification statistics that included estimating random match probabilities and false discovery rates were performed using the two-variable Gaussian method11 with some modifications (see supplementary information). Briefly, random and positive match distributions for corrected SEQUEST XCorr and ΔCn scores were modeled to a normal Gaussian distribution resulting in a double normal distribution. The composite function for this distribution that was used to fit the experimental data was solved using the Microsoft Excel Solver. The p-values used to calculate the FDR were used in the same way as the reported method11.
Quantitative proteomic strategy
The LC-MS datasets were analyzed using VIPER software12. This software package uses detected LC-MS features and then aligns and matches these features to a previously established database of peptides generated from LC-MS/MS analyses. Identified LC-MS features can then be quantifed on the basis of isotopically labeled and nonlabeled peptide pairs. VIPER is publicly available at http://ncrr.pnl.gov/software/. Data processing, including feature and pair finding, was completed using Decon2LS that uses a version of the THRASH algorithm13 to detect features (and their monoisotopic masses) for each mass spectra, also publicly available from at http://ncrr.pnl.gov/software/.. The standard ratio for each pair was calculated as follows:
| (1) |
where I0, I2, I4 represent the raw intensities of the first, third, and fifth peak maxima (i.e., the monoisotopic peaks of the unlabeled, singly labeled, and double labeled species), respectively, and M0, M2, M4, the relative proportions of the first (monoisotopic), third, and fifth isotopic peaks, respectively, in the natural isotopic envelope.
The expression ratios were calculated using a previously reported14 algorithm, which was modified to correct for labeling efficiency f, defined as the proportion of incomplete labeled peptides in the labeled sample and calculated as follows:
| (2) |
where B1 and B2 represent the concentrations of labeled peptides with the incorporation of one and two 18O, atoms, respectively, and are calculated as follows:
| (3) |
| (4) |
Finally, the expression ratio obtained when labeling efficiency is considered can be stated as:
| (5) |
where Rcorrected,f represents the real ratio between the species, as demonstrated in prior work14.
Ratios from multiple observations were processed in a manner similar to those used in microarray analysis 15. A histogram for the standard errors for each ratio was constructed, fit to a gamma distribution and statistically analyzed. Those pairs with an unreasonably high error were considered outliers and were removed. The ratios were then analyzed by building a histogram of the log2 value of each expression ratio. The data were fitted by least-squares to a Gaussian curve to determine the mean and the standard deviation of the distribution. The ratios were then corrected by subtracting the average in order to center the distribution on zero. A standard two-tailed z-test was used to determine which expression ratios significantly deviated from the mean. By introducing a sample-dependent normalization, this method corrects for any systematic errors introduced during sample handling.
Results and Discussion
Currently, sample preparation is one of the most time consuming step in any proteomics work flow, which can primarily be attributed to very long chemical and enzymatic reaction times. Accelerating these reactions through catalysis or by altering the thermodynamics of the environment in which the reaction takes place is one way of accelerating most of the sample preparation steps. HIFU has been previously demonstrated to increase chemical reaction rates16. The ultrasonication process produces cavitation bubbles that when collapsed, yield very high localized pressures and high temperatures along with shear forces, jets, and shock waves that help mix the reaction components17. The local increase in temperature and pressure, in conjunction with the enhanced mixing, can speed the enzymatic/chemical reactions and effectively denature proteins. However, theses factors are beneficial only within a range of conditions, outside of which undesired by-products can be generated and significant sample losses can occur through chemical modifications and/or overheating/evaporation/nebulization.
Protein digestion using HIFU
The use of HIFU for protein digestion has been previously demonstrated6; however, results pertaining to the effect of different buffers, trypsin concentration, and sonication time on protein digestion were inconclusive. For example, HIFU-assisted digestion of a lysozyme gel band using different incubation times (10-120 s) provided practically identical protein sequence coverage and a signal-to-noise ratio for peptides analyzed using MALDI-TOF-MS to that obtained without HIFU. As a result, no conclusions could be drawn (other than HIFU greatly accelerates enzymatic digestions) with regard to the enzymatic kinetics and the optimum sonication time on the basis of number of peptides identified or protein coverage of either a target protein or mixture of proteins.
In this study, we used a straightforward method of measuring protease activity to determine the effect of HIFU on enzymatic activity and the minimum/useful reaction times. Meaningful enzymatic activities were calculated from the results obtained by the measurement of the absorbance at 405 nm of the tryptic substrate Nα-Benzoyl-L-arginine 4-nitroanilide hydrochloride (L-BAPNA) at room temperature. The activity was then calculated on the basis of absorbance over time. We studied the activity of 1 μg of trypsin under different reaction times and ultrasonic intensities using a common ultrasound micro probe and an excess of L-BAPNA as the tryptic substrate. First, we tested the maximum power that could be applied to 200 μL of protein solution, a common volume in proteomics applications. As sample volumes did not change during sonication at 1.2 - 3 Watts at the end of the ultrasonic probe (i.e., 1.5- 2.5% of the maximum power), solution losses due to nebulization and heat were assumed to be negligible.
Figure 1a shows that trypsin activity reaches a plateau after 30 s of ultrasonic exposure for all three ultrasound intensities. These results imply that either the reaction was essentially complete in < 1 min or that the trypsin was no longer active due to denaturation caused by HIFU. After addition of an excess of fresh trypsin following sonication an intense yellow color was observed in the solution. This observation indicates that ultrasonic irradiation inactivated the trypsin from the first addition; however, when fresh trypsin was added, any remaining undigested L-BAPNA continued to react. Note that when trypsin was used in the range of 1:50 to 1:20 enzyme:substrate, full conversion of the proteins to peptides was observed in 1 min, since we modified the kinetics and not the total enzyme activity.
Figure 1.

a) Comparison of the relative absorbance at 405 nm due to the hydrolysis of LBAPNA by trypsin at different ultrasonic powers: 1.5%, 2% and 2.5%. Triangles correspond to 1.5% intensity, squares to 2%, and circles to 2.5%. Two technical replicates were performed for each time point. b) Chromatogram corresponding to the LC-MS/MS of BSA digests applying the HIFU protocol using a 3 min reduction and alkylation with 5 mM TCEP and 40 mM IAA, followed by a 1 min digestion. c) Amino acid sequence coverage for BSA. Capital letters correspond to the identified sequence. Red letters correspond to the identified cysteine-containing peptides.
Protein denaturation using HIFU
While a traditional proteomic sample preparation workflow could benefit from the application of HIFU, its application could also induce undesired changes to the sample. For example, in-solution digestion and denaturation protocols make use of chaotropes, some of which can covalently modify proteins, as is the case with urea. Urea in the presence of high heat will accelerate urea hydrolysis and produce isocyanate, which in turn will carbamylate proteins at the N-termini and lysine sidechains18. Smejkal19 and coworkers recently performed an experiment where an ice bath was used in conjunction with ultrasound and the presence of high concentrations of urea and thiourea (at 7 M and 2 M respectively) during cell lysis to reduce the reaction temperature and limit carbamylation. Despite this step, a high turbidity was observed in the treated solution resulting from precipitated protein and aggregates formed from urea. In another recent study7, different ultrasonic devices where evaluated in terms of protein reduction, alkylation, and subsequent digestion. Although several high intensity peaks were unidentified in the MALDI-TOF MS spectra, the authors did not determine carbamylation at the N-termini and lysine side chains of peptides, and did not optimize their conditions. However, the study using DTT and IAA suggested 10 min as a maximum reaction time for the ultrasonic device used in this study.
Our strategy for HIFU was to apply the minimum irradiation necessary to completely reduce, alkylate, and digest the sample protein, while also minimizing carbamylation of lysines. To evaluate for protein modification we examined BSA for carbamylated lysines after sonicating for 3 min and only found two modified peptides. A similar result was observed after a standard overnight digestion at 37 °C (data not shown). This modification can be completely minimized by using other chaotropes such as guanidine hydrochloride instead of urea. However, in our experience, little carbamylation will be observed if the urea is freshly prepared and the ultrasonic power does not heat the solution above 60 °C.
Figure 1b shows the resultant peptide total ion chromatogram and peptide coverage of 82% for a BSA sample that had been reduced and alkylated with 5 mM TCEP and 40 mM IAA in 8 M urea using HIFU for 3 min for the reduction and alkylation step followed by a 1 min digestion, also using HIFU. Since TCEP is a non-thiol-containing reducing agent, it can be used simultaneously with IAA with little cross-reactivity. All cysteine-containing peptides were identified with modified cysteines, as shown in Figure 1c. If a digestion was incomplete, undigested or partially digested protein was observed at the end of the gradient under the chromatographic conditions used for all analyses (supplementary information). Remarkably, no residual protein was detected for any of our HIFU facilitated digestions, indicating efficient conversion of the protein into peptides was a complete process. HIFU-enhanced reduction and alkylation at 3 and 5 min yielded similar results, as characterized by the observed peptide coverage of BSA (Figure 2a). These data show that the digestion of a proteomic sample can be decreased from 2-6 hours to 1-3 min without significant negative side effects.
Figure 2.

a) Histogram showing the number of identified peptides and protein comparing 3 versus 5 min reduction and alkylation times and 1, 2 and 3 min digestion times using ultrasound irradiation. b-c) Histograms showing the protein coverage (b) and number of unique peptides (c) for 4 different proteins during five technical replicates after 3 min reduction and alkylation time and 1 min digestion time using ultrasound irradiation.
We also explored the reproducibility of the process, using four standard proteins. The percentage of protein coverage and number of unique peptides are shown in histograms in Figure 2b-c. In all cases, protein coverage was high and no significant differences were observed among the replicates. Differences <15% among replicates are more likely caused by varability in LC-MS analysis than by inconstant sample preparation. This assumption is reinforced by the fact that if we consider the total unique peptide identifications for each replicate (see supplementary information), the differences among them are similar to what is observed in Figure 2b-c. Overall, the HIFU-assisted digestion yielded 10% more identifications compared to a control overnight digestion. No technical replicates were preformed for the control digest.
Application of HIFU for the in-solution digestion of a global plasma proteome
Mouse plasma was chosen as a model system because it represents a complex and challenging protein mixture with a large range of protein abundances. Using HIFU technology, 800 μg of mouse plasma was reduced and alkylated in 3 min and digested in 1 min, prior to LC-MS/MS analysis. Initially, the plasma digestion was evaluated against the established protocol in our facility for mammalian samples, which is based in an overnight digestion at 37 °C20. The modified Gaussian method11 of the MS/MS results was used to discriminate between random and positive matches, as shown in Figure 3. A comparison between the standard and HIFU-treated digestions yielded 20% more peptide identifications for the HIFU treated sample, which was also consistent with the number of protein identifications. This difference is not necessary reflective of a better digestion procedure but could be due to an expected variability with LC-MS/MS experiments. However, the overlap between identified peptides and proteins across the samples was ca. 76%, which is in good agreement with the normal variability observed in shotgun LC-MS/MS proteomics experiments (see supplementary figures). Furthermore, a more exhaustive analysis using a fully automated 4-column LC system21 yielded more than 700 unique peptides (corresponding to more than 230 proteins) identified with <1% FDR (Figure 4b). These numbers were comparable with previous published datasets22. Non-tryptic and semi-tryptic peptides accounted for ~20% of the matched plasma proteome (Figure 4d), which is similar to percentages reported for other conventional shotgun proteomics protocols,20 which implies that the ultrasound-facilitated, rapid digestions did not affect trypsin specificity23, 24. These observations show that our new sample treatment has a performance similar to both our conventional in-solution digestion protocol as well as other published studies.
Figure 3.

Average score distributions obtained by SEQUEST searching against an IPI Mus musculus FASTA database for charge states +2 (left panels) and +3 (right panels). a) 2-D scatter plots of corrected scores, XCc and DCc. Distribution of corrected SEQUEST scores obtained (b) XCc. (c) DCc.
Figure 4.
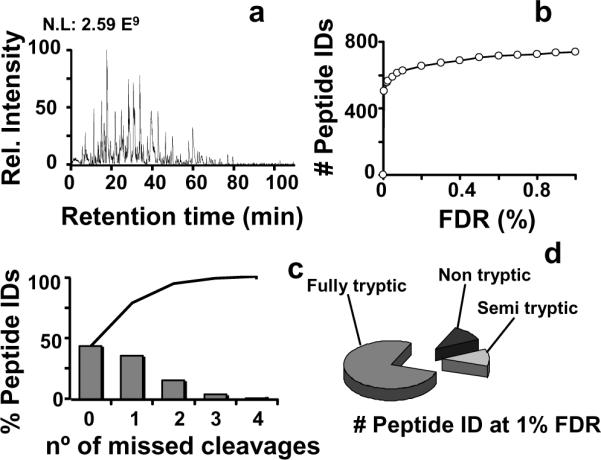
Summary of the results obtained following HIFU assisted protocol. a) Shows a chromatogram obtained from the LC-MS/MS analysis. b) Shows the number of identified peptides at a given FDR following SEQUEST analysis. c) Histogram showing the number of identified peptides with missed cleavages at 1% FDR. The line shows the cumulative frequency of the identified peptides. d) Comparison of the different identified peptides in terms of trypsin specificity.
Since non-depleted mouse plasma was used for the analysis, we observed wide protein coverage for highly abundant plasma proteins such as serum albumin. We identified 69 different serum album peptides that covered 74% of the protein sequence. Other abundant proteins, such as apolipoprotein I involved in lipid transport and complement C3 were identified with 14 and 28 peptides, respectively. Lower abundance proteins such as fibroblast factor receptor, a plasma membrane protein from the kinase family, were only identified through one high confidence semi-tryptic peptide. These trends in coverage are similar in other global proteomic analyses of plasma22. Therefore, results from the present study suggest that the use of ultrasounds as an accelerator of proteolytic digestion offers an equivalent, in terms of coverage, but faster alternative to standard protocols for digesting plasma.
18O labeling efficiency using HIFU and application of a correction model to calculate labeling efficiency
Post-digestion labeling using 18O-enriched water is a simple, enzymaticallycatalyzed reaction where all peptides with a tryptic carboxy terminus can be labeled with two 18Oatoms25. One of the main concerns in any 18O-labeling experiment is the back exchange of 16O from water by still-active trypsin, which effectively reverses 18O-labeling. The most common way of avoiding this issue is to render trypsin inactive by denaturing the enzyme, either by boiling, reducing the pH or adding protease inhibitors26, 27. Based on our HIFU assisted tryptic digestion kinetic data, an irradiation time of 1 min is an effective method for inactivating the enzyme. The kinetic behavior of the hydrolysis and oxygen exchange reaction can be assumed to be the same28 and irradiation times in excess of 1 min will deactivate trypsin, i.e., stopping the reaction. Increasing the ultrasonic irradiation time or intensity is expected to intensify this effect. This assumption is supported by the findings of Tian et al.29 who observed that trypsin activity decreases during ultrasonication.
Data analysis is the most difficult aspect of determining protein abundance changes in 18O differential expression analysis. Our method calculates peptide ratio errors by evaluating the variation in the ratio across the chromatographic peak. The power of this approach lies in the capacity to remove mistakes usually caused by chemical noise during peak picking. The assumption is that individual scans for the same peptide pair can be viewed as experimental replicates. In other words, if the features are a true pair, then the ratio will not change across the chromatographic peak and the error in measurement will be small, as shown in Figure 5a and 5b. This analysis in combination with the labeling efficiency correction improves the precision of results.
Figure 5.

Results obtained in a negative control experiment using HIFU for post-digestion labeling. Panel a) shows a plot of the standard error of the log2(16O/18O) obtained for each pair through multiple observations versus the log2(16O/18O). Panel b) shows the histogram for the standard errors fitted to a gamma distribution in order to remove outliers. Panel c) a plot of labeling efficiency versus log2(16O/18O), and the result obtained by fitting the histogram of the log2(16O/18O) ratios with the corrected method to a Gaussian function. In d) a histogram shows the labeling efficiency distribution obtained for the quantified peptides. Panel e) shows representative MS spectra for three peptides from the experiment: e.1) ARPALEDLR, e.2) YTQKAPQVSTPTLVEAAR, e.3) TNC*DLYEKLGEYGFQNAILVR. Below each is the corresponding single ion chromatogram for both labeled and unlabeled species. Empty circles correspond to the labeled species and filled circles to the unlabeled species.
The labeling efficiency observed for HIFU-assisted labeling was similar to previous work;14, 20 thus, we were able to apply a universal kinetic model to predict the exact point at which the labeling reaction ended for each peptide. This procedure allowed us to calculate the labeling efficiency for each peptide and to correct for the ratios of labeled and unlabeled peptides. Figure 5c shows a scatter plot of labeling efficiency and the log2(ratio16O/18O) obtained for the 1:1 mixture of unlabeled and labeled plasma, following a 5 min ultrasonic irradiation. Note the tight distribution of ratios, which demonstrates that both experiments had the same amount of each peptide and implies sample losses (if they occurred) were the same for all samples. The experiment also demonstrated that the application of HIFU to 18O labeling allowed for effective quantitative analysis of peptides, i.e., no differentially expressed peptides were identified.
The incorporation of ultrasonic irradiation into a proteomic workflow greatly decreased the time needed to process samples and simplified the overall process as shown in Figure 6. HIFU decreased sample preparation time ~250 fold from 2280 min8 to 9 min. As a result, digestion and isotopic labeling, which were once bottleneck steps in quantitative proteomics, were accomplished in just a few minutes.
Figure 6.

Comparison between the traditional and the newly developed sample preparation protocol based on HIFU. Sample processing with the HIFU method takes ~250 fold less time that the traditional protocol.
Conclusions
The results obtained with the optimized workflow incorporating HIFU-enhanced digestion and labeling are comparable to those obtained using traditional, more time consuming proteomics workflows, indicating that data quality is not compromised by going faster. By using trypsin activity measurements, the maximum time needed to effectively complete each individual reaction could be determined. Isotopic labeling showed the greatest gains with the use of ultrasound. With the incorporation of a labeling efficiency coefficient in the isotopic labeling quantitation algorithm, the validity of the data set could be determined, the data corrected, and outliers confidently removed, as demonstrated with a whole mouse plasma digest. Automation may provide significant improvement in the overall protein analysis throughput for biological applications involving large numbers of samples, such as for clinical studies of biomarker discovery.
Supplementary Material
Acknowledgements
The authors thank Brianne Ogata, Priscilla A. Moore, and Penny Colton for their helpful assistance and suggestions. Portions of this work were supported by the NIH National Center for Research Resources (RR018522), NIH National Cancer Institute (R21 CA12619-01), and the Pacific Northwest National Laboratory's (PNNL) Laboratory Directed Research and Development Program. PNNL is operated for the U.S. Department of Energy by Battelle under contract DE-AC05-76RLO1830.
Abbreviations
- 1D
One Dimensional
- 2D
Two Dimensional
- ACN
Acetonitrile
- BSA
Bovine Serum Albumin
- DMF
Dimethylformamide
- ESI
Electrospray
- FDR
False Discovery Rate
- FTMS
Fourier Transform Mass Spectroscopy
- HIFU
High Intensity Focused Ultrasound
- HPLC
High Performance Liquid Chromatography
- IAA
Iodoacetamide
- IT
Ion trap
- L-BAPNA
Nα-Benzoyl-L-arginene 4 nitroanilide hydrochloride
- LC
Liquid Chromatography
- MAPED
Microwave-assisted Protein Enzymatic Digestion
- MeOH
Methanol
- MS
Mass Spectrometry
- MS/MS
Tandem Mass Spectrometry
- MW
Molecular Weight
- RP
Reversed Phase
- SPE
Solid Phase Extraction
- TCEP
Tris[2-carboxyethyl]phosphine
- TFA
Trifluoroacetic Acid
- TOF-MS
Time of Flight Mass Spectrometry
References
- 1.Blonder J, Chan KC, Issaq HJ, Veenstra TD. Identification of membrane proteins from mammalian cell/tissue using methanol-facilitated solubilization and tryptic digestion coupled with 2D-LC-MS/MS. Nat. Protoc. 2006;1(6):2784–90. doi: 10.1038/nprot.2006.359. [DOI] [PubMed] [Google Scholar]
- 2.Russell WK, Park ZY, Russell DH. Proteolysis in mixed organic-aqueous solvent Systems: applications for peptide mass mapping using mass spectrometry. Anal. Chem. 2001;73(11):2682–2685. doi: 10.1021/ac001332p. [DOI] [PubMed] [Google Scholar]
- 3.Hervey WJ, Strader MB, Hurst GB. Comparison of digestion protocols for microgram quantities of enriched protein samples. J. Proteome Research. 2007;6(8):3054–3061. doi: 10.1021/pr070159b. [DOI] [PubMed] [Google Scholar]
- 4.Adams MW, Kelly RM. Biocatalysis at Extreme Temperatures; Enzyme Systems Near and Above 100 °C. 1991:86–107. [Google Scholar]
- 5.Sun W, Gao S, Wang L, Chen Y, Wu S, Wang X, Zheng D, Gao Y. Microwave-assisted protein preparation and enzymatic digestion in proteomics. Mol. Cell. Proteomics. 2006;5(4):769–76. doi: 10.1074/mcp.T500022-MCP200. [DOI] [PubMed] [Google Scholar]
- 6.Lopez-Ferrer D, Capelo JL, Vazquez J. Ultra fast trypsin digestion of proteins by high intensity focused ultrasound. J. Proteome Research. 2005;4(5):1569–74. doi: 10.1021/pr050112v. [DOI] [PubMed] [Google Scholar]
- 7.Santos HM, Rial-Otero R, Fernandes L, Vale G, Rivas MG, Moura I, Capelo JL. Improving sample treatment for in-solution protein identification by peptide mass fingerprint using matrix-assisted laser desorption/ionization time-of-flight mass spectrometry. J. Proteome Research. 2007;6(9):3393–9. doi: 10.1021/pr0702518. [DOI] [PubMed] [Google Scholar]
- 8.Lopez-Ferrer D, Ramos-Fernandez A, Martinez-Bartolome S, Garcia-Ruiz P, Vazquez J. Quantitative proteomics using 16O/18O labeling and linear ion trap mass spectrometry. Proteomics. 2006;6(Suppl 1):S4–S11. doi: 10.1002/pmic.200500375. [DOI] [PubMed] [Google Scholar]
- 9.Shen Y, Zhao R, Belov ME, Conrads TP, Anderson GA, Tang K, Pasa-Tolic L, Veenstra TD, Lipton MS, Smith RD. Packed capillary reversed-phase liquid chromatography with high-performance electrospray ionization fourier transform ion cyclotron resonance mass spectrometry for proteomics. Anal. Chem. 2001;73(8):1766–1775. doi: 10.1021/ac0011336. [DOI] [PubMed] [Google Scholar]
- 10.Eng JK, McCormack AL, Yates JR. An Approach to Correlate Tandem Mass Spectral data of peptides with amino acid sequences in a protein patabase. J. Am. Soc. Mass Spectrom. 1994;5(11):976–989. doi: 10.1016/1044-0305(94)80016-2. [DOI] [PubMed] [Google Scholar]
- 11.Lopez-Ferrer D, Martinez-Bartolome S, Villar M, Campillos M, Martin-Maroto F, Vazquez J. Statistical model for large-scale peptide identification in databases from tandem mass spectra using SEQUEST. Anal. Chem. 2004;76(23):6853–60. doi: 10.1021/ac049305c. [DOI] [PubMed] [Google Scholar]
- 12.Monroe ME, Tolic N, Jaitly N, Shaw JL, Adkins JN, Smith RD. VIPER: an advanced software package to support high-throughput LC-MS peptide identification. Bioinformatics. 2007;23(15):2021–3. doi: 10.1093/bioinformatics/btm281. [DOI] [PubMed] [Google Scholar]
- 13.Horn DM, Zubarev RA, McLafferty FW. Automated reduction and interpretation of high resolution electrospray mass spectra of large molecules. J. Am. Soc. Mass Spectrom. 2000;11(4):320–332. doi: 10.1016/s1044-0305(99)00157-9. [DOI] [PubMed] [Google Scholar]
- 14.Ramos-Fernandez A, Lopez-Ferrer D, Vazquez J. Improved method for differential expression proteomics using trypsin-catalyzed 18O labeling with a correction for labeling efficiency. Mol. Cell. Proteomics. 2007;6(7):1274–86. doi: 10.1074/mcp.T600029-MCP200. [DOI] [PubMed] [Google Scholar]
- 15.Draghici S. Statistical intelligence: effective analysis of high-density microarray data. Drug Discov. Today. 2002;7(11):S55–S63. doi: 10.1016/s1359-6446(02)02292-4. [DOI] [PubMed] [Google Scholar]
- 16.Mason TJ, Lormer JP. Sonochemistry, theory, applications and uses of ultrasound in chemistry. 1st ed. Ellis Horwood Limited; Chischesteer, England: 1988. p. 252. [Google Scholar]
- 17.Sehgal C, Sutherland RG, Verrall RE. Cavitation-induced oxidation of aerated aqueous Fe-2+ solutions in the presence of aliphatic-alcohols . of Phys.l Chem. 1980;84(22):2920–2922. [Google Scholar]
- 18.Stark GR, Stein WH, Moore S. Reactions of the Cyanate Present in Aqueous Urea with Amino Acids and Proteins. J. Biol. Chem. 1960;235(11):3177–3181. [Google Scholar]
- 19.Smejkal GB, Witzmann FA, Ringham H, Small D, Chase SF, Behnke J, Ting E. Sample preparation for two-dimensional gel electrophoresis using pressure cycling technology. Anal. Biochem. 2007;363(2):309–11. doi: 10.1016/j.ab.2007.01.033. [DOI] [PMC free article] [PubMed] [Google Scholar]
- 20.Qian WJ, Monroe ME, Liu T, Jacobs JM, Anderson GA, Shen Y, Moore RJ, Anderson DJ, Zhang R, Calvano SE, Lowry SF, Xiao W, Moldawer LL, Davis RW, Tompkins RG, Camp DG, II, Smith RD. Quantitative proteome analysis of human plasma following in vivo lipopolysaccharide administration using 16O/18O labeling and the accurate mass and time tag approach. Mol. Cell. Proteomics. 2005;4(5):700–709. doi: 10.1074/mcp.M500045-MCP200. [DOI] [PMC free article] [PubMed] [Google Scholar]
- 21.Livesay E, Keqi T, Beverley T, Buschbach M, Hopkins D, Lamarche B, Zhao R, Shen Y, Orton D, Moore R, Kelly R, Udseth H, Smith RD. Fully automated, four-column capillary LC-MS system for maximizing throughput in proteomic analyses. Anal. Chem. 2007;80(1):294–302. doi: 10.1021/ac701727r. [DOI] [PMC free article] [PubMed] [Google Scholar]
- 22.Valentine SJ, Plasencia MD, Liu X, Krishnan M, Naylor S, Udseth HR, Smith RD, Clemmer DE. Toward plasma proteome profiling with ion mobility-mass spectrometry. J. Proteome Research. 2006;5(11):2977–84. doi: 10.1021/pr060232i. [DOI] [PubMed] [Google Scholar]
- 23.Olsen JV, Ong SE, Mann M. Trypsin Cleaves Exclusively C-terminal to Arginine and Lysine Residues. Mol. Cell. Proteomics. 2004;3(6):608–614. doi: 10.1074/mcp.T400003-MCP200. [DOI] [PubMed] [Google Scholar]
- 24.Picotti P, Aebersold R, Domon B. The implications of proteolytic background for shotgun proteomics. Mol. Cell. Proteomics. 2007;6(9):1589–98. doi: 10.1074/mcp.M700029-MCP200. [DOI] [PubMed] [Google Scholar]
- 25.Yao XD, Freas A, Ramirez J, Demirev PA, Fenselau C. Proteolytic 18O Labeling for Comparative Proteomics: Model Studies with Two Serotypes of Adenovirus. Anal. Chem. 2001;73(13):2836–2842. doi: 10.1021/ac001404c. [DOI] [PubMed] [Google Scholar]
- 26.Staes A, Demol H, Van Damme J, Martens L, Vandekerckhove J, Gevaert K. Global differential non-gel proteomics by quantitative and stable labeling of tryptic peptides with oxygen-18. J. Proteome Research. 2004;3(4):786–91. doi: 10.1021/pr049956p. [DOI] [PubMed] [Google Scholar]
- 27.Patwardhan AJ, Strittmatter EF, Camp DG, 2nd, Smith RD, Pallavicini MG. Quantitative proteome analysis of breast cancer cell lines using 18O-labeling and an accurate mass and time tag strategy. Proteomics. 2006;6(9):2903–15. doi: 10.1002/pmic.200500582. [DOI] [PubMed] [Google Scholar]
- 28.Yao X, Afonso C, Fenselau C. Dissection of Proteolytic 18O Labeling: endoproteasecatalyzed 16O-to-18O exchange of truncated peptide substrates. J. Proteome Res. 2003;2(2):147–152. doi: 10.1021/pr025572s. [DOI] [PubMed] [Google Scholar]
- 29.Tian ZM, Wan MX, Wang SP, Kang JQ. Effects of ultrasound and additives on the function and structure of trypsin. Ultrason. Sonochem. 2004;11(6):399–404. doi: 10.1016/j.ultsonch.2003.09.004. [DOI] [PubMed] [Google Scholar]
Associated Data
This section collects any data citations, data availability statements, or supplementary materials included in this article.