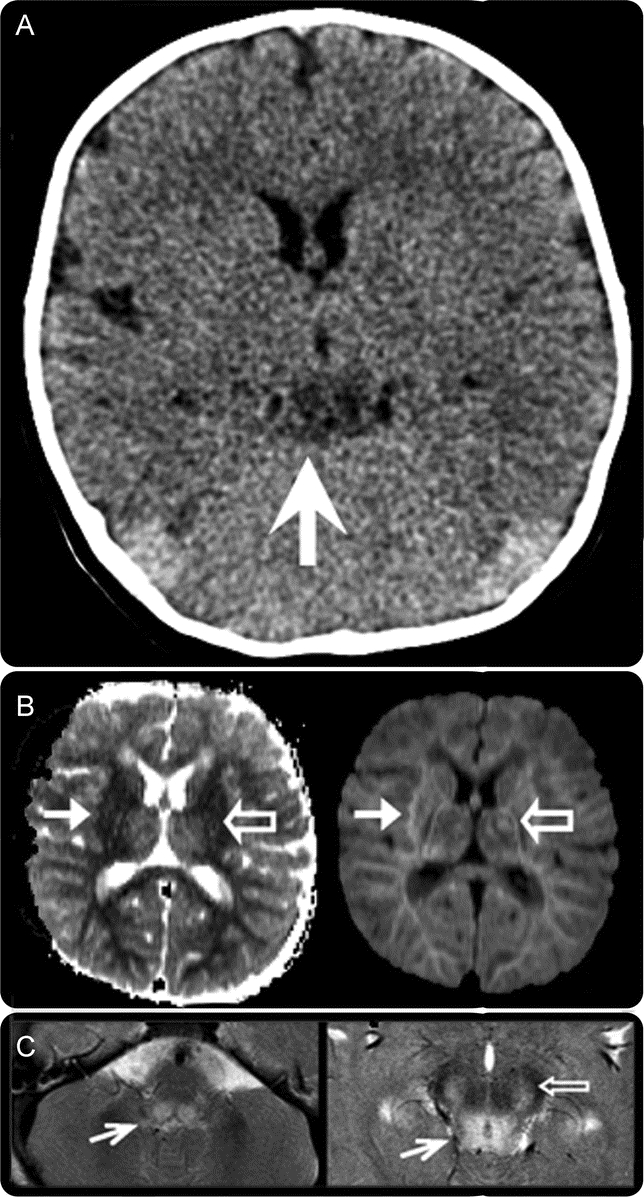
Figure Neuroimaging depicting lesions of different ages
Initial head CT showing hypodensities in the midbrain (white arrow, A). MRI of the brain showing an area of restricted diffusion in the left thalamus (open arrow, right panel, B) not correlating to the apparent diffusion coefficient map (open arrow, left panel, B), implying that this is an older lesion than the acute diffusion-restricting infarcts seen throughout the white matter (white arrows, B). Also seen are T2 hyperintensities in the dorsal midbrain (white arrow, left panel, C), periaqueductal grey matter (white arrow, right panel, C), and substantia nigra (open arrow, C).
