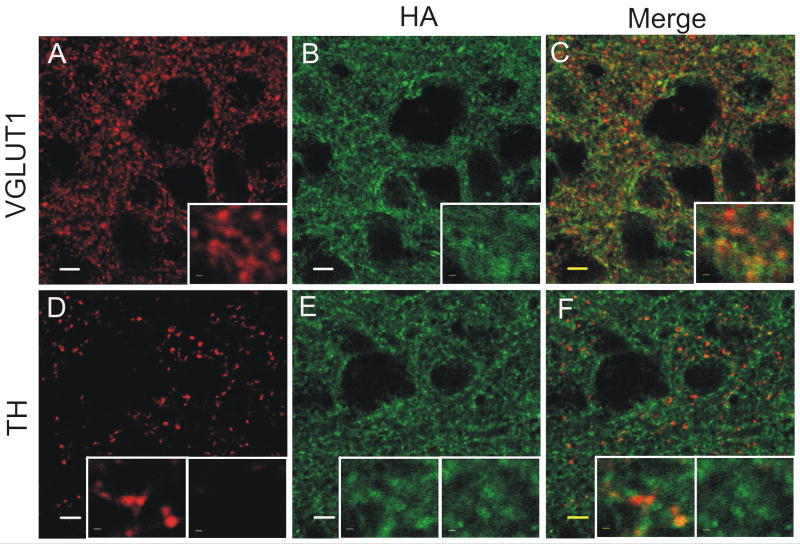
Figure 5.
α2A-AR distribution is in the BNST is broader than the distribution of tyrosine hydroxylase (TH), but is similar to the distribution of vesicular glutamate transporter 1 (VGLUT1). (A-F) High power image of coronal sections containing the dorsal lateral BNST, scale bars represent 5 μm. Inset scale bars are 0.5 μm. Inset boxes measure 6.9 μm (width) × 5.6 μM (height). A) VGLUT1 labeling in the dBNST. B) HA labeling in the dBNST. C) Merge of VGLUT1 and HA. D) TH labeling in the dBNST. E) HA labeling in the dBNST. F) Merge of TH and HA.

