

Abstract
Accumulation of specific deposits and extracellular molecules under the retinal pigment epithelium (RPE) have been previously observed in eyes with age-related macular degeneration (AMD) and may play a role in the pathogenesis of AMD. Even though age is the major determinant for developing AMD, clinical studies have revealed hypertension (HTN) as another systemic risk factor. Angiotensin II (Ang II) is considered the most important hormone associated with HTN. To evaluate the relationship of Ang II to AMD, we studied whether mouse RPE expresses functional Ang II receptor subtypes and whether HTN-induced Ang II regulates expression of these receptors as well as critical ECM molecules (MMP-2 and type IV collagen) involved in ECM turnover in RPE. We used 9 month-old C57BL/6 male mice infused with Ang II alone or Ang II in combination with the AT1 receptor antagonist candesartan or the AT2 receptor antagonist PD123319 for 4 weeks to determine whether HTN-associated Ang II was important for ECM regulation in RPE.
We found that mouse RPE expressed both Ang II receptor subtypes at the mRNA and protein levels. Infusion with Ang II induced HTN and elevated plasma and ocular Ang II levels. Ang II also regulated AT1a and AT1b receptor mRNA expression, the intracellular concentration of calcium [Ca2+]i, MMP-2 activity, and type IV collagen accumulation. Concurrent administration of Ang II with the AT1 receptor blocker prevented the increase in blood pressure and rise in ocular Ang II levels, as well as the calcium and MMP-2 responses. In contrast, the type IV collagen response to Ang II was prevented by blockade of AT2 receptors, but not AT1 receptors. Plasma Ang II levels were not modified by the AT1 or AT2 receptor blockade. Since the effects of Ang II on MMP-2 and type IV collagen require inhibition of both Ang II receptor subtypes, these receptors may play a role as a potential therapeutic targets to prevent ECM turnover dysregulation in the RPE basement membrane, suggesting a pathogenic mechanism to explain the link between HTN and AMD.
Keywords: hypertension, angiotensin II receptors, age-related macular degeneration, retinal pigment epithelium, calcium, matrix metalloproteinases, collagen type IV
1. Introduction
Age-related macular degeneration (AMD), one of the most common irreversible causes of severe vision loss in the elderly is characterized by progressive accumulation of extracellular matrix (ECM) deposits under the retinal pigment epithelium (RPE) (Berger et al., 1999; Green, 1999). Although age is the major determinant for developing AMD, some evidence shows that hypertension (HTN) is another risk factor (Hayreh et al., 1989; Hyman et al., 2000; Jonas et al., 2003; Klein et al., 2003). However, the mechanism(s) by which HTN may affect AMD remains unclear. Interestingly, different reports have revealed that Angiotensin II (Ang II), the final product of the renin-angiotensin system (RAS) and the most important hormone associated with HTN, may contribute to ECM turnover dysregulation (Eagleton et al., 2006; Huang et al., 2008; Wang et al., 2005).
All components of the RAS have been well described in the RPE (Berka et al., 1995; Kohler et al., 1997; Wagner et al., 1996; Wheeler-Schilling et al., 1999). Thus, it is important to elucidate the functions of this system, especially Ang II in the RPE and its potential relevance to AMD.
Ang II effects are mediated by the type 1 (AT1) a type 2 (AT2) Ang II cell surface receptors. In rodents, AT1 receptors can be subdivided into AT1a and AT1b subtypes (de Gasparo and Levens, 1994; Douglas and Hopfer, 1994). Ang II receptor expression has been confirmed in the retinal vasculature (Ferrari-Dileo et al., 1991; Sato et al., 1993), whole retina (Brandt et al., 1994; Wheeler-Schilling et al., 1999), and the RPE-choroid complex (Senanayake et al., 2007; Savaskan et al., 2004) of different species. In addition, we have previously identified AT1 and AT2 and their regulation by Ang II in human RPE (Marin-Castano et al., 2004). However, nothing is known about the expression of Ang II receptor subtypes and their regulation by Ang II levels associated with HTN in vivo.
The mechanisms of sub-RPE deposit formation are complex. However, the dysregulation of ECM molecules likely plays a key role. In this regard, Ang II, has been shown to have potent regulatory effects on collagen, matrix metalloproteinases (MMPs), and tissue inhibitors of metalloproteinases (TIMPs ) expression, molecules important for the ECM turnover in different organs (Castoldi et al., 2003; Corcoran et al., 1996; Eagleton et al., 2006; Huang et al., 2008; Wang et al., 2005). However, the regulatory effects of Ang II on ECM proteins expression in the RPE are unknown.
To test the hypothesis that HTN-associated Ang II leads to dysregulation of ECM expression in RPE, we used the Ang II-infused hypertensive mouse model and examined the expression of the Ang II receptor subtypes AT1 and AT2 and their regulation by Ang II. We studied the effects of Ang II on calcium signaling, MMP-2, TIMP-2, and type IV collagen regulation in RPE. We also used selective blockers experiments of AT1 and AT2 receptors to evaluate the involvement of these receptors in Ang II-induced responses.
2. Animals and experimental protocol
Mice used in this study were handled in accordance with the Association for Research in Vision and Ophthalmology guidelines for the use of animals in Ophthalmic and Vision Research. All experimental protocols were approved by the University of Miami Care and Use Committee.
Sixty-two adult C57BL/6 male mice (9 months old, National Institute of Aging, Bethesda, MD) were used in this study. The mice were fed a normal sodium diet (UAR A.40, 104 mmol of Na+ per kilogram). Food and water intake was monitored daily. Animals were anesthetized with 2% isoflurane in oxygen, and an osmotic minipump (Azet model 2001; Alza, Palo Alto, NC) was implanted subcutaneously between the scapulae. Mice were infused subcutaneously via osmotic minipumps for 4 weeks with; a) saline, b) Ang II (Sigma-Aldrich, St. Louis, MO) in saline, c) Ang II in combination with candesartan (10 mg/Kg/day) an AT1-receptor antagonist (kindly provided by Dr. Raij from the Veterans Administration Medical Center, Miami) administered in drinking water, and d) Ang II in combination with 50 mg/Kg/day of PD123319 (Sigma-Aldrich, St. Louis, MO) an AT2-receptor antagonist administered in drinking water. The infusion rate of Ang II was 3.0 μg/Kg/min. Blood pressure was recorded 3 days before treatment and 6 hours, 2 weeks, and 4 weeks after treatment using the tail-cuff plethysmography method. Animals were sacrificed 4 weeks after treatment. At the end of the experimental period, the eyes were immediately removed for recovery of RPE sheets or weighed and homogenized in an Ang II extraction buffer.
2.1. Blood pressure
Before the measurement of blood pressure, mice were acclimated to the restrainers for 1 hour/day for 5 days. On day 6, mice were placed in restrainers and rested for 10 to 15 minutes. An inflatable occlusion cuff was placed proximally on the tail and a sensor cuff was placed distally. Measurements were taken over a 1 hour period at 60-second intervals (Columbus Instruments, Columbus, OH). The systolic blood pressure was recorded as the mean of all stable measurements.
2.2. Measurements of plasma and whole eye Angiotensin II levels
Plasma and whole eye Ang II levels were measured by a sensitive Ang II enzyme immunoassay kit (Catalog no. A05880; Société de Pharmacologie et d’Immunologie-BIO, Montigny le Bretonneux, France). The immunoassay kit was used according to the manufacturer’s instructions. In brief, blood (800 μL) was removed by cardiac puncture and collected in chilled tubes containing a mixed inhibitor cocktail (5 mM EDTA, 10 μM pepstatin A/o-phenanthroline, 10 μM captopril, 10 mg/ml bestatin, and 1 mg/ml aprotinin) for measurement of plasma Ang II. For measurement of whole eye Ang II levels, six eyes from each group were pooled and the eye tissues weighed and homogenized in an Ang II extraction buffer containing 20 mM Tris base, 10 mM EDTA, 5 mM EGTA, 5 mM β-mercaptoethanol, 50 μg/ml phenylmethylsulfonyl fluoride, and 1 μg/ml aprotinin, as described previously (von Thun et al., 1994). Ang II was extracted in a phenyl-bonded solid-phase peptide extraction column (Bond Elut-C18; Varian), vacuum-dried overnight, and reconstituted in Ang II assay buffer before ELISA for Ang II (Li et al., 2006).
2.3. RPE isolation
RPE sheets were isolated as previously described (Cousins et al., 2003). Briefly, the eyes were enucleated, rinsed with 10% gentamicin for sterilization and twice with PBS (1X), and placed in a dish containing PBS (1X). Using a dissecting microscope, eyes were opened by a circumferential incision at the ora serrata. The anterior segment was removed, and the vitreous-retina was separated from the RPE and choroid eyecup with a round-tipped disposable blade (K20–1504; Katena Products, Inc., Denville, NJ) and Tennant forceps (K5–5230; Katena Products, Inc.). The remaining eyecup was incubated with dispase (Sigma-Aldrich, St. Louis, MO) in PBS (1X) at 37°C for 30 minutes. Then, using a Barraquer spatula (K3–2310; Katena Products, Inc.), the RPE monolayer was dissected from BrM and choroid. The RPE sheets were transferred into individual tubes (Eppendorf, Fremont, CA) and homogenized on ice with a pestle. Subsequently, total RNA and protein were extracted and stored at − 80°C.
Aliquots from the isolated RPE sheets were stained with mouse anti-cytokeratin-18 antibody (Santa Cruz Biotechnology, CA) as a positive control for epithelial cells and with mouse anti-endothelial cell (CD146) monoclonal antibody (Chemicon International, Inc., Temecula, CA) to ensure that there was no contamination with endothelial cells.
2.4. Angiotensin II receptor expression by reverse transcriptase-polymerase chain reaction (RT-PCR)
Total RNA was extracted with the RNeasy kit (Qiagen Inc, Valencia, CA). AT1, AT2, and GAPDH mRNA expression was analyzed by reverse transcription–polymerase chain reaction (RT-PCR) in microdissected RPE. Two μl of the cDNA solution was used as a template for PCR. PCR amplifications were performed in a total volume of 50 μl with 1.5 U Taq polymerase. AmpliTaq DNA polymerase (Perkin Elmer, Waltham, MA) was used as the thermostable enzyme. The PCR for Ang II receptor subtypes AT1a, AT1b, and AT2 was performed using specific primer pairs previously described by Burson et al. (1994) and carried out with the following profile: 1min at 94°C for 1 cycle; 1min at 55°C and 2 min at 72°C for 35 cycles; 5 min at 72°C for 1 cycle; incubation at 4°C for 5 min for AT1a and b receptors and 30s at 94°C for 1 cycle; 45s at 50°C and 45s at 72°C for 40 cycles; 5 min at 72°C for AT2 receptor. PCR without the RT step was included in all experiments. To ensure that similar amounts of cDNA were used for PCR, samples were assessed for expression of glyceraldehyde-3-phosphate dehydrogenase (GAPDH) as a standard housekeeping gene. For amplification of GAPDH, samples were denatured for 30 seconds at 94°C, then PCR was performed for 28 cycles (45 seconds at 94°C, 30 seconds at 55°C, and 45 seconds at 72°C) followed by 7 minutes at 72°C. Primer sequences and size of the PCR product for each gene are described in Table I. PCR products were separated on 2% agarose gels containing 0.05% ethidium bromide. Bands were scanned and quantitated by densitometry using ImageJ 1.17 software (National Institutes of Health, Bethesda, MD). The intensities of PCR bands are expressed as relative intensities to GAPDH.
Table 1.
Sequences corresponding to RT-PCR primers for Angiotensin II receptors AT1a, AT1b, and AT2, and GAPDH.
| Target Gene | Forward Primer | Reverse Primer | Size (bp) |
|---|---|---|---|
| AT1a | GCATCATCTTTGTGGTGGG | GAAGAAAAGCACAATCGCC | 523 |
| AT1b | ATGCTCAGTGGTCTGCTGG | ATGAGCACATCCAGAAAAC | 457 |
| AT2 | ATGCTCAGTGGTCTGCTGG | AACACAGCTGTTGGTGAATCC | 328 |
| GAPDH | GAGGGGCCATCCACAGTCTTC | CATCACCATCTTCCAGGAGCG | 357 |
AT1a: type 1 Angiotensin II receptor (subtype a), AT1b: type 1 Angiotensin II receptor, (subtype b), AT2: type 2 Angiotensin II receptor
2.5. Western blot
Protein expression of AT1 and AT2, MMP-2, and TIMP-2 was determined by Western blot. Isolated RPE sheets were homogenized with a pestle in lysis buffer, and then centrifuged 30 minutes at 15,000g at 4°C. Supernatant was collected and protein concentration determined by BCA method (Bio-Rad, Hercules, CA). Twenty μg of proteins were denatured with SDS sample buffer, boiled 5 min, and separated by 10–12% polyacrylamide gel (Novex, San Diego, CA). Following electrophoresis the proteins were transferred in 1X transfer buffer (25 mM Tris, 192 mM glycine, 0.1% SDS, 20% methanol, pH ~8.4) to a 0.45 microns Immobilon-P polyvinil difluoride membrane (Millipore Corp, Temecula, CA) in a mini-PROTEAN II transfer cell (Bio-Rad Laboratories, Inc. Hercules, CA) set at a constant voltage of 120 mV for 2 hours. Membranes were blocked in a 5% nonfat dry milk TBS solution for at least 1 hour at room temperature. Blots were incubated overnight at 4°C with one of the following antibodies: AT1 (N-10), AT2 (H-143) (Santa Cruz Biotechnology, Santa Cruz, CA), MMP-2 (MAB 13405; Chemicon International, Temecula, CA), TIMP-2 (AB8107; Chemicon International, Temecula, CA) or mouse monoclonal α-actin (Santa Cruz Biotechnology, Santa Cruz, CA). Membranes were washed three times with TBS-T, incubated with horse-radish peroxidase-linked donkey anti-rabbit, donkey anti-goat, or donkey anti-mouse antibodies for 2 hours at room temperature, and then washed four times with TBS-T. Immunoreactive bands were determined by exposing the membrane blots to a chemiluminescent solution and exposing to X-Omat AR film (Eastman Kodak Co., Rochester, NY).
2.6. Measurement of intracellular Ca2+ mobilization
The intracellular calcium ([Ca2+]i) mobilization measurement was performed as described previously (Marin-Castano et al., 1998). In brief, the microdissected RPE monolayer segments were individually transferred onto a thin glass microscope coverslip in 1 ml of solution-1 containing 1% agarose at 37°C. Then the agarose was jellied by cooling the coverslip for one minute on ice. The samples embedded in agarose were loaded with 5 μM fura-2 acetylmethoxy ester (fura-2/AM, Molecular Probe, Eugene, OR) at room temperature for one hour. For fluorescence measurements, each sample was placed on the stage of an inverted microscope and was continuously perfused at a rate of 0.6 ml/min at 37°C with HEPES buffer (10 mM HEPES, 145 mM NaCl, 2.5 mM KH2PO4, 1 mM CaCl2, 1 mM MgSO4, 10 mM glucose, pH 7.4, containing 0.1%BSA). Fura-2 was alternatively excited at 340 and 380 nm using a 75W xenon light source, filters, and a chopper (PTI Photoscan II System, Kontron). The illumination path included a 40x objective (Nikon) and an ultraviolet dichroic mirror. Emitted signals passed through a 480±20 nm bandpass filter before detection by a photomultiplier and were recorded every 2 seconds. The fluorescence intensities (S at 340 nm and L at 380 nm) were recorded from about 15% of the total RPE segment area and controlled by an adjustable window diaphragm. Correction for autofluorescence was performed and [Ca2+]i was calculated using the equation of Grynkiewicz et al. (1985). [Ca2+]i = Kd [(R – Rmin)/(Rmax – R)] (Lmax/Lmin) where Kd (= 224 nM) is the dissociation constant of fura-2 for calcium, r = S/L, Rmin and Rmax are values of R at 0 and saturating calcium concentrations, respectively, and Lmax/Lmin is the ratio of L at 0 and saturating calcium concentrations. Rmin, Rmax, Lmax and Lmin are constant parameters that depend on the optical system used. Under our conditions these values were: Rmin = 0.96, Rmax = 9.21, Lmax/Lmin = 6.38.
2.7. MMP-2 activity
Dissected RPE monolayer segments were homogenized with a pestle in Earle’s balanced salt solution (EBSS) and centrifuged for 30 minutes at 15,000g at 4°C. Supernatant was collected, and protein concentration determined using the BCA method (Bio-Rad, Hercules, CA). MMP-2 activity was assessed with 10% zymogram gels (Invitrogen Corp., Carlsbad, CA), as described previously (Cousins et al., 2003). Briefly, 20 μg of proteins from RPE tissue were used. Samples were diluted to normalize for protein quantity before the addition of 5x Laemmli buffer under nonreducing conditions. After electrophoresis, gels were washed for 1 hour in 2.5% Triton X-100 and incubated 24 hours in 50 mM Tris buffer. The gels were stained with Coomassie Blue and air dried. To analyze relative MMP-2 activity, the bands were scanned and quantitated by densitometry using ImageJ 1.17 software.
2.8. MMP-2 mRNA levels
MMP-2 mRNA expression was determined by real-time PCR. Total RNA was extracted by utilizing the RNeasy Mini Kit. The primer mixture was purchased from ABI (Applied Biosystems, Foster City, CA) and used as specified by the manufacturer. For each molecule 1 to 3 μg of total RNA was used to generate cDNA with a Super Script III First Strand Synthesis Kit (Novex-Invitrogen, San Diego, CA). SYBR Green Master Mix and an ABI Prism 7900HT detection system (Applied Biosystems, Foster City, CA) were used. The PCR conditions consisted of an initial denaturation step at 95°C for 10 min and 40 cycles at 95°C for 10 s of denaturation, 64°C for 20 s of annealing, and 72°C for 20 s of extension. Samples were run in triplicate to ensure amplification integrity. The primer sets used were as follows: MMP-2: (forward) 5′-GGACAGTGACACCACGTGAC-3′ and (reverse) 5′-GTATCCTCGCTCCAGAGTGC-3′ and GAPDH: (forward) 5′-TGCACCACCAACTGCTTAG- 3′ and (reverse) 5′-GGATGCAGGGATGATGTTC-3′. Signals for MMP-2 were standardized against the GAPDH mRNA signal. As standards, each PCR was run on a five-fold dilution range of 2 pg of plasmid containing the appropriate template. Data are expressed as percentage of control animals.
2.9. Reverse zymography
Dissected RPE monolayer segments were homogenized, supernatant collected, and protein concentration determined as described above in Section 2.7. Then, samples were diluted as needed in Laemmli buffer and combined with an equal volume of Tris-glycine SDS (Invitrogen-Gibco, Carlsbad, CA). Twenty μg of protein extracts from each sample were loaded. TIMP-2 standards were loaded on each gel (EMD Biosciences, Inc., San Diego, CA). Protein samples were electrophoresed at 75 V for 2.5 hours on a standard separating gel composed of 2.25 mg/mL porcine gelatin, 0.25 M Tris-HCl (pH 8.8), 0.125% SDS, 1 μL/mL TEMED, 0.4 mg/mL ammonium persulfate, 15% acrylamide and 0.4% bisacrylamide, and 100 ng/mL proenzyme MMP-2 (EMD Biosciences, Inc.). A 4% stacking gel was used. After electrophoresis, gels were incubated in 1X zymogram renaturing buffer (Invitrogen-Gibco, Carlsbad, CA) with gentle agitation for 3 hours at room temperature, replacing the solution every hour. Then, the renaturing buffer was replaced with 100 mL 1X developing buffer (Invitrogen-Gibco, Carlsbad, CA). Gels were then incubated at 37°C overnight. Each gel was stained with 0.5% Coomassie Blue G250 in 30% methanol/10% acetic acid for 4 hours followed by four washes of destaining solution of 30% methanol/10% acetic acid for 1, 15, 30, and 60 minutes. Gels were further destained in 1% TritonX-100 solution for 1 hour and stored in distilled water until densitometry was performed. Gels were analyzed by densitometry using ImageJ 1.17 software as described earlier.
2.10. Assessment of collagen type IV
Isolated RPE sheets were homogenized with a pestle into 50 mM Tris-HCl buffer containing protease inhibitors (4 mM N-ethylmalemide, 1 mM PMSF, 5 mM benzamidine hydrochloride, 25 mM ε-aminocaproic acid) and then incubated with collagenase type IV (Invitrogen-Gibco, Carlsbad, CA) at 37°C for 48 hours. Insoluble materials were removed by 15-minute centrifugation at 10,000g and the supernatant collected. Then, protein concentration determined by BCA method as described above in Section 2.7. ELISA for collagen type IV was performed as described (Marin-Castano et al., 2005). Briefly, equal amount of proteins from the supernatant were incubated for 2 hours at 37°C, then in blocking solution for an additional 30 minutes. Incubation with antibody against collagen type IV (M61403, Biodesign International, Temecula, CA) diluted 1:3,000 in blocking solution was performed overnight at 4°C. After washes, a biotinylated goat anti-rabbit IgG (Sigma-Aldrich, St. Louis, MO) was added for 2 hours. The concentrations of the type IV standards were 0 to 3 ng/well. Final values were expressed as nanograms per 100 μg of protein, and results were expressed as the percentage of control (untreated animals).
2.11. Statistical analysis
The differences were tested using the non-parametric Mann-Whitney U-test which was used for comparison between two unpaired variables. The Kruskal-Wallis test and post hoc Wilcoxon-Mann-Whitney U-test were used for zymography and Western blot densitometric analysis. Results were expressed as mean ± SEM. P < 0.05 was considered to be significant. All analyses were performed with Prism 4 software (Graphpad Software Inc, San Diego, CA).
3. Results
3.1. Angiotensin II receptor subtype expression in mouse RPE
We first determined whether mouse RPE expressed Ang II receptors as assessed by RT-PCR and Western blot analysis. As shown in Figure 1, we were able to detect AT1a, AT1b, and AT2 receptor transcripts (shown are representative 523-bp, 457-bp, and 328-bp amplicons of mouse AT1a, AT1b, and AT2 mRNA; Figure 1A, C). Western blot revealed bands at approximately 42 kD using AT1 antisera and at approximately 50 kD using AT2 antisera (Figure 1B, D), as demonstrated in mesenchymal epithelial cells and other tissues (Shariat-Madar et al., 2006; Zhang et al., 2004: Zhou et al., 2006). These findings demonstrate that under basal conditions, C57Bl/6 mouse RPE expresses both Ang II receptors.
Figure 1.

Ang-II receptor transcript levels and protein in C57BL/6 RPE mice. Total RNA and protein were extracted from freshly isolated RPE sheets. (A, C) Agarose gel from a representative experiment. AT2, AT1a and AT1b receptors mRNA expression was analyzed by RT-PCR. Representative amplicons of AT2, 328 bp; AT1a, 523 bp; AT1b, 457 bp, minus (−) RT, and molecular weight standard were run in parallel. Adrenal gland (AD) from C57BL/6 mouse was used as positive control. (B, D) Mouse RPE derived AT1 and AT2 protein expression evaluated by Western blot using AT1 (N-10) antiserum and AT2 (H-143) antiserum.
3.2. Effect of Angiotensin II infusion on systolic blood pressure
It is generally accepted that long-term infusion of suppressor doses of Ang II gradually leads to HTN. Mice were rendered hypertensive by infusion of Ang II with osmotic minipumps for 4 weeks as described in the Methods section. Tail-cuff measurements of systolic blood pressure (BP) revealed an increase in C57Bl/6 mice after 2 weeks of Ang II infusion (Figure 2). BP increased to 151.7±9.2 mmHg vs 101.9±6.1 mmHg in control (P<0.01). This BP elevation persisted after 4 weeks of treatment with Ang II (160.2±7.1 mmHg vs 104.6±10.2 mmHg in control; P<0.01). However, after 6 hours of Ang II infusion, systolic BP remained unchanged compared to saline controls (99± 4.7 mmHg vs 103±9.5 mmHg).
Figure 2.

Systolic blood pressure in response to administration of Ang II (3.0 μg/Kg/min) alone for 6 hr, 2 wk, or 4 wk and Ang II in combination with the AT1 receptor antagonist candesartan (CD, 10 mg/Kg/day) or the AT2 receptor antagonist PD123319 (PD, 50 mg/Kg/day) for 4 weeks in C57BL/6 mice. *P <0.05 vs. their respective basal blood pressure. #P <0.05 vs. Ang II administration for 4 weeks.
Pharmacologic studies with AT1 and AT2 receptor antagonists were performed during the 4 weeks of infusion with Ang II. We found that AT1-receptor antagonist candesartan abolished Ang II-induced changes in BP, whereas AT2 receptor antagonist PD123319 did not modify the effect of Ang II on systolic BP. In conclusion, the Ang II-mediated effect on systolic BP is mediated by the AT1 receptor.
3.3. Effect of long-term infusion of Angiotensin II on plasma and eye Angiotensin II levels
As shown in Figure 3A, plasma Ang II levels were markedly increased from 101.6±16.2 to 178.7±30.3 fmol/ml by Ang II infusion (P<0.01). Plasma Ang II levels similarly increased after concurrent administration of Ang II with candesartan or PD123319 to 213.4±12.4 and 196.8±15.2 fmol/ml (P <0.01 vs control) respectively and were not significatively different from Ang II alone. The whole eye Ang II levels in control mice (Figure 3B) were approximately 160.48±24.8 pg/100 mg eye weight. Infusion of Ang II alone or in combination with the AT2 receptor blocker markedly increased whole eye Ang II levels to 492.32±17.5 and 452.71± 12.9 pg/100 mg eye weight (P<0.01) respectively. The whole eye Ang II levels were reduced to 261.90±12.1 pg/100 mg eye weight by the AT1 receptor blocker candesartan (P<0.01).
Figure 3.
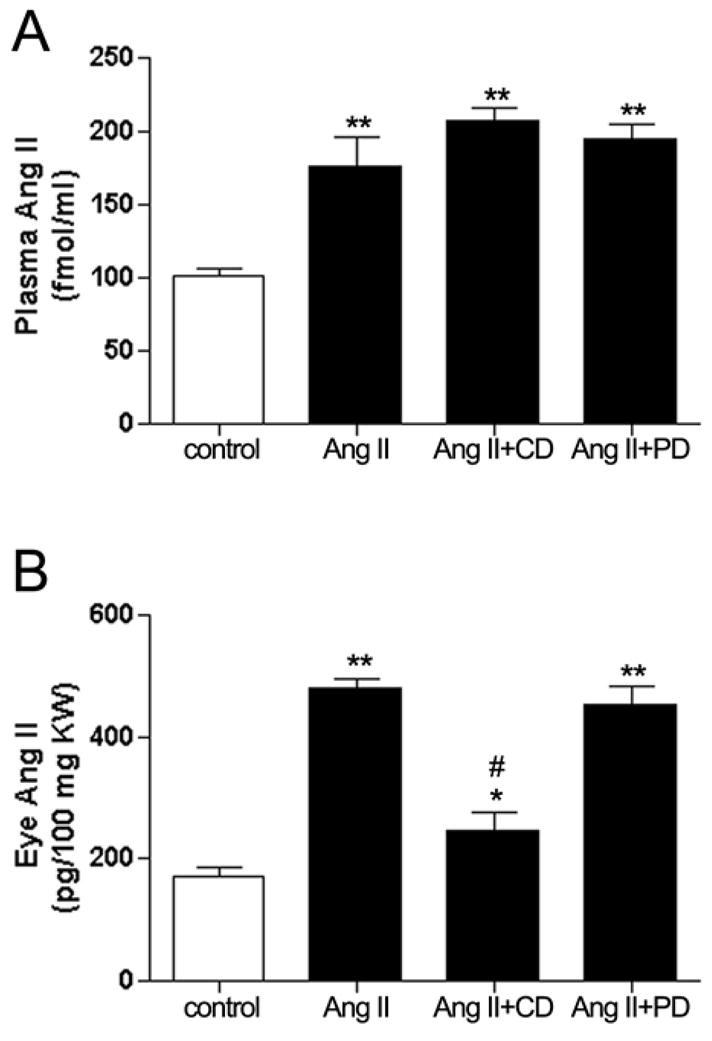
Circulating (A) and whole eye (B) Ang II levels in response to administration of Ang II (3.0 μg/Kg/min) or concurrent administration with the AT1 receptor antagonist candesartan (CD, 10 mg/Kg/day) or the AT2 receptor antagonist PD123319 (PD, 50 mg/Kg/day) for 4 weeks in C57BL/6 mice. Data are expressed as percentage of control and graphed as mean ± SEM. *P <0.05 and **P <0.01 vs. control. #P <0.05 vs. Ang II treated group. n = 6 eyes/group.
3.4. Regulation of AT1 and AT2 receptor mRNA by Angiotensin II
Ang II has been previously shown to regulate the levels of both Ang II receptor subtypes in nonocular tissues (de Gasparo et al., 2000). Herein, we investigated whether elevated levels of Ang II associated with HTN modulate AT1 and AT2 expression in mouse RPE. We found that Ang II regulated AT1 receptor subtypes AT1a and AT1b mRNA expression. Infusion of Ang II for 4 weeks increased AT1a mRNA levels by approximately 1.6-fold (162.5%±11.7%; P<0.01). On the other hand, AT1b mRNA levels decreased by approximately 55.8% (49.13%±2.6%; P<0.01) after 4 weeks of Ang II infusion (Figure 4). We also found minimal, nonsignificant changes, in AT2 mRNA expression after 4 weeks of Ang II treatment (Figure 5). Thus, only the levels of AT1 receptor subtypes mRNA were regulated by Ang II, with AT1a upregulation and AT1b downregulation.
Figure 4.
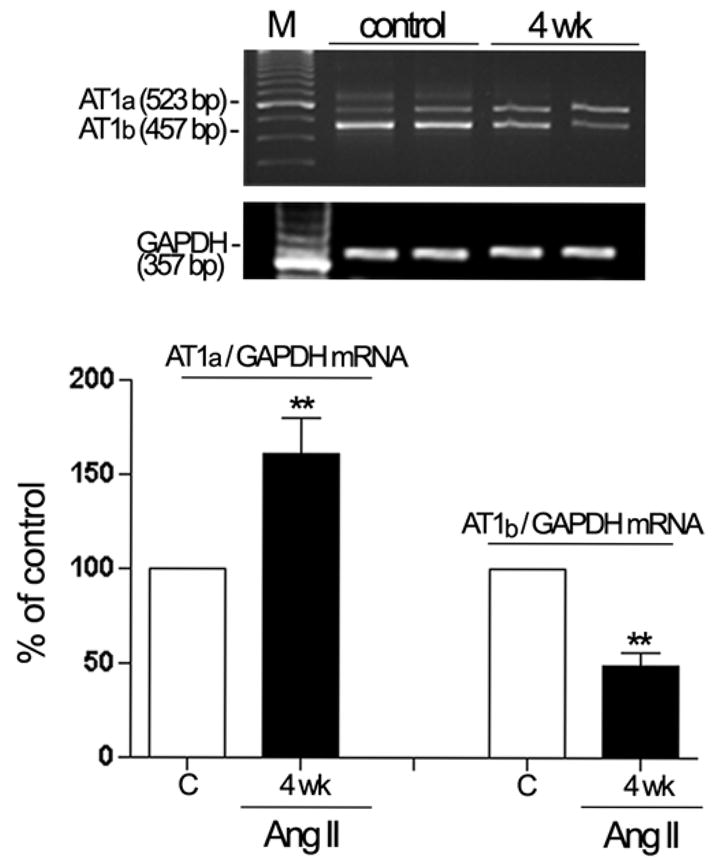
Regulation of AT1a and AT1b mRNA in dissected RPE from mice infused with saline or Ang II (3.0 μg/Kg/min) for 4 weeks. Expression of AT1a, AT1b and GAPDH mRNA was analyzed by RT-PCR. AT1a and AT1b mRNA expression was normalized to GAPDH. Total RNA was extracted from RPE sheets (n = 6 eyes/group). Top: agarose gel from two representative experiments. Lane M: marker. The number on the left represents the molecular weight of PCR product. Bottom: data are the average results from six eyes. Data are expressed as percentage of control, and shown are mean results ± SEM. Statistical significance is indicated by **P < 0.01 for compared to the control group.
Figure 5.
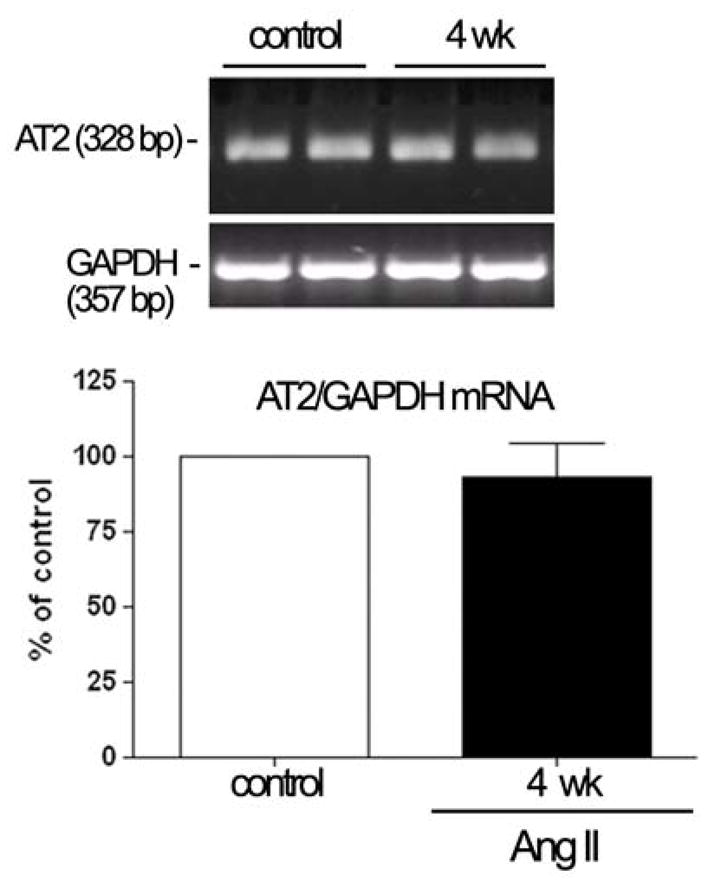
Relative quantification of AT2-receptor expression in isolated RPE sheets from mice infused with saline or Ang II (3.0 μg/Kg/min) for 4 weeks. Total RNA was extracted from RPE sheets from six eyes. Expression of AT2 and GAPDH mRNA was analyzed by RT-PCR. The mRNA levels were expressed by normalizing the densitometric values to those of the corresponding GAPDH. Top: agarose gel from two representative experiments. The number on the left represents the molecular weight of PCR product. Bottom: data are the average results from six eyes. Data are expressed as a percentage of control, and shown are mean results ± SEM.
3.5. Angiotensin II-stimulated [Ca2+]i signaling in mouse RPE
A number of studies have shown that Ang II induces an increase in [Ca2+]i in nonocular tissues (Fellner and Arendshorst, 2005; Marin-Castano et al., 1998, Wang et al., 2006; Zhuo et al., 2006). However, its effect in RPE cells has not been reported. To determine whether Ang II increases [Ca2+]i by activating its specific receptors, we measured responses to infusion of Ang II (10−9 M) alone or in combination with its receptor blockers (10−8 M) in segments of RPE. The level of [Ca2+]i was approximately 102±14 nM under basal conditions (Figure 6). In contrast, Ang II stimulation rapidly increased [Ca2+]i in RPE. Ang II elicited a biphasic [Ca2+]i signal with a transient peak between 3–5 minutes after stimulation, followed by a stationary phase slightly above the baseline by 20 minutes (Figure 6Aa). Pretreatment with the AT1 receptor antagonist candesartan (Figure 6Ab), but not with the AT2 antagonist PD 123 319 (Figure 6B), prevented the Ang II–induced [Ca2+]i responses, suggesting that in mouse RPE the Ang II-mediated increase in [Ca2+]i is mediated by the AT1 receptors and that these receptors are coupled to [Ca2+]i signaling.
Figure 6.

Representative recording of intracellular calcium [Ca2+]i mobilization in isolated RPE sheets under basal conditions and during Ang II (10−9 M) stimulation with or without candesartan (CD, 10−8 M), a selective AT1 receptor antagonist or PD123319 (PD, 10−8 M), a selective AT2 receptor antagonist added 5 minutes before and during Ang II stimulation. (A) Stimulation with Ang II (10−9 M) alone (a) and in combination with CD (b). (B) Stimulation with Ang II in combination with PD, added 5 minutes before and during Ang II stimulation. Ang II increased [Ca2+]i via AT1 receptor.
3.6. Regulation of MMP-2 Activity and mRNA expression by Angiotensin II via AT1 receptor
An increase in MMP-2 activity of ~1.45 fold (147%±3.5%; P<0.05) was seen in RPE from animals treated with Ang II for 4 weeks (Figure 7A). This effect was completely abolished by the AT1 receptor antagonist candesartan and unaffected by AT2 receptor antagonist PD123319, as shown in Figure 7B. To compare the impact of Ang II on the ratio of secreted pro-MMP-2 protein (72 kD) to cleaved, active MMP-2 (62 kD) we performed Western blot analysis. We found a nonsignificant decrease in MMP-2 protein after 4 weeks of Ang II infusion (Figure 7C). The ratio of the cell-associated latent to active MMP-2 protein was greater than 1.3 for treated and control animals. We also performed real-time RT-PCR on total RNA extracts to determine the effect of HTN-associated Ang II on MMP-2 mRNA expression. A modest increase of approximately 44% was observed after exposure of animals to Ang II for 4 weeks (Table 2). In addition this increase was partially blocked by the AT1 receptor blocker candesartan. In summary, HTN-associated Ang II increased MMP-2 activity and mRNA expression but did not change MMP-2 protein levels. The increase in the ratio of pro-MMP-2 to active MMP-2 suggests the loss of cell surface proteases responsible for cleavage of the inactive to the active forms.
Figure 7.
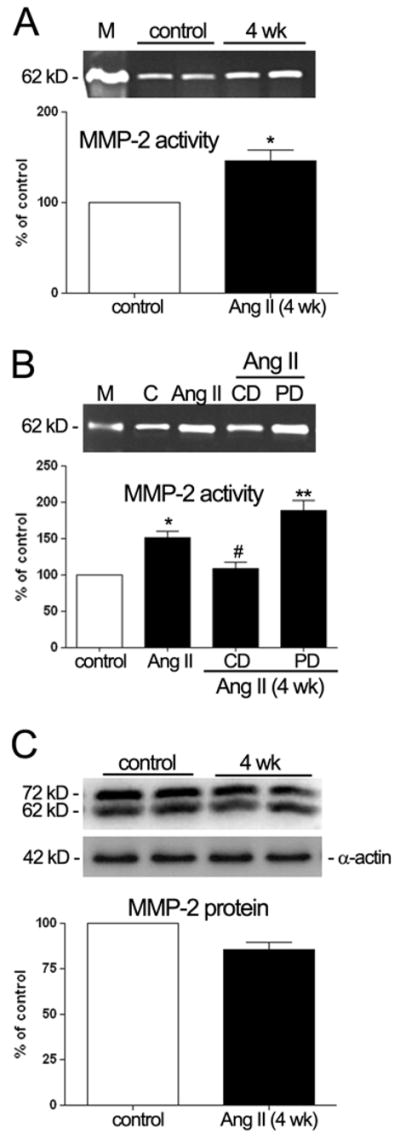
MMP-2 activity and protein in freshly isolated RPE sheets from control and treated mice. Elevated circulating levels of Ang II associated with HTN up-regulated MMP-2 protein activity, and did not alter MMP-2 protein expression. RPE-derived MMP-2 activity evaluated by zymography (A, B) and RPE-derived MMP-2 protein evaluated by Western blot (C). Protein was extracted from RPE sheets (n = 6 eyes/group). Animals were treated with saline, Ang II (3.0 μg/Kg/min) or Ang II (3.0 μg/Kg/min) in combination with candesartan (10 mg/Kg/day) or PD123319 (50 mg/Kg/day). Top: gelatin zymogram or Western blot from two representative experiments. Bottom: data are the average results from six eyes expressed as percentage of control. Lane M: marker. Lane C: control. Number on the left represents protein molecular weight in kilodaltons. Data represent the relative amount of the 62 kDa form (A, B) or the relative amount of both, 62 and 72 kDa (C). MMP-2 protein was normalized to α-actin. Statistically significant differences (*P< 0.05 and **P< 0.01) compared with the controls. #P< 0.05, is statistically significant compared with the Ang II treated mice.
Table 2.
Regulation of MMP-2 mRNA in C57BL/6 mice infused with Ang II alone or in combination with its receptor blockers in drinking water for 4 weeks. Total RNA was extracted from RPE sheets isolated from 6 eyes in each group. MMP-2 mRNA expression was normalized to GAPDH. MMP-2 mRNA expression increased in RPE from both Ang II (3.0 μg/Kg/min) infused mice and animals infused with Ang II (3.0 μg/Kg/min) in combination with PD123319 (PD, 50 mg/Kg/day) the AT2 receptor blocker compared to controls. The increase in MMP-2 mRNA in the Ang II infused group was inhibited by the AT1 receptor blocker candesartan (CD, 10 mg/Kg/day). Data are the average results from three pairs of eyes expressed as percentage of control. * Statistically significant at P< 0.05.
| MMP-2 mRNA | ||
|---|---|---|
| Treatment | Amoung (ng) | % Change |
| Control 4 wk | 101.25 | |
| Ang II for 4 wk | 145.31 | +44.06* |
| Ang II+CD for 4 wk | 99.43 | −1.82 |
| Ang II+PD for 4 wk | 152.27 | +51.02* |
Values are means ± SEM of six eyes for each condition. Ang II: Angiotensin II, CD: candesartan, PD:PD123319.
P<0.05 when compared with non- treated control animals.
3.7. Regulation of TIMP-2 by Angiotensin II
The trimolecular complex of proMMP-2, MMP-14, and TIMP-2 is critical for MMP-2 activation in RPE cells (Alcazar et al., 2007). To evaluate potential posttranslational regulation of MMP-2 activity, the endogenous regulator TIMP-2 was studied using reverse zymography and Western blot analysis. As shown in Figure 8, there were no significant differences in TIMP-2 activity (Figure 8A) and protein (Figure 8B) expression in RPE sheets freshly isolated from hypertensive Ang II treated mice compared to controls.
Figure 8.

TIMP-2 activity and protein in freshly isolated RPE sheets from control and treated mice. RPE sheets from mice infused with Ang II (3.0 μg/Kg/min) and their respective controls were subject to reverse zymography (A) and Western blot (B) as described in Section 2. TIMP-2 activity and protein in treated animals did not differ compared to the controls. Top: reverse zymogram or Western blot from two representative experiments. Bottom: data are the average results from 6 eyes expressed as percentage of control. Lane M: standard. Number on the left represents protein molecular weight in kilodaltons. TIPM-2 protein expression was normalized to α-actin. Data represent the relative amount of the 21 kDa form. n = 6 eyes/group.
3.8. Regulation of collagen Type IV by Angiotensin II
Long-term infusion of Ang II induced an approximately 1.5-fold increase (151.33% ± 6.25%; P < 0.05) in collagen type IV accumulation (Figure 9), which was completely abolished by the AT2 Ang II receptor blocker.
Figure 9.
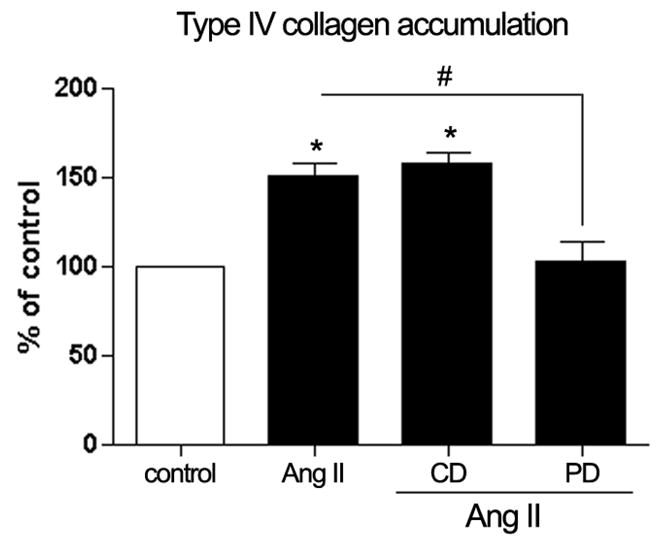
Quantification of type IV collagen accumulation in isolated RPE sheets by ELISA. Infusion of Ang II (3.0 μg/Kg/min) for 4 weeks upregulated type IV collagen accumulation in freshly RPE sheets from C57BL/6 mice but did not induce changes in collagen type IV accumulation in these animals during the concurrent administration of Ang II (3.0 μg/Kg/min)with the AT1 receptor blocker candesartan (CD, 10 mg/Kg/day). The effect of Ang II infusion on type IV collagen was inhibited by the AT2 receptor blocker PD123319 (PD, 50 mg/Kg/day). Data are the average results from six eyes expressed as percentage of control, and shown are mean results ± SEM. Statistical significance (*P < 0.05) compared with the control and #P< 0.05 compared with the Ang II treated mice.
4. Discussion
AMD is characterized by the accumulation of specific deposits under the RPE and within BrM (Abdelsalam et al., 1999). To date, there is little consensus on the pathophysiologic mechanisms underlying early AMD, although hypertension (HTN) constitutes a significant risk factor (Hyman et al., 2000; Jonas et al., 2003; Klein et al., 2003). Dysregulation of extracellular matrix (ECM) turnover also appears to play an important role in the pathogenesis of AMD (Deryugina et al., 1989, Fine at al., 2000, Marin-Castano et al., 2005, 2006). However, the mechanism(s) associating HTN with AMD remains unexplored. Interestingly, the presence of Ang II and its receptors in the eye (Danser et al., 1994; Savaskan et al., 2004; Senanayake et al., 2007) as well as Ang II effects on ECM turnover (Eagleton et al., 2006; Huang et al., 2008; Wang et al., 2005) have opened the possibility for a prominent pathological role of Ang II in AMD. Some studies have demonstrated similar pathologic age-related changes in other tissues (Lee et al., 2000; Ruiz-Ortega et al., 2003; Taylor et al., 1999).
We have previously reported the presence of both AT1 and AT2 in human RPE and their regulation by Ang II in human RPE cells (Marin-Castano et al., 2004). In addition, MMP-2 activity, which plays a central role in the pathogenesis of sub-RPE deposit accumulation (Ahir et al., 2002; Eichler et al., 2002; Marin-Castano et al., 2006; Padgett et al., 1997) was upregulated by Ang II in human RPE cells (Marin-Castano et al., 2004). Ang II has been shown to regulate ECM turnover not only in RPE cells, but multiple other cell types such as glomerular mesangial cells, endothelial cells, fibroblasts, and smooth muscle cells (Castoldi et al., 2003; Lijneri et al., 2006; Uchiyama-Tanaka et al., 2001; Wang et al., 2005). Therefore the objectives of this study were to correlate our in vitro results with in vivo responses, and to determine whether HTN-associated Ang II levels may contribute to the RPE synthesis of ECM molecules responsible for basement membrane and BrM turnover. To further investigate the presence of Ang II receptor subtypes, the Ang II ability to regulate ECM turnover, and the Ang II receptor subtype specificity involved in AngII-induced responses, we used the Ang II-infused hypertensive mouse model in which the animals slowly develop HTN (Li et al., 2007). Given that tissue-specific differences in Ang II effects must be considered, both plasma and whole eye Ang II levels were measured. Our study confirmed previous findings that long-term Ang II infusion raised blood pressure and that the AT1 receptor blocker CD significantly attenuated Ang II responses (Li et al., 2007). In addition, we demonstrated that infusion of Ang II for 4 weeks increased plasma and whole eye Ang II levels. Chronic blockade of AT1-receptor with CD for 4 weeks attenuated the increase in whole eye Ang II levels even though plasma Ang II levels were markedly increased. This augmentation of Ang II in the eye may have occurred secondary to AT1-receptor-mediated uptake of circulating Ang II and/or AT1-receptor-medited stimulation of intraocular Ang II generation, as demonstrated in the kidney in the rat model of Ang II-dependent hypertension (Zou et al., 1998, 2006).
First, we isolated RPE sheets from hypertensive mice and controls, and utilized molecular biology and Western blot techniques directly applied on isolated RPE to show expression of the Ang II receptors. Using these techniques, we were able to detect both AT1 and AT2 Ang II receptor subtypes in RPE at the mRNA and protein levels.
Based on the physiologic importance of Ang II receptors AT1 and AT2, the regulation of these receptors was evaluated. Our data showed that Ang II infused for 4 weeks differentially regulated RPE AT1a and AT1b mRNA expression: AT1a mRNA was up-regulated, whereas AT1b was down-regulated. In contrast, studies in other tissues demonstrated parallel regulation of AT1a and AT1b receptors or a marked increment in AT1a without change in AT1b mRNA expression in response to HTN (Ruan et al., 1997; Sangaleti et al., 2004). These data may be explained by the fact that the regulation of AT1 receptor subtypes is tissue-dependent in rodents (de Gasparo et al., 1994; Iwai et al., 1992; Kitami et al., 1992; Llorens-Cortes et al., 1994). In addition, and in agreement with previous reports in other organs (Naoki et al., 1997; Reja et al., 2006; Sangaleti et al., 2004), AT2 mRNA levels appeared unchanged in RPE from hypertensive mice.
Once we verified that murine RPE express Ang II receptors that can be regulated at the transcriptional level by Ang II, we evaluated whether these receptors were functional. It has been reported that Ang II receptor activation results in signal transduction with a characteristic increase in the levels of intracellular calcium (de Gasparo et al., 2000; Helou and Marchetti, 1997; Mahta and Griendling, 2007). Our data showed that stimulation of the AT1 receptor by Ang II resulted in an increase in the levels of intracellular calcium. This result strongly suggests that the AT1 receptor expressed in mouse RPE is functionally active. In comparison, stimulation of AT2 by Ang II was not accompanied by mobilization of intracellular calcium. These data suggest differences exist in AT2 receptor coupling in murine RPE. AT2 could be specifically coupled to the cytosolic phospholipase A2 pathway rather than the PLC pathway as recently shown in renal mesangial and proximal tubular epithelium cells (Cui et al., 2006).
The RPE is a central element in the pathogenesis of AMD. Dysfunctional RPE cells may alter the normal turnover of ECM components modifying sub-RPE deposit formation as well as BrM and RPE basement membrane turnover. These pathways all lie at the origin of early AMD (Abdelsalam et al., 1999; Young, 1997). In this regard, we have shown that the RPE synthesizes MMP-2, MMP-14, TIMP-2, and collagen type IV, and that these molecules can be regulated by physiologic stimuli (Marin-Castano et al., 2005, 2006). In this study we reported that Ang II treatment for 4 weeks up-regulates MMP-2 activity and mRNA expression in mouse RPE. These effects were blocked by the AT1 receptor blocker CD indicating that Ang II could induce ECM turnover by enhancing the release of active MMP-2 via AT1 activation. We did not find a direct correlation between MMP-2 enzymatic activity and protein. In addition, the ratio of secreted pro-MMP-2 protein to cleaved, active MMP-2 was greater than 1.3 for control and treated animals suggesting that MMP-2 regulation occurs by gene transcription, translational regulation and posttranslational activation of proenzymes.
Pro-MMP-2, MMP-14, and TIMP-2 form a trimolecular complex resulting in MMP-2 activation (Nagase et al., 2006). Pro-MMP-2 activation occurs only when TIMP-2 levels are low relative to MMP-14 levels. This ratio of low TIPM-2 to MMP-14 permits active MMP-14 to activate the pro-MMP-2 bound in the ternary complex (Alcazar et al., 2007; Nagase et al., 2006). Our study sought to explore whether Ang II may also influence TIMP-2 regulation. We did not find a direct correlation between TIMP-2 and MMP-2 activity. This response may be specific to the RPE since Ang II has been shown to regulate TIMP-2 expression in glomerular and tubular epithelial cells from mice (Han et al., 2006). It is possible that excess MMP-14 relative to TIMP-2 may block all active TIMP-2, therefore inhibiting proteolysis of pro-MMP-2 to active MMP-2. These studies are beyond the scope of this paper, however, and are the subject of ongoing investigations.
In addition to finding that Ang II modulates MMP-2 activity; our results also clearly demonstrate a significant increase in type IV collagen accumulation in RPE after treatment with Ang II. While blockade of AT1 inhibited the effect on MMP-2 activity, the inhibition of AT2, but not AT1, blocks the type IV collagen response. No direct correlation was found between MMP-2 activity and type IV collagen accumulation. Our results suggest that Ang II associated with HTN regulates both MMP-2 activity and accumulation of type IV collagen, and these effects are mediated by different Ang II receptors. This work demonstrated for the first time that Ang II receptors are expressed and regulated by Ang II in mouse RPE and support a previously unrecognized link between HTN, ECM turnover, and Ang II receptor activation.
We have previously shown that exposure of human RPE to oxidant injury, leads to non-lethal blebbing and decreased MMP-2 activity and that loss of RPE MMP-2 activity is correlated with sub-RPE deposit formation in vivo, which contain blebs within BrM (Marin-Castano et al., 2005, 2006). Based on these studies with oxidant stimuli in vivo and in vitro, and on our data from this study, we speculate that sub-RPE deposits formed in response to oxidative damage might need an additional injury for these deposits to traverse the RPE basement membrane to reach BrM and form the typical deposits associated with AMD. In addition, we suspect that an additional injury is also needed for the formation of new basement membrane under the RPE and that Ang II might be this second inury. Therefore, in vivo studies with oxidative injury followed by exposure to HTN remains a possibility to be investigated.
Taken together, these data provide evidence that MMP-2 activity increases in mouse RPE after exposure to elevated circulating levels of Ang II associated with HTN and may help to explain, at least in part, the breakdown of the RPE basement membrane with subsequent integration of debris into BrM. Our data also evidence accumulation of type IV collagen in the RPE of these hypertensive mice, which may help to explain the formation of new basement membrane under the RPE in AMD eyes. Given that the Ang II receptors in rodents are similar to human Ang II receptors, our study help to elucidate the mechanism(s) by which Ang II receptor blockers may prevent these ECM changes important for early AMD development and provide a potential future clinical tool for the prevention of AMD.
Acknowledgments
The authors thank Drs. Oscar Alcazar, Marianne Pons, and Colleen Cebulla for critical reading of the manuscript. Dr. Min-Sheng Zhou’s technical support is appreciated. This work was supported by the NIH grant EY015249-01A1, NEI P30 Core Grant EY014801, and an unrestricted grant from Research to Prevent Blindness to the University of Miami.
Footnotes
Publisher's Disclaimer: This is a PDF file of an unedited manuscript that has been accepted for publication. As a service to our customers we are providing this early version of the manuscript. The manuscript will undergo copyediting, typesetting, and review of the resulting proof before it is published in its final citable form. Please note that during the production process errors may be discovered which could affect the content, and all legal disclaimers that apply to the journal pertain.
References
- Abdelsalam A, et al. Drusen in age-related macular degeneration: pathogenesis, natural course, and laser photocoagulation-induced regression. Surv Ophthalmol. 1999;44:1–29. doi: 10.1016/s0039-6257(99)00072-7. [DOI] [PubMed] [Google Scholar]
- Alcazar O, et al. MMP-14 and TIMP-2 overexpression protects against hydroquinone-induced oxidant injury in RPE: implications for extracellular matrix turnover. Invest Ophthalmol Vis Sci. 2007;48:5662–5670. doi: 10.1167/iovs.07-0392. [DOI] [PubMed] [Google Scholar]
- Ahir A, et al. Expression of metalloproteinases from human retinal pigment epithelial cells and their effects on the hydraulic conductivity of Bruch’s membrane. Invest Ophthalmol Vis Sci. 2002;43:458–465. [PubMed] [Google Scholar]
- Berger JW, et al. Age-Related Macular Degeneration. Mosby; St. Louis: 1999. [Google Scholar]
- Berka JL, et al. Renin-containing Muller Cells of the retina display endocrine features. Invest Ophthalmol Vis. 1995;36:1450–1458. [PubMed] [Google Scholar]
- Brandt AM, et al. Renin mRNA is synthesized locally in rat ocular tissues. Curr Eye Res. 1994;13:755–763. doi: 10.3109/02713689409047011. [DOI] [PubMed] [Google Scholar]
- Burson JM, Aguilera G, Gross KW, Sigmund CD. Differential expression of angiotensin receptor 1A and 1B in mouse. Am J Physiol. 1994;301:260–267. doi: 10.1152/ajpendo.1994.267.2.E260. [DOI] [PubMed] [Google Scholar]
- Castoldi G, et al. ANG II increases TIMP-1 expression in rat aortic smooth muscle cells in vivo. Am J Physiol Heart Circ Physiol. 2003;284:H635–H643. doi: 10.1152/ajpheart.00986.2001. [DOI] [PubMed] [Google Scholar]
- Corcoran ML, et al. MMP-2: expression, activation and inhibition. Enzyme protein. 1996;49:7–19. doi: 10.1159/000468613. [DOI] [PubMed] [Google Scholar]
- Cousins SW, et al. Estrogen Loss, and Sub-RPE Deposit Formation in Aged Mice. Invest Ophthalmol Vis Sci. 2003;44:1221–1229. doi: 10.1167/iovs.02-0285. [DOI] [PubMed] [Google Scholar]
- Cui XL, et al. Oxidative signaling in renal epithelium: Critical role of cytosolic phospholipase A2 and p38(SAPK) Free Radical Biology and Medicine. 2006;41:190–192. doi: 10.1016/j.freeradbiomed.2006.02.004. [DOI] [PMC free article] [PubMed] [Google Scholar]
- Danser AH, et al. Angiotensin levels in the eye. Invest Ophthalmol Vis Sci. 1994;35:1008–1018. [PubMed] [Google Scholar]
- de Gasparo M, Levens NR. Pharmacology of Angiotensin II receptors in the kidney. Kidney Int. 1994;46:1486–1491. doi: 10.1038/ki.1994.426. [DOI] [PubMed] [Google Scholar]
- de Gasparo M, et al. International Union of Pharmacology. XXIII The Angiotensin II Pharmacological Reviews. 2000;52:415–472. [PubMed] [Google Scholar]
- Deryugina EI, et al. Remodeling of collagen matrix by human tumor cells requires activation and cell surface association of matrix metalloproteinase-2. Cancer Res. 1989;58:3743–3750. [PubMed] [Google Scholar]
- Douglas JG, Hopfer V, et al. Novel aspect of angiotensin receptors and signal transduction in kidney. Annu Rev Physiol. 1994;56:649–669. doi: 10.1146/annurev.ph.56.030194.003245. [DOI] [PubMed] [Google Scholar]
- Eagleton MJ, et al. Early increased MT1-MMP expression and late MMP-2 and MMP-9 activity during Angiotensin II induced aneurysm formation. J Surg Res. 2006;135:345–51. doi: 10.1016/j.jss.2006.03.026. Invest. [DOI] [PubMed] [Google Scholar]
- Eichler W, et al. Modulation of matrix metalloproteinase and TIMP-1 expression by cytokines in human RPE cells. Invest Ophthalmol Vis Sci. 2002;43:2767–2773. [PubMed] [Google Scholar]
- Fellner SK, et al. Angiotensin II, reactive oxygen species, and Ca2+ signaling in afferent arterioles. Am J Physiol Renal Physiol. 2005;289:1012–1019. doi: 10.1152/ajprenal.00144.2005. [DOI] [PubMed] [Google Scholar]
- Ferrari-Dileo G, et al. Angiotensin II binding receptors in retinal and optic nerve head blood vessels. An autoradiographic approach. Invest Ophthalmol Vis Sci. 1991;32:21–26. [PubMed] [Google Scholar]
- Fine SL, et al. Age-related macular degeneration. N Engl J Med. 2000;342:483–492. doi: 10.1056/NEJM200002173420707. [DOI] [PubMed] [Google Scholar]
- Green WR. Histopathology of age-related macular degeneration. Mol Vis. 1999;5:27. [PubMed] [Google Scholar]
- Grynkiewicz G, et al. A new generation of Ca2+ indicators with greatly improved fluorescence properties. J Biol Chem. 1985;260:3440–3445. [PubMed] [Google Scholar]
- Han SY, et al. An imbalance between MMP-2 and tissue inhibitor of matrix metalloproteinase-2 contributes to the development of early nephropathy. Nephrol Dal Transplant. 2006;21:2406–2416. doi: 10.1093/ndt/gfl238. [DOI] [PubMed] [Google Scholar]
- Hayreh SS, et al. Macular lesions in malignant arterial hypertension. Ophthalmology. 1989;1989:230–246. doi: 10.1159/000310001. [DOI] [PubMed] [Google Scholar]
- Helou CM, Marchetti J. Morphological heterogeneity of renal glomerular arterioles and distinct [Ca2+]i responses to ANG II. Am J Physiol. 1997;273:F84–F96. doi: 10.1152/ajprenal.1997.273.1.F84. [DOI] [PubMed] [Google Scholar]
- Huang W, et al. Angiotensin II Type 1 Receptor Expression in Human Gastric Cancer and Induces MMP2 and MMP9 Expression in MKN-28 Cells. Dig Dis Sci. 2008;53:163–168. doi: 10.1007/s10620-007-9838-9. [DOI] [PubMed] [Google Scholar]
- Hyman L, et al. Hypertension, cardiovascular disease, and age-related macular degeneration. Arch Ophthalmol. 2000;118:351–358. doi: 10.1001/archopht.118.3.351. [DOI] [PubMed] [Google Scholar]
- Iwai N, et al. Differential regulation of rat AT1a and AT1b receptor mRNA. Biochem Biophys Res Commun. 1992;188:298–303. doi: 10.1016/0006-291x(92)92384-a. [DOI] [PubMed] [Google Scholar]
- Jonas JB, et al. Influence of arterial hypertension and diet-induced atherosclerosis on macular drusen. Graefes Arch Clin Exp Ophthalmology. 2003;241(2):125–134. doi: 10.1007/s00417-002-0615-3. [DOI] [PubMed] [Google Scholar]
- Kitami Y, et al. Differential gene expression and regulation of type-1 angiotensin II receptor subtypes in the rat. Biochem Biophys Res Commun. 1992;188:1090–1096. doi: 10.1016/0006-291x(92)92405-m. [DOI] [PubMed] [Google Scholar]
- Klein R, et al. The association of cardiovascular disease with the long-term incidence of age-related maculopathy. Ophthalmology. 2003;110:1273–1280. doi: 10.1016/S0161-6420(03)00599-2. [DOI] [PubMed] [Google Scholar]
- Kohler KW, et al. Angiotensin II in the rabbit retina. Vis Neurosci. 1997;14:63–71. doi: 10.1017/s0952523800008762. [DOI] [PubMed] [Google Scholar]
- Lee M, et al. Tissue renin-angiotensin systems: their role in the cardiovascular disease. Circulation. 2000;101:1362–1365. [PubMed] [Google Scholar]
- Li XC, et al. AT1 receptor-mediated accumulation of extracellular angiotensin II in proximal tubule cells: role of cytoskeleton microtubules and tyrosine phosphatases. Am J Physiol Renal Physiol. 2006;291:375–383. doi: 10.1152/ajprenal.00405.2005. [DOI] [PMC free article] [PubMed] [Google Scholar]
- Li XC, et al. Genetic deletion of AT1a receptors attenuates intracellular accumulation of Ang II in the kidney of AT1a receptor-deficient mice. Am J Physiol Renal Physiol. 2007;293:586–593. doi: 10.1152/ajprenal.00489.2006. [DOI] [PMC free article] [PubMed] [Google Scholar]
- Lijnen P, et al. Angiotensin II-stimulated collagen production in cardiac fibroblasts is mediated by reactive oxygen species. J Hypertens. 2006;24:757–766. doi: 10.1097/01.hjh.0000217860.04994.54. [DOI] [PubMed] [Google Scholar]
- Llorens-Cortes C, et al. Tissue expression and regulation of type 1 angiotensin II receptor subtypes by quantitative reverse transcriptase-polymerase chain reaction analysis. Hypertension. 1994;24:538–548. doi: 10.1161/01.hyp.24.5.538. [DOI] [PubMed] [Google Scholar]
- Marin-Castaño ME, et al. Differential induction of functional B1-bradykinin receptors along the rat nephron in endotoxin induced inflammation. Kidney. 1998;54(6):1888–1898. doi: 10.1046/j.1523-1755.1998.00201.x. [DOI] [PubMed] [Google Scholar]
- Marin-Castaño ME, et al. Angiotensin II receptors expression and function in retinal pigment epithelium. Annual Meeting of the Assosciation for Research in Vision and Ophthalmology; 2004. p. ARVO E-Abstract 1811. [Google Scholar]
- Marin-Castaño ME, et al. Nonlethal oxidant injury to human retinal pigment epithelium cells causes cell membrane blebbing but decreased MMP-2 activity. Ophthalmol Vis Sci. 2005;46:3331–3340. doi: 10.1167/iovs.04-1224. [DOI] [PubMed] [Google Scholar]
- Marin-Castaño ME, et al. Repetitive nonlethal oxidant injury to retinal pigment epithelium decreased extracellular matrix turnover in vitro and induced sub-RPE deposits in vivo. Invest Ophthalmol Vis Sci. 2006;47:4098–4112. doi: 10.1167/iovs.05-1230. [DOI] [PubMed] [Google Scholar]
- Mehta PK, Griendling KK. Angiotensin II cell signaling: physiological and pathological effects in the cardiovascular system. Am J Physiol cell Physiol. 2007;292:C82–C97. doi: 10.1152/ajpcell.00287.2006. [DOI] [PubMed] [Google Scholar]
- Nagase H, et al. Structure and function of matrix metalloproteinases and TIMPs. Cardiovasc Res. 2006;69:562–573. doi: 10.1016/j.cardiores.2005.12.002. [DOI] [PubMed] [Google Scholar]
- Naoki M, et al. Molecular mechanism of angiotensin II type I and type II receptors in cardiac hypertrophy of spontaneously hypertensive rats. Hypertension. 1997;30:796–802. doi: 10.1161/01.hyp.30.4.796. [DOI] [PubMed] [Google Scholar]
- Padgett LC, et al. Matrix metalloproteinase-2 and tissue inhibitor of metalloproteinase-1 in the retinal pigment epithelium and interphotoreceptor matrix: vectorial secretion and regulation. Exp Eye Res. 1997;64:927–938. doi: 10.1006/exer.1997.0287. [DOI] [PubMed] [Google Scholar]
- Reja V. Upregulation of angiotensin AT1 receptor and intracellular kinase gene expression in hypertensive rats. Clin Exp Pharmacol Physiol. 2006;33:690–695. doi: 10.1111/j.1440-1681.2006.04420.x. [DOI] [PubMed] [Google Scholar]
- Ruiz-Ortega M, et al. Molecular Mechanisms of Angiotensin II-induced Vascular Injury. Curr Hypertens Rep. 2003;5:73–79. doi: 10.1007/s11906-003-0014-0. [DOI] [PubMed] [Google Scholar]
- Ruan XR, et al. Regulation of angiotensin II receptor AT1 subtypes in renal afferent arterioles during chronic changes in sodium diet. J Clin Invst. 1997;99:1072–1081. doi: 10.1172/JCI119235. [DOI] [PMC free article] [PubMed] [Google Scholar]
- Sangaleti CT, et al. Endogenous angiotensin and pressure modulate brain angiotensinogen and AT1A mRNA expression. Hypertension. 2004;43:317–323. doi: 10.1161/01.HYP.0000112030.79692.21. [DOI] [PubMed] [Google Scholar]
- Sato T, et al. Quantitative receptor autoradiographic analysis for angiotensin II receptors in bovine retinal microvessels: Quantitation with radioluminography. Cell Mol Neurobiol. 1993;13:233–245. doi: 10.1007/BF00733752. [DOI] [PMC free article] [PubMed] [Google Scholar]
- Savaskan E, et al. Immunohistochemical localization of angiotensin-converting enzyme, angiotensin II and AT1 receptor in human ocular tissues. Ophthalmic Res. 2004;36:312–320. doi: 10.1159/000081633. [DOI] [PubMed] [Google Scholar]
- Senanayake P, et al. Angiotensin II and Its Receptor Subtypes in the Human Retina. Invest Ophthalmol Vis Sci. 2007;48:3301–3311. doi: 10.1167/iovs.06-1024. [DOI] [PubMed] [Google Scholar]
- Shariat-Madar Z, et al. Bradykinin B2 receptor knockout mice are protected from thrombosis by increased nitric oxide and prostacyclin. Blood. 2006;108:192–199. doi: 10.1182/blood-2006-01-0094. [DOI] [PMC free article] [PubMed] [Google Scholar]
- Taylor WR. Hypertensive vascular disease and inflammation: mechanical and humoral mechanisms. Curr Hypertens Rep. 1999;1:96–101. doi: 10.1007/s11906-999-0079-5. [DOI] [PubMed] [Google Scholar]
- Uchiyama-Tanaka Y, et al. Angiotensin II signaling and HB-EGF shedding via metalloproteinase in glomerular mesangial cells. Kidney Int. 2001;60:2153–2163. doi: 10.1046/j.1523-1755.2001.00067.x. [DOI] [PubMed] [Google Scholar]
- von Thun AM, et al. Augmentation of intrarenal angiotensin II levels by chronic angiotensin II infusion. Am J Physiol Renal Fluid Electrolyte Physiol. 1994;266:120–128. doi: 10.1152/ajprenal.1994.266.1.F120. [DOI] [PubMed] [Google Scholar]
- Wagner J, et al. Demonstration of renin mRNA, angiotensinogen mRNA, and angiotensin converting enzyme mRNA expression in the human eye: evidence for an intraocular renin-angiotensin system. Br J Ophthalmol. 1996;80:159–163. doi: 10.1136/bjo.80.2.159. [DOI] [PMC free article] [PubMed] [Google Scholar]
- Wang M, et al. Angiotensin II activates matrix metalloproteinase type II and mimics age-associated carotid arterial remodeling in young rats. Am J Pathol. 2005;167:1429–1442. doi: 10.1016/S0002-9440(10)61229-1. [DOI] [PMC free article] [PubMed] [Google Scholar]
- Wang D, et al. Atorvastatin inhibits angiotensin II-induced T-type Ca2+ channel expression in endothelial cells. Biochem Biophys Res Commun. 2006;347:394–400. doi: 10.1016/j.bbrc.2006.06.084. [DOI] [PubMed] [Google Scholar]
- Wheeler-Schilling TH, et al. Angiotensin II receptor subtype gene expression and cellular localization in the retina and non-neuronal ocular tissues of the rat. Eur J Neurosci. 1999;11:3387–3394. doi: 10.1046/j.1460-9568.1999.00787.x. [DOI] [PubMed] [Google Scholar]
- Zhang SL, et al. Angiotensin II Increases Pax-2 Expression in Fetal Kidney Cells Via the AT2 Receptor. J Am Soc Nephrol. 2004;15:1452–1465. doi: 10.1097/01.asn.0000130567.76794.58. [DOI] [PubMed] [Google Scholar]
- Zhou J, et al. AT1 Receptor Blockade Regulates the Local Angiotensin II System in Cerebral Microvessels From Spontaneously Hypertensive Rats. Stroke. 2006;37:1271–1276. doi: 10.1161/01.STR.0000217404.64352.d7. [DOI] [PubMed] [Google Scholar]
- Zhuo JL, et al. Intracellular Ang II induces cytosolic Ca 2+ mobilization by stimulating intracellular AT1 receptors in proximal tubule cells. Am J Renal Physiol. 2006;290:F1382–F1390. doi: 10.1152/ajprenal.00269.2005. [DOI] [PMC free article] [PubMed] [Google Scholar]
- Zou L, et al. Renal uptake of circulating Angiotensin II in Val5-Angiotensin II insused rats is mediated by AT1-receptor. Am J Hypertension. 1998;11:570–178. doi: 10.1016/s0895-7061(97)00410-x. [DOI] [PubMed] [Google Scholar]
- Zou L, et al. Receptor-mediated intrarenal Ang II augmentation in Ang II-infused hypertensive rats. Hypertension. 2006;28:669–677. doi: 10.1161/01.hyp.28.4.669. [DOI] [PubMed] [Google Scholar]