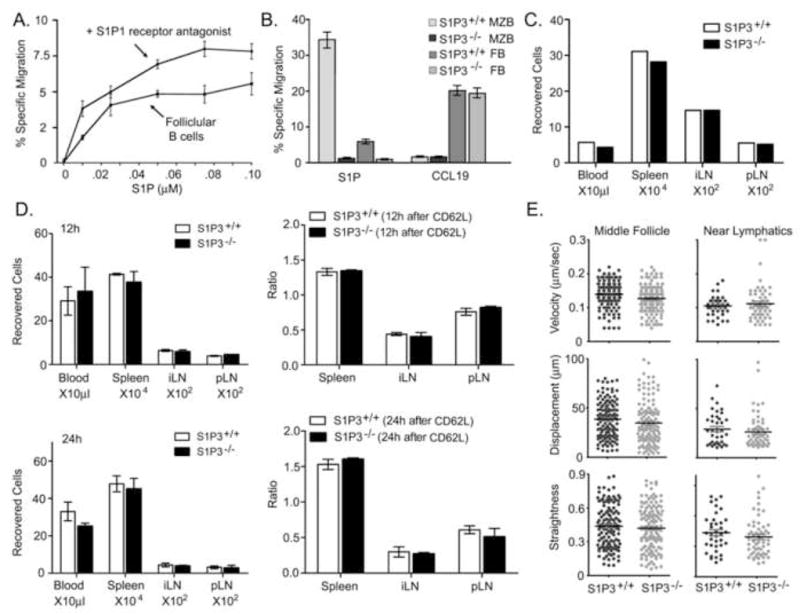
Figure 7.

B lymphocyte lymph node egress does not depend upon S1P mediated chemotaxis. (A). Blocking S1P1 does not inhibit S1P triggered chemotaxis. Chemotaxis of follicular B cells (FB, B220+, CD21 moderate, CD23+) to increasing concentrations of S1P in the presence or absence of VPC23019 (0.5 μM). Data representative of one of 4 experiments performed and is presented as specific migration. (B) S1P3 mediates marginal zone and follicular B cell chemotaxis to S1P. Specific migration of follicular and marginal zone (MZ, B220+, CD21 high, CD23−) B cells from wild type and S1P3−/− mice to S1P (0.05 μM) and CCL19 (100 ng/ml). Representative of one of three experiments preformed. (C) Homing assay. Equal numbers of labeled wild type and S1P3−/− mice B cells were intravenously transferred to recipient mice (2 experiments each with 3 pairs of mice). Two hours after transfer, cells from blood, spleen, inguinal lymph nodes, and popliteal lymph nodes of recipient mice were analyzed using flow cytometer. Shown are the actual number of transferred B cells found in blood, spleen, and lymph nodes. (D) Lymph node transit assay. Ten million labeled wild type cells and the same number of labeled S1P3−/− B cells were intravenously transferred to recipient mice (2 experiments each with 6 pairs of mice). CD62L antibody (100 μg/mouse) was injected intravenously 2 hours after cell transfer to 4 pairs of mice. 2 matched pairs of mice were injected with PBS and the numbers of recovered cells measured. 12 hours (2 pairs) and 24 hours (2 pairs) after antibody injection the cells were also recovered from the indicated sites. The ratios between the cells recovered 12 hours after antibody, 24 hours after antibody, and prior to antibody treatment are shown in the right panels. (E) Motility parameters. Adoptively transferred labeled wild type and S1P3−/− B cells were imaged by TP-LSM intravitally and tracked over 30 minutes in either the middle of the lymph node follicle or in the region of LYVE-1 positive lymphatics of the inguinal lymph node. Average velocity, displacement, and relative straightness of the tracks are plotted for individual cells. Representative of one of three experiments performed.
