

Summary
Effective dendritic cell (DC) function depends on sufficient expression of antigen and costimulatory molecules, and secretion of interleukin (IL)-12. We sought to augment DC stimulatory capacity by optimizing DC phenotype and IL-12 production. DCs, obtained by CD14-selection, were matured using 8 different cytokine cocktails, and expression of costimulatory/major histocompatibility complex molecules and IL-12 production at the end of maturation was assessed. DC stimulatory capacity was determined after pulsing with immunogenic adenoviral CD8+ peptide epitopes or after transduction with an Ad5f35-null vector. Resultant T-cell cultures were analyzed using pentamer and interferon-γ enzyme-linked immunosorbent spot assays. On the basis of DC expression of maturation markers and IL-12 production, we defined prototype “minimal” [tumor necrosis factor-α (TNF-α), prostaglandin E2], “standard” (IL-1, IL-6, TNF-α, prostaglandin E2), and “optimal” (IL-1, IL-6, TNF-α, interferon-α, CD40 ligand) DC cocktails. Optimal DCs were functionally superior when pulsed with CD8+ peptides, but when transduced with Ad5f35, functioned poorly as antigen-presenting cells. We investigated the mechanisms underlying this discrepancy and suggest that prolonged stimulation with potent cytokines (optimal cocktail) in combination with adenoviral transduction alters the kinetics of DC maturation such that the DCs are functionally exhausted by the traditional 48-hour maturation time point. Shortening the DC maturation period posttransduction restored optimal DC stimulatory capacity. Thus, maturation stimuli and viral transduction affects DC phenotype, IL-12 producing capacity, and kinetics of maturation, and all must be considered before designing protocols to generate the optimal DC for cytotoxic T lymphocyte generation.
Keywords: dendritic cell, IL-12, CTL, adenovirus, maturation cocktail
The generation of polyclonal, antigen-specific TH1-polarized CD4+ and CD8+ cytotoxic T lymphocyte (CTL) lines in vitro is crucial to the success of adoptive immunotherapy protocols and is dependent on multiple factors, most important being the stimulatory capacity of antigen-presenting cells (APCs) and the source of antigen used to activate the T cells. Dendritic cells (DCs) are the most potent APC,1 and are widely used to activate and expand CTL in vitro.2,3 Effective induction of a TH1/CTL immune response depends on the ability of DC; (i) to express sufficient antigen-derived peptide epitopes in the context of major histocompatibility complex molecules, (ii) to provide costimulation via B-7 family molecules, and (iii) to secrete interleukin (IL)-12 that polarizes the responding T cells to a TH1 phenotype.1,4,5 To achieve this, the maturation cocktail and an effective source of antigen are crucial components. An effective maturation cocktail containing IL-1, IL-6, tumor necrosis factor-α (TNF-α), prostaglandin E2 (PGE2), first described by Jonuleit and colleagues6 in 1997, has been used as a gold standard by many groups. More recently, the addition of interferon-α (IFN-α), CD40 ligand (CD40L), and/or toll-like receptor ligands have been shown to further enhance DC maturation, augment IL-12 production, and polarize responders to a TH1 phenotype.7,8 In addition, transduction of DCs with viral vectors may up-regulate costimulatory molecules on DCs and, in the case of adenoviral and lentiviral vectors, increase secretion of TH1 and proinflammatory cytokines.9
Our group has used monocyte-derived DCs transduced with a chimeric adenoviral vector (Ad5f35) encoding the Epstein-Barr virus (EBV) latent membrane protein (LMP)2 antigen to reactivate and expand LMP2-specific CTL in our Good Manufacturing Practices laboratory for adoptive transfer to patients with EBV+ Hodgkin disease.2,10 However, in about 35% of Hodgkin patients, we failed to reactivate LMP2-specific T cells.10 We hypothesized that this might result from suboptimal DC maturation owing to known defects in monocytes of Hodgkin patients11 and these defects might be overcome by identifying a more potent cytokine combination to induce DC maturation.
To identify the optimal cytokine combination, we tested 8 distinct maturation cocktails containing combinations of the maturation cytokines—IL-1, IL-6, TNF-α, PGE2, IFN-α, and CD40L. We categorized mature DC on the basis of their expression of costimulatory molecules and IL-12 production after 48 hours of maturation. We then tested the ability of these DC to induce T-cell responses to previously described immunogenic adenoviral CD8+ peptides and whole adenovirus antigen in the form of an immunogenic Ad5f35-null vector.12 The cytokine combination that most potently induced phenotypic maturation and IL-12 secretion contained IL-1, IL-6, TNF-α, IFN-α, and CD40L. These DCs were also functionally superior when pulsed with immunogenic CD8+ T-cell peptides and used to stimulate memory CTL responses. However, when Ad5f35-transduced DCs were used to stimulate a CTL response, optimal DC functioned poorly compared with DC matured with less potent cocktails. We investigate the mechanisms underlying this discrepancy and suggest that excessive stimulation can lead to rapid DC exhaustion in vitro.
Methods
Blood Donors and DC Generation
Blood was obtained from human leukocyte antigen (HLA)-typed healthy donors, after informed consent on a Baylor College of Medicine IRB-approved protocol. Peripheral blood mononuclear cells (PBMCs) were purified by Ficoll (Lymphoprep, Nycomed, Oslo, Norway) gradient separation, and DCs were generated as previously described.13 Briefly, monocytes were positively selected using CD14 microbeads and MACS selection columns (Miltenyi Biotech, Germany) per manufacturers' instructions, and incubated for 5 days in Cellgenix medium (CellGenix, Antioch, IL) containing 2mM of L-glutamine (GlutaMAX, Invitrogen, Carlsbad, CA) with granulocyte macrophage colony-stimulating factor (1000 U/mL) (Sargramostim Leukine, Immunex Corp, Seattle, WA) and IL-4 (800 U/mL) (R&D Systems, Minneapolis, MN) at 1 × 10⁶ cells/well in a 24-well plate. On day 5, immature DCs were matured using different cytokine combinations, including IL-1β (10 ng/mL), IL-6 (100 ng/mL), TNF-α (10 ng/mL) (all R&D Systems, Minneapolis, MN), PGE2 (1 μg/mL) (Sigma, St Louis, MO), CD40L with enhancer (1 μg/mL), (Axxora, San Diego, CA), and IFN-α (3000 μ/mL) (PBL InterferonSource, Piscataway, NJ) with IL-4 (800 U/mL) and granulocyte macrophage colony-stimulating factor (1000 U/mL) for 48 hours.
IL-12p70 Enzyme-linked Immunosorbent Assay
IL-12p70 was measured by enzyme-linked immunosorbent assay (ELISA) performed according to the manufacturers' instructions (human IL-12 Quantikine ELISA kit D1200, R&D Systems, Minneapolis, MN).
Loading DC With Antigen
Adenoviral peptides were obtained from Genemed Synthesis Inc (South San Francisco, CA) and reconstituted at 10 mg/mL in dimethyl sulfoxide. The CD8+ peptides used were HLA-A1-TDLGQNLLY (TDL) and HLA-A24-TYFSLNNKF (TYF).12 Mature DCs were incubated with 200 μL of diluted peptide (final concentration of 1 μg/mL) for 60 minutes at 37°C, washed, and incubated with responder PBMC as indicated.
The Ad5f35-null vector (which does not express a transgene) was purchased from the Vector Development Laboratory of the Center for Cell and Gene Therapy. On day 5, immature DC were transduced with Ad5f35-null for 90 minutes at 37°C at a multiplicity of infection of 200 virus particles/DC.12 The DCs were then incubated with maturation cocktails as indicated.
Activation and Expansion of Antigen-specific CTL
We used peptide-pulsed DCs or Ad5f35-transduced DCs as APCs. Responders were CD14-depleted PBMCs or CD8+ T cells isolated using MACS selection. The stimulator to responder ratio (S:R) was 1:20. CTL cultures were maintained in 45% RPMI 1640, 45% Clicks (EHAA; Irvine Scientific, Santa Anna, CA), 2mM GlutaMAX-1, 5% human AB serum (Valley Biomed), referred to hereafter as CTL media. CTL were analyzed on day 9 postset-up for absolute expansion using trypan blue exclusion, and for antigen specificity by pentamer and enzyme-linked immunosorbent spot (ELISPOT).
Phenotype by Flow Cytometry
For all flow cytometric analyses, a FACsCalibur instrument (BD) and CellQuest software (BD) were used. Antibodies were purchased from BD. Isotype controls for antibody staining were immunoglobulin G1-phycoerythrin (IgG1-PE), IgG1-peridinin chlorophyll protein (IgG1-PerCP), and IgG1-fluorescein isothiocyanate (IgG1-FITC). Cells were washed once using phosphate-buffered saline with 2% fetal bovine serum and 0.1% sodium azide, pelleted, and antibodies were added in saturating amounts (5 μL). The antibodies used for surface staining of DCs were CD80-PE, CD83-PE, CD86-FITC, HLA-DR-PerCP, and HLA-ABC-FITC. After 30 minutes of incubation at 4°C in the dark, cells were washed twice, fixed, and analyzed. 1 × 10⁴-1 × 10⁵ events were acquired.
To detect peptide-specific CTL, we used the soluble HLA-A1-TDL and/or HLA-A24-TYF unlabeled pentamers, prepared by Proimmune Inc (Oxford, UK). We stained CTLs (5 × 10⁵) with multimers as previously described.14 Briefly, we incubated CTL with unlabeled pentamer followed by Pro5 Flurotag (PE) (Proimmune Inc) according to the manufacturers' instructions. After incubation for 30 minutes at 4°C in the dark, we washed the cells twice, and then fixed and analyzed them. For each sample, we acquired 1 × 10⁵ events.
ELISPOT Assay
ELISPOT assays were performed as previously published.15 A multiscreen 96-well plate (Millipore, Bedford, MA) was coated with “capture” antibody against IFN-γ overnight at 4°C. The wells were washed, and then blocked with CTL media. Cells were stimulated with peptide or irradiated Ad5f35-transduced monocytes plated at 1 × 10⁵ cells in 100 μL of CTL media per well.14 CTL were added at dilutions from 1 × 10⁵ to 1.25 × 10⁴/100 μL. Negative controls included CTL cocultured with nontransduced irradiated PBMC, CTL alone, and stimulators alone. All wells were set-up in duplicate. Plates were evaluated by Zellnet Consulting. Spot-forming cells (SFC) and input cell numbers were plotted.
Statistical Analysis
IL-12 levels based on ELISA and antigen-specific T cells based on pentamer percents were summarized using means ± SD as represented in the figures. Pairwise comparisons of IL-12 levels between minimal versus standard, minimal versus optimal, and standard versus optimal were performed using paired test methodologies such as the paired t test or Wilcoxon signed ranks test. Pentamer percents were compared using a linear model, which accounts for repeat measurements across the 3 types of cytokine cocktails. Contrasts were generated from the model to perform paired comparison between 2 types of cytokine cocktails. Comparison of IL-12 and percent pentamer levels between time periods as shown in Figures 6 and 7 were likewise performed using the paired t test.
Figure 6.
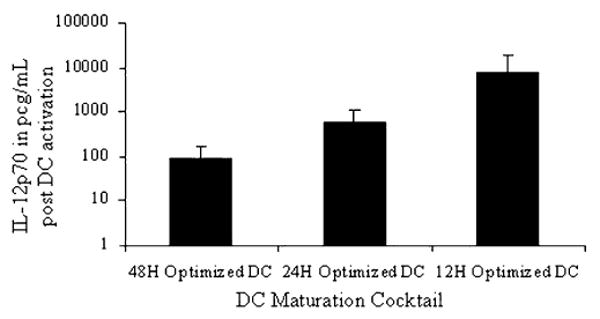
Ad5f35-null vector transduced optimal DCs are increasingly refractory to T-cell stimulation with increasing time postmaturation. DCs were incubated with GM-CSF and IL-4 for 5 days, and then Ad5f35 transduced and matured with the optimal cocktail cytokines- IL-1, IL-6, TNF-α, IFN-α, and CD40L for 12, 24, and 48 hours. At the end of each maturation time period, the DCs were harvested, washed, resuspended in CTL medium and stimulated with CD40L (1 μg/mL) and IFN-γ (1000 IU/mL) for 24 hours at the end of which supernatant was collected for IL-12 measurement. The results are shown as mean IL-12p70 produced from 3/3 donors tested and are represented as IL-12p70 in pg/mL/1 × 106 DCs ± SD.
Figure 7.
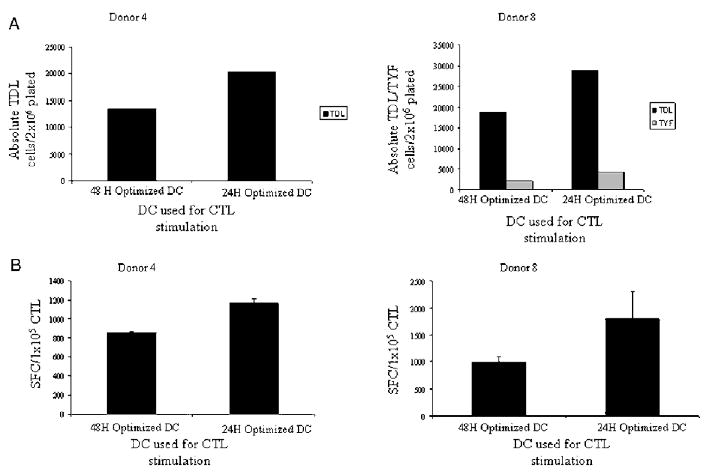
DCs transduced with Ad5f35 and matured using optimal cocktail are exhausted at the end of 48 hours of maturation. DC matured using the prototype optimal cocktail (IL-1, IL-6, TNF-α, IFN-α, CD40L) for either 24 or 48 hours were used to stimulate autologous CD4+/CD8+ responder cells at a 1:20 stimulator to responder ratio. A, Expansion of TDL and TYF specific T cells were determined using the absolute T-cell numbers, CD8+ percent in CTL and pentamer percentages. B, IFN-γ production by CTL in response to irradiated Ad5f35-transduced stimulators was determined in an IFN-γ ELISPOT assay and is presented as SFC/1 × 10e5 CTL (subtracted from control). The results shown are for donors 4 and 8. Results with a similar trend were obtained for 3/3 donors tested.
Results
DC Phenotype Depends on Cytokine Cocktail Used for Maturation
We compared different combinations of IL-1, IL-6, TNF-α, PGE2, IFN-α and soluble CD40L for their ability to induce DC maturation (Table 1). Immature and mature DCs were analyzed on days 5 and 7, respectively, using the maturation markers CD80, CD86, CD83, HLA-ABC, and HLA-DR.
Table 1.
DC Phenotype Varies With Maturation Cocktail
| Cytokine Cocktails | CD80/86 | CD83 | HLA-ABC/DR | N | Phenotype |
|---|---|---|---|---|---|
| TNF-α, PGE2 | 56 ± 4 | 40 ± 2 | 55 ± 17 | 3 | Minimal |
| TNF-α, CD40L | 69 ± 1 | 62 ± 4 | 80 ± 4 | 2 | Standard |
| IFN-α, TNF-α | 98 ± 1 | 59 ± 8 | 84 ± 9 | 3 | Standard |
| IL-1, IL-6, TNF-α, PGE2 | 80 ± 12 | 65 ± 8 | 76 ± 12 | 3 | Standard |
| IFN-α, CD40L | 97 ± 1 | 82 ± 10 | 93 ± 4 | 5 | Optimal |
| IFN-α, TNF-α, CD40L | 97 ± 1 | 86 ± 4 | 95 ± 4 | 5 | Optimal |
| IL1, 6, TNF-α, IFN-α, CD40L | 97 ± 2 | 90 ± 6 | 98 ± 1 | 4 | Optimal |
| IL1, 6, TNF-α, IFN-α, PGE2, CD40L | 98 ± 2 | 90 ± 9 | 96 ± 4 | 4 | Optimal |
DCs, matured using the cytokines indicated, were analyzed by flow cytometry for expression of maturation markers. The results are represented as mean percentage of DC expressing the maturation markers ± SD. On the basis of CD83 expression, DC phenotype achieved using different maturation cytokine cocktails was classified as minimal, standard, and optimal.
On the basis of the up-regulation of maturation markers and costimulatory molecules, we categorized the cytokine cocktails into 3 classes: cocktails that induced (a) “minimal,” (b) “standard,” and (c) “optimal” DC maturation (Table 1). DC maturation was defined as minimal when CD83 expression was <50% (range, 35% to 45%), as standard when CD83 expression was between 50% and 75%, and as optimal when CD83 expression was >70% (range, 72% to 96%). Representative examples of DCs matured with the minimal (TNF-α and PGE2),2 standard (IL-1, IL-6, TNF-α, and PGE2),6 and optimal (IL-1, IL-6, TNF-α, IFN-α, and CD40L) cocktails are shown in Figure 1. These cocktails were used as prototypes for each group in subsequent experiments.
Figure 1.
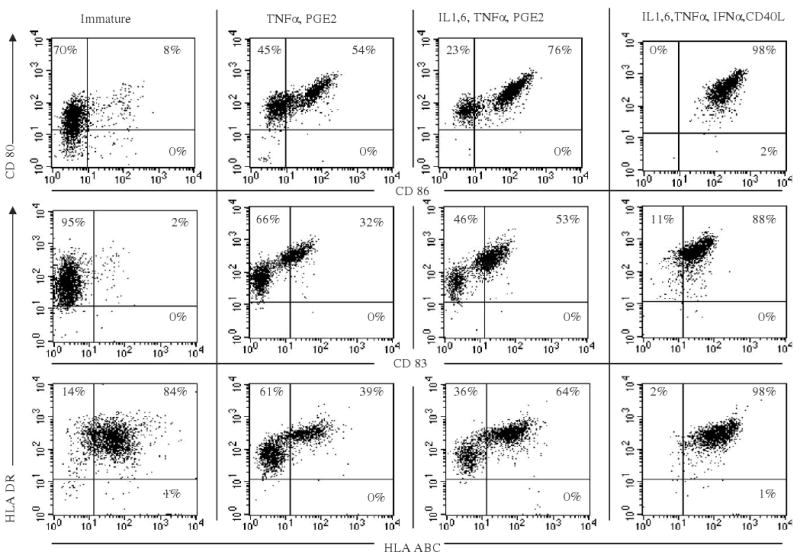
DC phenotype depends on maturation cocktail. DCs were incubated with granulocyte macrophage colony-stimulating factor (GM-CSF) and IL-4 for 5 days, and then matured with 1 of 3 different cytokine combinations: (i) TNF-α, PGE2 (minimal); (ii) IL-1, 6, TNF-α, and PGE2 (standard); and (iii) IL-1, IL-6, TNF-α, IFN-α, CD40L (optimal) for 2 days (A). At the end of 48 hours of maturation, DCs were analyzed by flow cytometry for expression of maturation markers, shown as dot plots. The results shown are for donor 1; similar results were obtained in 3/3 different donors.
Optimal DCs Produce the Highest Levels of IL-12
IL-12 is a heterodimeric cytokine of 70 kd comprising covalently linked p40 and p35 subunits.16 It is predominantly produced by DCs, monocytes, and macrophages and is crucial for polarizing responding T cells to an IFN-γ–producing TH1 phenotype.17,18 Hence, we measured secretion of the active form of IL-12, IL-12p70, in supernatants of differentially matured DCs. The concentration of IL-12 was highly donor-dependent, perhaps owing to IL-12 promoter polymorphisms in the population.19 However, in every donor tested, IL-12, produced by DCs matured using the minimal cocktail, was significantly less than standard DCs (P = 0.0156), which in turn was significantly less than optimal DCs (minimal vs. optimal; P = 0.001; standard vs. optimal; P = 0.001). Results are shown as mean IL-12p70 produced (n = 8), expressed as picograms of IL-12/106 DC/mL (Fig. 2). The range of IL-12 was between 0 and 7.5 × 10³ pg/106 DC/mL for minimal DCs, between 0 and 4 × 10⁴ pg/106 DC/mL for standard DCs, and between 36 and 1 × 10⁸ pg/106 DC/mL for optimal DCs.
Figure 2.
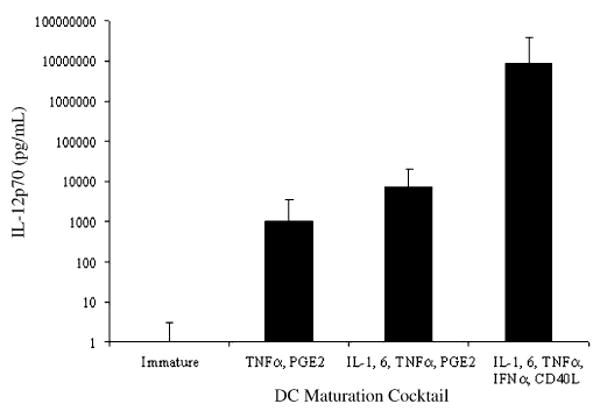
DC maturation cocktail affects IL-12p70 production. DCs were incubated with GM-CSF and IL-4 for 5 days, and then matured with 3 different cytokine combinations: (i) TNF-α, PGE2; (ii) IL-1, IL-6, TNF-α, and PGE2; and (iii) IL-1, IL-6, TNF-α, IFN-α, and CD40L for 48 hours. At the end of 48 hours, DC supernatant was collected for the measurement of IL-12p70 by ELISA. The results are shown as mean IL-12p70 in pg/mL/1 × 106 DC ± SD averaged from results of all 8/8 different donors tested.
CTL Generation Using Peptide-pulsed DC as APC
We next tested the ability of DCs matured with the minimal, standard, and optimal cocktails to reactivate antigen-specific memory T-cell responses in vitro. We used CD8+ epitope peptides from adenovirus type 5 hexon protein as a source of antigen.12 Peptide-pulsed optimal DCs promoted the most proliferation (n = 4 donors; range, 1.4 to 1.9-fold expansion) compared with T cells stimulated with standard (range, 1.1 to 1.5-fold) or minimal DCs (range, 0.8 to 1.2-fold). The optimal cocktail also reactivated significantly more antigen-specific T cells as measured by pentamer (minimal vs. optimal; P = 0.034, standard vs. optimal; P = 0.037) and IFN-γ ELISPOT in 4/4 donors tested (Tables 2A, B). Representative pentamer analysis from donor 2 who reacted against the HLA-A24 TYF peptide is shown in Figure 3A. DC matured with the minimal, standard, and optimal cocktails reactivated 1.17%, 1.68%, and 7.76% CD8+ TYF+ cells, respectively. Similarly, the absolute number of pentamer-specific T cells was greatest for the optimal cocktail as compared with the standard and minimal cocktails (Fig. 3B). The TDL and TYF-specific cells were functional and produced IFN-γ in response to cognate peptide stimulation measured by IFN-γ ELISPOT assay; T cells from donor 2 produced 200 SFC/1 × 105 T cells, 300 SFC/1 × 105 T cells, and 1433 SFC/1 × 105 T cells in response to minimal, standard, or optimal DCs, respectively (Fig. 3C).
Table 2.
DC Matured Using Optimal Cocktail Generate the Best Peptide-specific Response
| Donor | TNF-α, PGE2 | IL-1, IL-6, TNF-α, PGE2 | IL-1, IL-6, TNF-α, IFN-α, CD40L |
|---|---|---|---|
| A. CD8+ pentamer+results | |||
| Donor 2 (TYF) | 1.17% | 1.68% | 7.76% |
| Donor 3 (TDL) | 2.58% | 9.10% | 16.58% |
| Donor 3 (TYF) | 2.12% | 4.54% | 16.17% |
| Donor 4 (TDL) | 0.21% | 0.40% | 3.70% |
| Donor 6 (TYF) | 0.15% | 1.80% | 2.30% |
| B. The number of IFN-γ producing cells on an ELISPOT assay in response to relevant adenoviral peptide (subtracted from control peptide results) is shown as SFC/1 × 105 CTL ± SD | |||
| Donor 2 (TYF) | 200 ± 20 | 300 ± 32 | 1433 ± 150 |
| Donor 3 (TDL, TYF) | 20 ± 5 | 32 ± 4 | 150 ± 7 |
| Donor 4 (TDL) | 165 ± 8 | 500 ± 25 | 800 ± 33 |
| Donor 6 (TYF) | 60 ± 4 | 70 ± 8 | 228 ±15 |
DC matured using the 3 prototype maturation cocktails: (i) TNF-α, PGE2—minimal, (ii) IL-1, IL-6, TNF-α, PGE2—standard, and (iii) IL-1, IL-6, TNF-α, IFN-α, CD40L—optimal, loaded with peptide adenoviral antigen-TDL or TYF were used to stimulate autologous responder T cells in a 1:20 S:R ratio. On day 9, CTL were analyzed by flow cytometry after pentamer staining and by IFN-γ ELISPOT assay.
Figure 3.
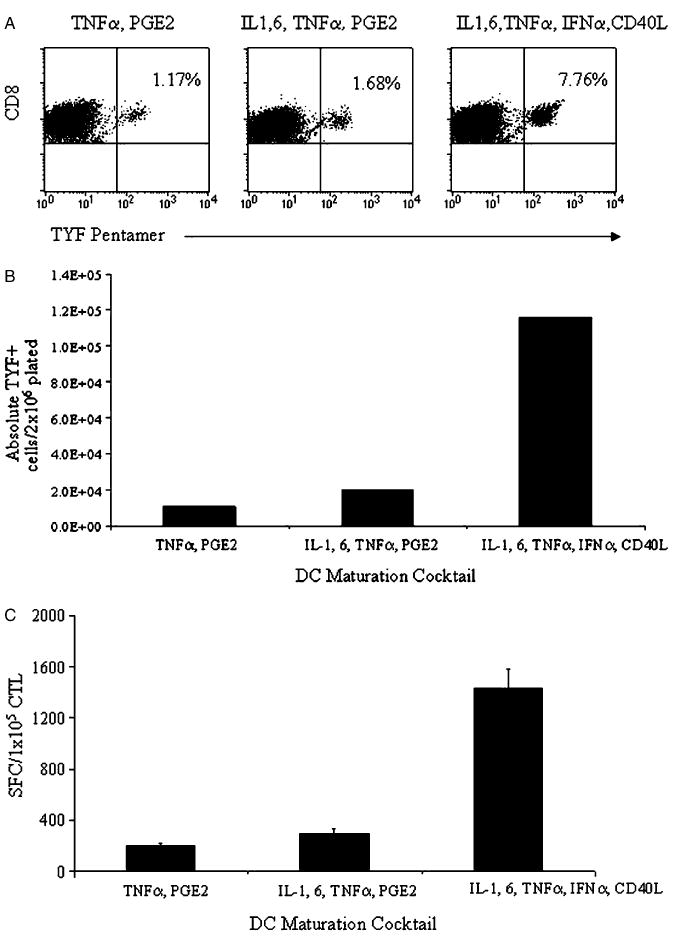
DCs matured using the optimal cocktail generate the most adenoviral peptide antigen-specific cells. DCs matured using the 3 prototype maturation cocktails: (i) TNF-α, PGE2; (ii) IL-1, IL-6, TNF-α, and PGE2; and (iii) IL-1, IL-6, TNF-α, IFN-α, and CD40L were loaded with peptide adenoviral antigen (TYF) and used to stimulate autologous peripheral blood T cells. At the end of 9 days, antigen-specific T-cell frequency and proliferation were measured. A, The frequency of antigen specific cells was determined using pentamer staining for the relevant peptide (TYF). The results are expressed as percent TYF-pentamer+ CD8+ cells. B, Absolute numbers of TYF-specific cells were quantitated using absolute CTL proliferation, CD8%, and pentamer %. C, IFN-γ production by the CTL in response to cognate TYF peptide was determined in an IFN-γ ELISPOT and is presented as SFC/1 × 105 CTL (subtracted from irrelevant control). The results shown are for donor 2.
CTL Generation Using Ad5f35-null–transduced DC as APC
As whole protein allows the reactivation of both CD4+ and CD8+ T cells specific for multiple epitopes regardless of HLA type, we tested the ability of the differentially matured DC to generate a polyclonal response to adenovirus hexon protein using chimeric Ad5f35-null vector as a source of antigen.12 Using Ad5f35-transduced DCs as APCs, we uniformly found that the standard DCs induced better CTL proliferation (range, 2 to 2.4-fold expansion) than the minimal (range, 1.3 to 1.5-fold) or the optimal DCs (range, 1.7 to 1.8-fold) (n = 4 donors). Similarly, the standard cocktail stimulated significantly more pentamer+ cells than the optimal cocktail (P = 0.032) inducing the greatest number of IFN-γ–producing CD4+/CD8+ antigen-specific cells in all 5 donors tested (Tables 3A, B). In the representative donor shown, the minimal, standard, and optimal cocktails reactivated 4.3%, 4.4%, and 1.8% of TDL-specific CD8+ T cells and 0.5%, 1.3%, and 0.01% of TYF-specific CD8+ T cells, respectively (Fig. 4A). The absolute number of antigen-specific cells reactivated was also greatest in CTL stimulated using the standard cocktail (Fig. 4B). ELISPOT analysis using differentially matured Ad5f35-transduced DC as stimulators showed the same trend; standard DCs reactivated the greatest number of IFN-γ–producing T cells (218 SFC/1 × 105 CTL), followed by the minimal DC (131 SFC/1 × 105 CTL), whereas the optimal DC (71 SFC/1 × 105 CTL) were much less effective (Fig. 4C). This paradox could be explained by competitive proliferation of adenovirus-specific CD4+ T cells coactivated by the Ad5f35 vector, but not by the CD8+ peptides, or from direct effects of the Ad5f35 vector on the DCs.
Table 3.
Standard Ad5f35-transduced DC Generate the Most Adenovirus-specific Cells
| Donor | TNF-α, PGE2 | IL-1, IL-6, TNF-α, PGE2 | IL-1, IL-6, TNF-α, IFN-α, CD40L |
|---|---|---|---|
| A. The pentamer+ CD8+ at the end of the stimulation | |||
| Donor 3 (TDL) | 4.30% | 4.40% | 1.80% |
| Donor 3 (TYF) | 0.50% | 1.30% | 0.01% |
| Donor 4 (TDL) | 3.87% | 9.25% | 7.49% |
| Donor 5 (TDL) | 6.16% | 17.9% | 10.50% |
| Donor 6 (TYF) | 0.25% | 0.70% | 0.30% |
| Donor 7 (TDL) | 3.10% | 6.30% | 1.50% |
| Donor 7 (TYF) | 2.80% | 0.80% | 0.60% |
| B. ELISPOT results using Ad5f35-transduced stimulators as APCs | |||
| Donor 3 | 131 ± 22 | 218 ± 13 | 71 ± 23 |
| Donor 4 | 236 ± 12 | 371 ± 30 | 281 ± 17 |
| Donor 6 | 972 ± 55 | 2226 ± 90 | 842 ± 60 |
| Donor 7 | 576 ± 44 | 705 ± 35 | 342 ± 27 |
Ad5f35-transduced matured using the 3 prototype maturation cocktails: (i) minimal, (ii) standard, and (iii) optimal were used to stimulate autologous responder T cells in a 1:20 S:R ratio. Pentamer results are expressed as percent pentamer+ cells of all CD8+ cells. ELISPOT results are shown as SFC/1 × 105 CTL (subtracted from irrelevant control) ± SD.
Figure 4.

DCs transduced with Ad5f35-null vector and matured using the standard cocktail generate the most adenovirus antigen-specific cells. DCs transduced with Ad5f35 were matured using the 3 prototype maturation cocktails: (i) TNF-α, PGE2; (ii) IL-1, IL-6, TNF-α, and PGE2; and (iii) IL-1, IL-6, TNF-α, IFN-α, and CD40L were used to stimulate autologous responder T cells at a stimulator to responder ratio of 1:20. Proliferation of antigen-specific T cells was determined after 9 days. A, The frequency of CD8+ TDL and TYF-specific cells was determined using pentamer staining. The results are expressed as percent CD8+ pentamer+ cells. B, Absolute numbers of TDL and TYF specific cells were determined using the absolute CTL proliferation and pentamer percentages. C, IFN-γ production in response to irradiated Ad5f35-transduced stimulators using an IFN-γ ELISPOT assay is presented as SFC/1 × 105 CTL (subtracted from control). The results shown are for donor 3.
Delineating Why Phenotypically Optimal Ad5f35-transduced DC are Suboptimal
Investigating the Role of CD4+ T Cells in CTL Cultures
Adenovirus vector-transduced DCs process and present virion proteins and reactivate both CD4+ and CD8+ cells,12 whereas DCs presenting CD8+ epitopes reactivate only CD8+ T cells. CD40-CD40L signaling by CD4+ T cells provides an additional stimulus to DCs and improves their stimulatory capacity (“DC licensing”).20 Thus, Ad5f35-transduced, standard DCs receive a single licensing event, at the time of coculture on day 7. In contrast, the optimal DCs receive 2 licensing events; one on day 5, from CD40L in the maturation cocktail, and the second from activated adenovirus-specific CD4+ T cells at the time of coculture on day 7. We hypothesized, therefore, that optimal DCs may be refractory to the second CD40 trigger provided by CD4+ cells and fail to produce IL-12 in CTL culture. Hence, we investigated whether depletion of CD4+ T cells would remove the second trigger and restore the superior stimulatory capacity of optimal DCs. To this end, we matured Ad5f35-transduced DC using the standard and optimal cocktails for 48 hours and compared their potency using either unseparated CD4+/CD8+ responder T cells or CD8 selected responder cells. In 4/4 donors, depletion of CD4+ cells did not restore the superior CTL stimulatory capacity of optimal DCs, suggesting that the inferior CTL stimulatory capacity was a result of intrinsic DC function and not an effect of the responder T cells (Table 4).
Table 4.
Inclusion of CD4+ Responder Cells Enhances Generation of Adenovirus Specific CTL
| Donor | IL-1, IL-6, TNF-α, PGE2/CD4, CD8 | IL-1, IL-6, TNF-α, IFN-α, CD40L/CD4, CD8 | IL-1, IL-6, TNF-α, PGE2/CD8 | IL-1, IL-6, TNF-α, IFN-α, CD40L/CD8 |
|---|---|---|---|---|
| Donor 3 | 1200 ± 48 | 720 ± 32 | 330 ± 10 | 140 ± 25 |
| Donor 6 | 2226 ±156 | 842 ± 78 | 360 ± 18 | 192 ± 29 |
| Donor 7 | 311 ± 35 | 227 ± 17 | 108 ± 24 | 103 ± 5 |
| Donor 8 | 705 ± 5 | 342 ± 10 | 270 ± 83 | 220 ± 19 |
Ad5f35-transduced DCs matured using the standard and the optimal cocktails were used to stimulate autologous responder T cells, which were either CD4+/CD8+ combined or CD8+ alone in a 1:20 S:R ratio. The adenovirus-specific response was measured in an IFN-γ ELISPOT assay performed using irradiated Ad5f35 transduced stimulators as APCs. Results are shown as SFC/1 × 105 CTL (subtracted from irrelevant control) ± SD for 4/4 donors tested.
In fact, frequency of pentamer+ CD8+ cells was higher in cultures containing CD4+ T cells in every DC condition, confirming a helper role for CD4+ cells. When we quantitated the number of antigen-specific CD8+ cells in donor 3, the minimal, standard, and optimal cocktails reactivated 3.1%, 6.3%, and 1.5% of TDL-specific CD8+ cells and 1.2%, 2.4%, and 1% of TYF-specific CD8+ cells, respectively, in the presence of CD4+ T cells compared with 1.2%, 2.4%, and 1% of TDL-specific CD8+ T cells and 1.6%, 1%, and 0.25% of TYF-specific cells when the responders were CD8+ cells alone (Fig. 5A). The absolute number of pentamer-specific T cells from representative donor 3 is shown in Figure 5B. ELISPOT assays measuring reactivity against Ad5f35-transduced APCs confirmed these results and representative results from donor 3 are shown in Figure 5C in which minimal, standard, and optimal DCs reactivated 576, 705, and 324 SFC/105 CD4+/CD8+ responders, and 207, 269, 221 SFC/105 CD8+ responders, respectively. By contrast, when peptide-pulsed DCs were used to stimulate either unseparated or CD8+ selected responders, there was no difference in the magnitude of the CD8+ response as measured by pentamer or ELISPOT (data not shown).20
Figure 5.

CD4+ responder cells enhance the frequency of adenoviral antigen-specific response in all DC conditions tested. DCs transduced with Ad5f35 were matured using the 3 prototype maturation cocktails: (i) TNF-α, PGE2; (ii) IL-1, IL-6, TNF-α, and PGE2; and (iii) IL-1, IL-6, TNF-α, IFN-α, and CD40L, and used to stimulate autologous responder T cells at a stimulator to responder ratio of 1:20. Responder cells were unseparated CD4+/CD8+ or CD8+ T cells alone. A, Expansion of CD8+ antigen specific cells was determined using TDL and TYF pentamer. The results are expressed as percent pentamer + cells of all CD8+. B, Absolute numbers of TDL and TYF specific cells were determined using the absolute CTL proliferation, CD8+ percentage in CTL, and pentamer percentages. C, IFN-γ production by CTL in response to irradiated Ad5f35-transduced stimulators was determined in an IFN-γ ELISPOT assay and is presented as SFC/1 × 105 CTL (subtracted from control). The results shown are for donor 3. Similar results were obtained in 4/4 donors tested.
Investigating the Effect of Adenovirus Transduction on DC Function
To investigate whether adenoviral transduction in combination with potent maturation cytokines resulted in DC exhaustion, we measured the ability of Ad5f35-transduced optimal DCs to secrete IL-12 postmaturation in the presence of CD40L and IFN-γ to mimic the DC-T-cell interaction found in CTL cultures.7 With increasing periods of maturation, optimal DCs progressively lost their ability to produce IL-12 in response to a T-cell signal, such that the amount of IL-12 produced at 12 hours was 6.5 to 7-fold higher than that produced at 24 hours (P = 0.079), and the IL-12 produced by the optimal DCs at 24 hours was 6 to 8-fold higher than that produced at 48-hour postmaturation (P = 0.001) (n = 3 donors) (Fig. 6). Thus, over time optimal Ad5f35-transduced optimal DCs become progressively refractory to T-cell stimulation, resulting in the production of less and less IL-12.
To test this hypothesis, we assessed whether optimal Ad5f35-transduced DCs had increased potency when used as APCs after 24 hours rather than 48 hours of maturation. Figures 7A and 7B show the results from 2 representative donors where the absolute number of pentamer+ cells reactivated and the T-cell response by IFN-γ ELISPOT was greater at 24-hour postmaturation (48 h vs. 24 h; P = 0.099). Similar results were obtained in all 3 donors tested. In contrast, the optimal Ad5f35-transduced DC matured for 12 hours were less effective APCs (data not shown) even though they produced the highest levels of IL-12. This was likely because of the fact that Ad5f35-transduced DCs matured for 12 hours were less phenotypically mature than those matured for 24 or 48 hours. Results from 1 representative donor (n = 3) are shown in Figure 8. Thus our results suggest that the best time for using DCs as APCs in CTL therapy protocols depends on phenotypic maturation and IL-12–producing capacity. In turn, these factors are affected by the DC maturation cocktail and other factors such as in vitro viral transduction, and all must be taken into consideration when defining the best time and cocktail for using DCs to reactivate CTL.
Figure 8.

DC phenotype achieved after Ad5f35 transduction and maturation with the optimal cocktail for 12, 24, and 48 hours. DCs were incubated with GM-CSF and IL-4 for 5 days, and then matured with the optimal; cytokine cocktail—IL-1, IL-6, TNF-α, IFN-α, CD40L for 12, 24, and 48 hours. At the end of each time period, the DCs were analyzed by flow cytometry for expression of maturation markers, shown as dot plots. The results, shown for donor 9, were similar in 3/3 different donors.
Discussion
In this series of experiments, we attempted to identify a maturation cytokine cocktail, which would induce optimal DC maturation based on phenotype and ability to produce IL-12. To this end, we compared different cytokine cocktails, which matured DC with different phenotypes based on expression of major histocompatibility complex and costimulatory molecules and IL-12 production. The prototype minimal cocktail was composed of TNF-α and PGE2; the standard cocktail contained IL-1, IL-6, TNF-α, and PGE2, but the optimal maturation was induced by cocktails containing CD40L and IFN-α in addition to IL1, IL-6, and TNF-α. We intentionally omitted PGE2 from our optimal cocktail since PGE2 has been reported to suppress T-cell proliferation,21,22 and inhibit production of IL-12.23,24 In accordance with previous reports, we found that the optimal DC, matured with a cytokine cocktail containing CD40L, produced > 1000 fold more IL-12 than the minimal or standard DCs during the 48 hours of maturation.25,26
We found that source of antigen was another crucial factor when developing an immunotherapy protocol using DCs as APCs. When peptide-pulsed DCs were used to stimulate T cells, the phenotypically optimal DCs were most potent. However, when we sought to confirm the superiority of the optimal DCs in our preferred system using whole antigen derived from adenovirus vectors,12 we found that the optimal DCs were suboptimal CTL stimulators and were outperformed by DCs matured by the less potent standard cocktail. Although the presence of adenovirus-specific CD4+ T cells clearly enhanced the production of antigen-specific CD8+ T cells, they were not responsible for the diminished potency of Ad5f35-transduced optimal DCs. Instead, our experiments suggest that the decreased potency of Ad5f35-transduced optimal DCs was due to functional exhaustion after prolonged, potent stimulation with cytokines in combination with adenoviral transduction for the 48-hour maturation period. Adenovirus vectors induce innate immune responses including the production of type 1 IFNs, IL-6, and TNF-α from monocyte-derived DC,27,28 and our experiments suggested that DC maturation with the optimal cytokine cocktail in combination with these innate signals altered the kinetics of IL-12 secretion, resulting in a potent but rapid induction of IL-12 12 to 24 hours postmaturation/transduction, which was significantly reduced by the 48-hours time point when CTL lines are initiated. Our results are in accordance with published reports showing that DCs matured using potent stimuli such as toll-like receptor agonists have altered kinetics of maturation such that they are most effective 8-hour postmaturation, but at 48 hours are unable to produce IL-12 in response to T-cell stimuli or stimulate a effective TH1-polarized response.29 However, as our results show optimal DC stimulation cannot be based solely on IL-12 production either since Ad5f35-transduced optimal DCs can be stimulated to produce the most IL-12 at 12-hour posttransduction/maturation, but are ineffective when used as CTL stimulators, likely because of low expression of costimulatory molecules. Thus, when using DCs as APCs either in vivo or in vitro, the maturation stimulus used, genetic modification, IL-12–producing capacity, and kinetics of DC maturation must be taken into consideration before designing protocols for the generation of optimal DC for the intended purpose.
Acknowledgments
The authors thank Jimenez Fernandez for technical assistance with flow cytometry.
Supported in part by a Specialized Centers for Cell-based Therapy Grant NIH-NHLBI 1 U54 HL1081007, grants from the Leukemia & Lymphoma Society SCOR No. 7018PO1, the NIH-NCI PO1 CA94234, and an award from the Dana Foundation (C.M.R. and A.M.L.). Anjum S. Kaka was supported by a NIH Training Grant 5T32AI055413-03.
Footnotes
Financial Disclosure: The authors have declared there are no financial conflicts of interest related to this work.
References
- 1.Banchereau J, Steinman RM. Dendritic cells and the control of immunity. Nature. 1998;392:245–252. doi: 10.1038/32588. [DOI] [PubMed] [Google Scholar]
- 2.Bollard CM, Straathof KC, Huls MH, et al. The generation and characterization of LMP2-specific CTLs for use as adoptive transfer from patients with relapsed EBV-positive Hodgkin disease. J Immunother (1997) 2004;27:317–327. doi: 10.1097/00002371-200407000-00008. [DOI] [PubMed] [Google Scholar]
- 3.Mackensen A, Meidenbauer N, Vogl S, et al. Phase I study of adoptive T-cell therapy using antigen-specific CD8+ T cells for the treatment of patients with metastatic melanoma. J Clin Oncol. 2006;24:5060–5069. doi: 10.1200/JCO.2006.07.1100. [DOI] [PubMed] [Google Scholar]
- 4.Banchereau J, Briere F, Caux C, et al. Immunobiology of dendritic cells. Annu Rev Immunol. 2000;18:767–811. doi: 10.1146/annurev.immunol.18.1.767. [DOI] [PubMed] [Google Scholar]
- 5.Figdor CG, de Vries IJ, Lesterhuis WJ, et al. Dendritic cell immunotherapy: mapping the way. Nat Med. 2004;10:475–480. doi: 10.1038/nm1039. [DOI] [PubMed] [Google Scholar]
- 6.Jonuleit H, Kuhn U, Muller G, et al. Pro-inflammatory cytokines and prostaglandins induce maturation of potent immunostimulatory dendritic cells under fetal calf serum-free conditions. Eur J Immunol. 1997;27:3135–3142. doi: 10.1002/eji.1830271209. [DOI] [PubMed] [Google Scholar]
- 7.Mailliard RB, Wankowicz-Kalinska A, Cai Q, et al. alpha-type-1 polarized dendritic cells: a novel immunization tool with optimized CTL-inducing activity. Cancer Res. 2004;64:5934–5937. doi: 10.1158/0008-5472.CAN-04-1261. [DOI] [PubMed] [Google Scholar]
- 8.Osada T, Nagawa H, Takahashi T, et al. Dendritic cells cultured in anti-CD40 antibody-immobilized plates elicit a highly efficient peptide-specific T-cell response. J Immunother (1997) 2002;25:176–184. doi: 10.1097/00002371-200203000-00005. [DOI] [PubMed] [Google Scholar]
- 9.Tan PH, Beutelspacher SC, Xue SA, et al. Modulation of human dendritic-cell function following transduction with viral vectors: implications for gene therapy. Blood. 2005;105:3824–3832. doi: 10.1182/blood-2004-10-3880. [DOI] [PubMed] [Google Scholar]
- 10.Bollard CM, Gottschalk S, Leen AM, et al. Complete responses of relapsed lymphoma following genetic modification of tumor-antigen presenting cells and T-lymphocyte transfer. Blood. 2007;110:2838–2845. doi: 10.1182/blood-2007-05-091280. [DOI] [PMC free article] [PubMed] [Google Scholar]
- 11.Estevez ME, Ballart IJ, de Macedo MP, et al. Dysfunction of monocytes in Hodgkin's disease by excessive production of PGE-2 in long-term remission patients. Cancer. 1988;62:2128–2133. doi: 10.1002/1097-0142(19881115)62:10<2128::aid-cncr2820621011>3.0.co;2-q. [DOI] [PubMed] [Google Scholar]
- 12.Leen AM, Sili U, Savoldo B, et al. Fiber-modified adenoviruses generate subgroup cross-reactive, adenovirus-specific cytotoxic T lymphocytes for therapeutic applications. Blood. 2004;103:1011–1019. doi: 10.1182/blood-2003-07-2449. [DOI] [PubMed] [Google Scholar]
- 13.Sili U, Huls MH, Davis AR, et al. Large-scale expansion of dendritic cell-primed polyclonal human cytotoxic T-lymphocyte lines using lymphoblastoid cell lines for adoptive immunotherapy. J Immunother (1997) 2003;26:241–256. doi: 10.1097/00002371-200305000-00008. [DOI] [PubMed] [Google Scholar]
- 14.Leen A, Ratnayake M, Foster A, et al. Contact-activated monocytes: efficient antigen presenting cells for the stimulation of antigen-specific T cells. J Immunother (1997) 2007;30:96–107. doi: 10.1097/01.cji.0000211325.30525.84. [DOI] [PubMed] [Google Scholar]
- 15.Gottschalk S, Edwards OL, Sili U, et al. Generating CTLs against the subdominant Epstein-Barr virus LMP1 antigen for the adoptive immunotherapy of EBV-associated malignancies. Blood. 2003;101:1905–1912. doi: 10.1182/blood-2002-05-1514. [DOI] [PubMed] [Google Scholar]
- 16.Kobayashi M, Fitz L, Ryan M, et al. Identification and purification of natural killer cell stimulatory factor (NKSF), a cytokine with multiple biologic effects on human lymphocytes. J Exp Med. 1989;170:827–845. doi: 10.1084/jem.170.3.827. [DOI] [PMC free article] [PubMed] [Google Scholar]
- 17.Hsieh CS, Macatonia SE, Tripp CS, et al. Development of TH1 CD4+ T cells through IL-12 produced by Listeria-induced macrophages. Science. 1993;260:547–549. doi: 10.1126/science.8097338. [DOI] [PubMed] [Google Scholar]
- 18.Macatonia SE, Hosken NA, Litton M, et al. Dendritic cells produce IL-12 and direct the development of Th1 cells from naive CD4+ T cells. J Immunol. 1995;154:5071–5079. [PubMed] [Google Scholar]
- 19.Seegers D, Zwiers A, Strober W, et al. A TaqI polymorphism in the 3′UTR of the IL-12 p40 gene correlates with increased IL-12 secretion. Genes Immun. 2002;3:419–423. doi: 10.1038/sj.gene.6363919. [DOI] [PubMed] [Google Scholar]
- 20.Schoenberger SP, Toes RE, van der Voort EI, et al. T-cell help for cytotoxic T lymphocytes is mediated by CD40-CD40L interactions. Nature. 1998;393:480–483. doi: 10.1038/31002. [DOI] [PubMed] [Google Scholar]
- 21.Goodwin JS. Immunomodulation by eicosanoids and anti-inflammatory drugs. Curr Opin Immunol. 1989;2:264–268. doi: 10.1016/0952-7915(89)90198-2. [DOI] [PubMed] [Google Scholar]
- 22.Goodwin JS, Bankhurst AD, Messner RP. Suppression of human T-cell mitogenesis by prostaglandin. Existence of a prostaglandin-producing suppressor cell. J Exp Med. 1977;146:1719–1734. doi: 10.1084/jem.146.6.1719. [DOI] [PMC free article] [PubMed] [Google Scholar]
- 23.Kalinski P, Vieira PL, Schuitemaker JH, et al. Prostaglandin E(2) is a selective inducer of interleukin-12 p40 (IL-12p40) production and an inhibitor of bioactive IL-12p70 heterodimer. Blood. 2001;97:3466–3469. doi: 10.1182/blood.v97.11.3466. [DOI] [PubMed] [Google Scholar]
- 24.van der Pouw Kraan TC, Boeije LC, Smeenk RJ, et al. Prostaglandin-E2 is a potent inhibitor of human interleukin 12 production. J Exp Med. 1995;181:775–779. doi: 10.1084/jem.181.2.775. [DOI] [PMC free article] [PubMed] [Google Scholar]
- 25.Kelsall BL, Stuber E, Neurath M, et al. Interleukin-12 production by dendritic cells. The role of CD40-CD40L interactions in Th1 T-cell responses. Ann N Y Acad Sci. 1996;795:116–126. doi: 10.1111/j.1749-6632.1996.tb52660.x. [DOI] [PubMed] [Google Scholar]
- 26.Stuber E, Strober W, Neurath M. Blocking the CD40L-CD40 interaction in vivo specifically prevents the priming of T helper 1 cells through the inhibition of interleukin 12 secretion. J Exp Med. 1996;183:693–698. doi: 10.1084/jem.183.2.693. [DOI] [PMC free article] [PubMed] [Google Scholar]
- 27.Huarte E, Larrea E, Hernandez-Alcoceba R, et al. Recombinant adenoviral vectors turn on the type I interferon system without inhibition of transgene expression and viral replication. Mol Ther. 2006;14:129–138. doi: 10.1016/j.ymthe.2006.02.015. [DOI] [PubMed] [Google Scholar]
- 28.Seiler MP, Gottschalk S, Cerullo V, et al. Dendritic cell function after gene transfer with adenovirus-calcium phosphate co-precipitates. Mol Ther. 2007;15:386–392. doi: 10.1038/sj.mt.6300029. [DOI] [PubMed] [Google Scholar]
- 29.Langenkamp A, Messi M, Lanzavecchia A, et al. Kinetics of dendritic cell activation: impact on priming of TH1, TH2 and nonpolarized T cells. Nat Immunol. 2000;1:311–316. doi: 10.1038/79758. [DOI] [PubMed] [Google Scholar]