Abstract
Adult cancers may derive from stem or early progenitor cells1,2. Epigenetic modulation of gene expression is essential for normal function of these early cells, but is highly abnormal in cancers, which often exhibit aberrant promoter CpG island hypermethylation and transcriptional silencing of tumor suppressor genes and pro-differentiation factors3-5. We find that, for such genes, both normal and malignant embryonic cells generally lack the gene DNA hypermethylation found in adult cancers. In embryonic stem (ES) cells, these genes are held in a “transcription ready” state mediated by a “bivalent” promoter chromatin pattern consisting of the repressive polycomb group (PcG) H3K27me mark plus the active mark, H3K4me. However, embryonic carcinoma (EC) cells add two key repressive marks, H3K9me2 and H3K9me3, both associated with DNA hypermethylated genes in adult cancers6-8. We hypothesize that cell chromatin patterns and transient silencing of these important growth regulatory genes in stem or progenitor cells of origin for cancer may leave these genes vulnerable to aberrant DNA hypermethylation and heritable gene silencing in adult tumors.
Epigenetic gene silencing and associated promoter CpG island DNA hypermethylation are prevalent in all cancer types, and provide an alternative mechanism to mutations by which tumor suppressor genes may be inactivated within a cancer cell 3-5. These epigenetic changes may precede genetic changes in pre-malignant cells and foster the accumulation of additional genetic and epigenetic hits 9. Adult cancers may derive from stem or early progenitor cells 1,2, and epigenetic modulation of gene expression is essential for normal function of these early cells. We now explore whether DNA hypermethylation and heritable silencing of groups of genes in adult tumor initiation and progression might reflect chromatin properties for these genes associated with a stem or precursor cell of origin.
We compared the epigenetic status of a group of genes frequently hypermethylated and silenced in adult cancers (Fig. 1-all references utilized in Supplementary Table 1) in both normal embryonic stem (ES) cells and malignant counterparts of these cells, embryonal carcinomas (EC) cells.10. Remarkably, we find that the genes frequently undergoing promoter CpG island DNA hypermethylation in adult human cancer cells generally remain unmethylated in both ES and EC cells (Fig. 1). Among the genes studied, 13 of 29 (45%) are hypermethylated in a single line, HCT-116, of adult colon cancer, but none are hypermethylated in ES cells, and only 3% and 7% were completely methylated in the Tera-1 and Tera-2 EC lines, respectively. Thus, the key epigenetic parameter of promoter CpG island hypermethylation which is common in a large group of genes in adult cancer cells does not seem to be a common feature of EC cells.
Figure 1. Genes that are frequently DNA hypermethylated and silenced in adult cancers remain unmethylated in embryonal carcinoma (EC) and embryonic stem (ES) cells.
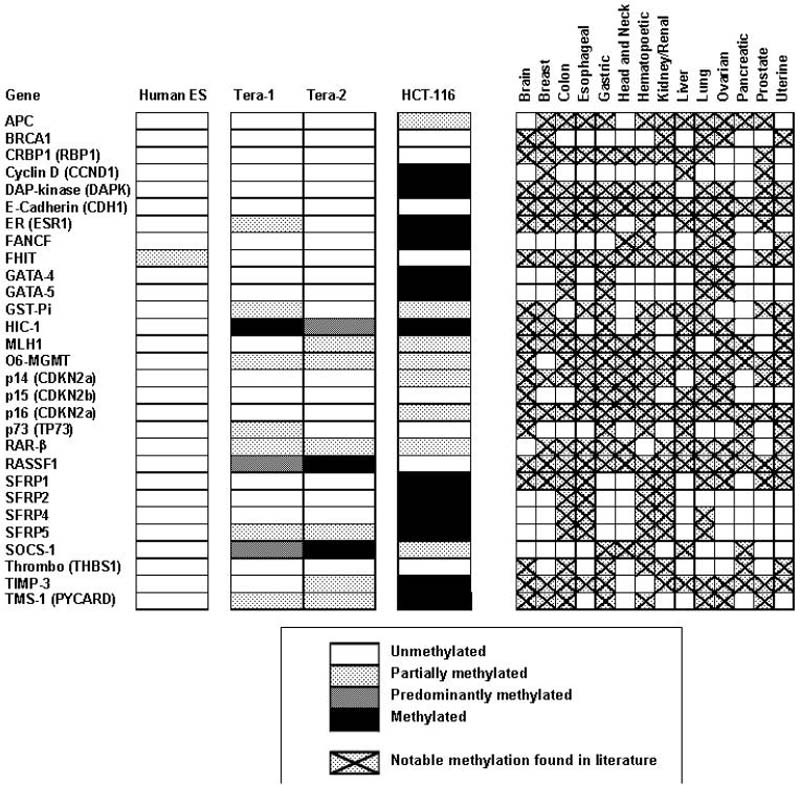
A panel of 29 tumor suppressor, and candidate tumor suppressor genes were selected that are known to be frequently hypermethylated in various cancer cell lines and primary tumor samples (right panel) from review of the literature and from studies in our own labs (all utilized refs are given in Supplementary Table 1 - methylation was considered notable when greater than 5% of the human cell lines or patient samples surveyed were methylated). Methylation specific PCR was used to determine the promoter DNA methylation status of these genes in colon cancer HCT-116 cells, in WA01 human ES cells, and two EC cell lines: Tera-1 and Tera-2 cells. Genes were characterized as unmethylated (empty square), fully methylated (black square), or partially methylated (shaded grey squares).
In murine ES cells, many developmental genes are maintained in a state of low transcriptional activity and are available for transcription increases or decreases when differentiation cues are received 11. Our studied genes in EC cells retain this plasticity of expression that would be lacking in adult cancers when these same genes are hypermethylated. Both ES and EC cells can be induced to differentiate towards a neural lineage with all-trans retinoic acid (ATRA) in vitro10. Our genes with a high basal transcription state in EC cells (top left group of genes, Fig. 2b) actually generally decrease their expression with ATRA treatment. However, a larger second cluster of genes have a low to medium expression state in undifferentiated Tera-2 cells (top right group of genes, Fig. 2b), and the majority of these (9 of 11) exhibit a distinct activation pattern with increased expression upon or during differentiation (Fig 2b).
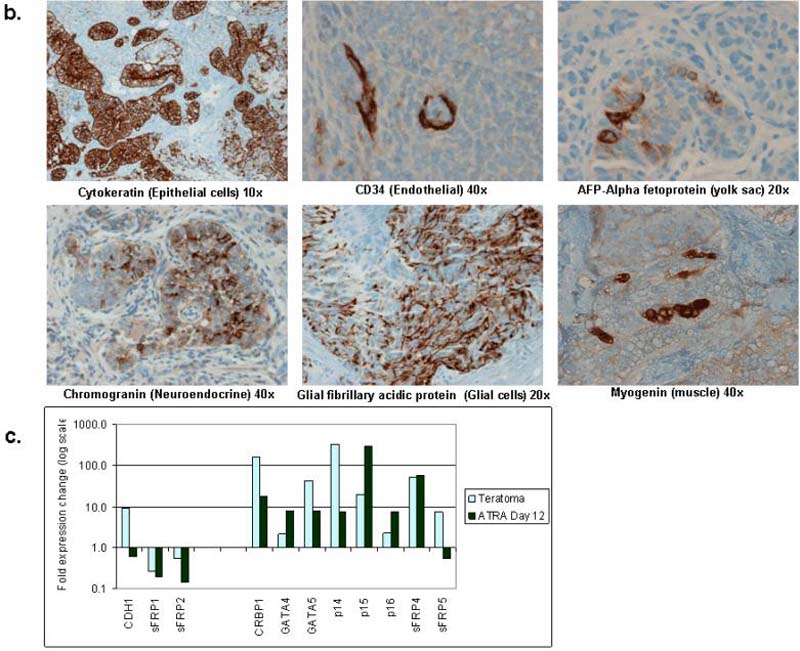
Figure 2. EC cells retain a plasticity of expression that is lacking in adult cancer cells.
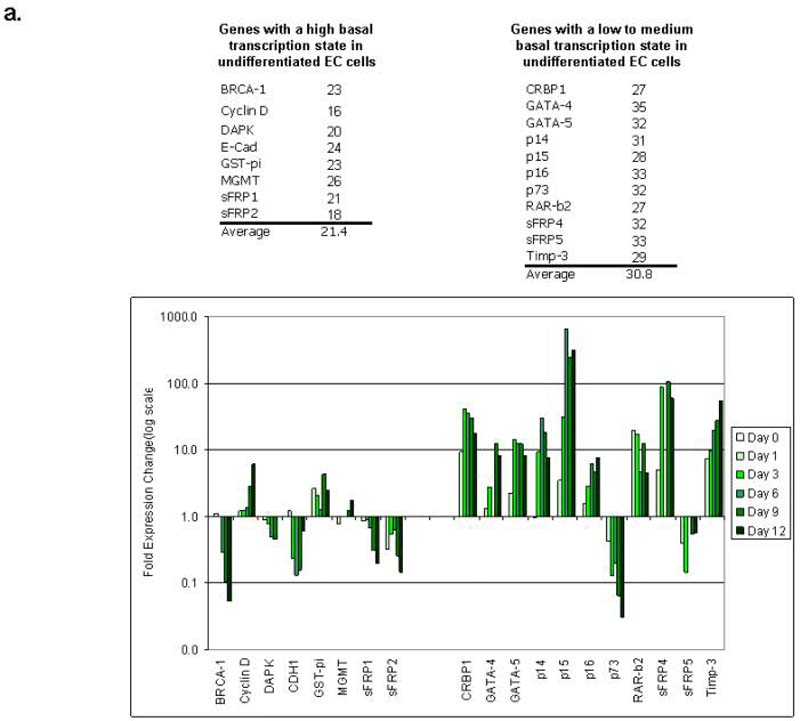
a. Real-time qRT/PCR analysis of genes frequently hypermethylated in adult cancers following treatment EC cells with all-trans retinoic acid (ATRA, 2uM) for 0 (untreated), 1, 3, 6, 9, and 12 days. PCR reactions were performed in triplicate, and average threshold cycle for altered gene expression with ATRA treatment was normalized to GAPDH. Fold change (log scale) for each gene over untreated Tera-2 cells was calculated using the formula fold change = -log[ct(treatment)-ct(untreated)]. Representative results of two or more independent experiments are shown. Genes are divided into two groups by threshold cycle: low to medium expression (top panel - note high cycle threshold number for the PCR, average; 30.8)) and genes with high basal expression (note low threshold cycle number, average; 21.4).
b. Immunohistochemistry of teratocarcinoma tumor grown in NOD/SKID mice. Immunostaining was performed by the Johns Hopkins Immunopathology Department according to established protocols on paraffin embedded section using antibodies to CD34 (40x):endothelial cells, chromogranin (40x); neuroendocrine, cytokeratin (10x): epithelial, alpha fetoprotein (AFP; 20x): yolk sac development, Glial fibrillary acidic protein (GFAP; 20x): glial cells, and Myogenin (40x): muscle.
c. qRT/PCR was performed for RNA from 5×10⁶ Tera-2 cells grown as xenographs in nod-skid mice until tumors reached approximately 1.5 centimeters in diameter. Fold expression change was calculated as described above, and results from Tera2 cells treated with ATRA (2uM) for 12 days are shown for comparison.
Both ES and EC cells, when grown as xenografts in NOD/SCID mice, form teratomas and teratocarcinomas respectively, in which there is spontaneous differentiation and multi-lineage commitment to varying degrees 10 (Fig. 2c). The expression changes of our studied genes are similar in these tumors as induced by ATRA (Fig. 2d, for example see p16, GATA4, GATA5). E-cadherin and sFRP5 are notable exceptions and differences likely reflect multi-lineage commitment in vivo vs. single lineage differentiation in vitro.
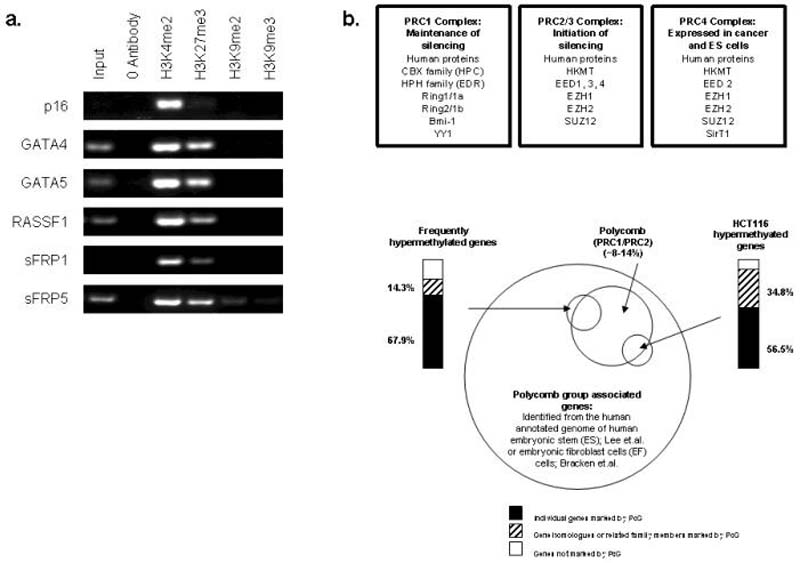
We find that the promoter regions of our studied genes each contain a combination of active (H3K4me2) and repressive (H3K27me3) histone modifications in ES cells (Fig. 3a). This “ bivalent state” has been recently described in murine ES cells 11,12 for a subset of developmental genes which are maintained in a low expression state, and we thus extend these observations to genes frequently epigenetically silenced in cancer. We have previously found H3K27me3 to be enriched at each of the of the promoters of a small panel of DNA hypermethylated genes we studied in adult cancer cells6. This histone modification is catalyzed by EZH2, a key component of the Polycomb group (PcG) complexes (PRC1, 2/3, 4)(Fig. 3b) which maintain long-term gene silencing from lower organisms to man and are essential for the normal state of stem/progenitor cells and their commitment to various tissue types13,14. Recent studies have linked EZH2 with DNA methyltransferases and established a role for this protein during the induction and targeting of DNA methylation 15. These complexes are present in stem and progenitor cells, as well as in tumor cells that have similar properties14,16.
Figure 3. Genes frequently DNA hypermethylated in cancer are marked by “bivalent” chromatin in ES cells, including the polycomb group (PcG) protein associated histone modification, H3K27me.
a. Chromatin IP was performed using antibodies to H3K4me2, H3K9me27, H3K9me2, H3K9me3, on WA09 human ES cells. PCR was performed for regions within the CpG islands, and near the transcription start sites of p16, GATA4, GATA5, RASSF1, sFRP1, and sFRP5. Representative results of two independent experiments are shown. A zero-antibody negative control is included for comparison. b. Top panel: Polycomb repressive complex 1, 2/3 and 4 are shown. Lower panel: Genes frequently DNA hypermethylated in adult cancers are targeted by PcG target genes in human embryonic stem (ES) and embryonic fibroblast (EF) cells. We compiled the list of genes marked by by PcG proteins and estimated in two recent studies to represent between ~8% (PRC2; ES cells) 17 and ~14% (PRC1/PRC2; EF cells) 19 of the annotated genome. We identified, in these lists, our genes frequently DNA hypermethylated in adult cancers (top left) and find a remarkable 68% were associated with PcG in either ES or EF cells in the above studies. An additional 14% had related proteins under polycomb control. Similar results were seen using 23 genes newly identified by microarray studies (manuscript submitted) to be DNA hypermethylated in HCT-116 cells (top right).
We next matched our list of genes frequently DNA hypermethylated in adult cancers to the full list of PcG targeted genes recently identified by recent studies of human and murine ES 17,18 and embryonic fibroblast (EF) cells19. These genome-wide tiling studies identified between ~8% (PRC2; ES cells) 17 and ~14% (PRC1/PRC2; EF cells) 19 of the annotated genome to be PcG regulated in these cell types. Remarkably, we found 68% of the genes from Fig.1 were associated with PcG in either ES or EF cells as were 56.5% of 23 genes (Fig. 3b) newly identified as hypermethylated in HCT-116 cells (Schuebel, et al, unpublished data).
As noted by Bernstein et.al., among embryonic cells, the degree of lineage commitment may determine the balance of chromatin modifications at gene promoters and their basal expression levels.11,. Similarly, this may be true for compartments of precursor cells in adult renewing cell systems from which adult cancers derive. Interestingly, for the genes from Fig. 1 that are identified as PcG targets, approximately 50% were listed as PcG targets in both ES and EF cells. However, the remaining 50% were listed as unique PcG targets in either ES or EF cells. This might explain how different patterns of hypermethylated genes in adult cancers might, then, be reflective of their chromatin status in a cell of origin.
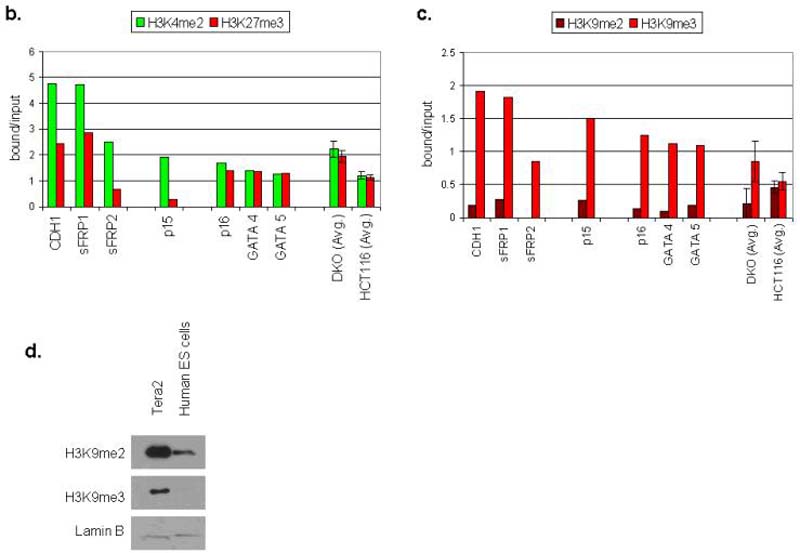
We next find that, while the genes studied in EC cells share the bivalent chromatin pattern seen in ES cells (Fig. 4a, 4b), they acquire two additional key repressive marks characteristic of adult cancers in EC cells. Thus, H3K9me3, which is characteristic of silenced transcription in pericentromeric regions 20, and to a lower and more variable extent, H3K9me2 are enriched at the promoters (Fig. 4a, 4c). Both of these H3K9 marks are characteristic of DNA hypermethylated genes in adult cancers6. In both Neurospora, and Arabidopsis, mutations in histone methyltransferases which catalyze H3K9 methylation cause significant loss of genomic DNA methylation 21-23. Interestingly, in the EC cells, global levels of both of the H3K9 repressive marks are increased considerably as compared to ES cells (Fig. 4d) suggesting a permissive background for the promoter changes in the neoplastic cells.
Figure 4. Genes studied in EC cells share the bivalent chromatin pattern seen in ES cells, but add additional repressive marks characteristic of these same genes when they are induced to DNA de-methylate in adult cancers.
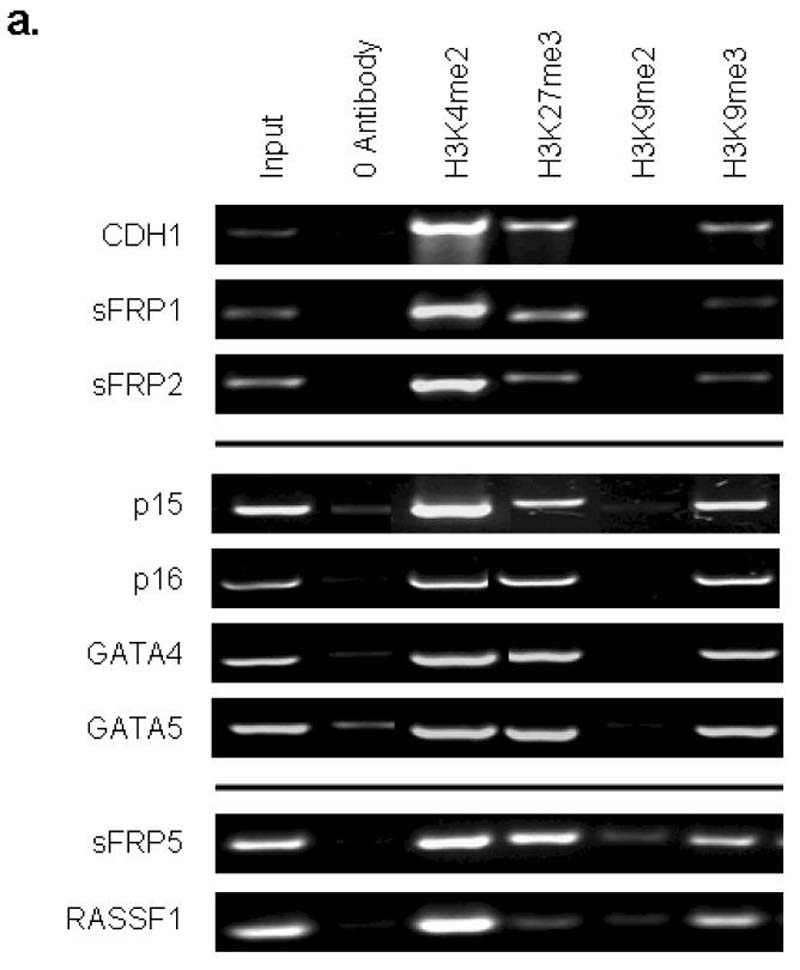
a. Chromatin IP was performed using antibodies to H3K4me2, H3K9me27, H3K9me2, H3K9me3, on Tera-2 cells. PCR was performed for regions within the CpG islands, and near the transcription start sites of CDH1, sFRP1, sFRP2, p15, p16, GATA4, GATA5, sFRP5 and RASSF1. Representative results of two independent experiments are shown. A zero-antibody negative control is included for comparison. b. Quantitation of representative gels shown in Fig. 4a showing the ratio of H3K4me2 (active mark) and H3K27me3 (repressive mark) to input DNA in Tera-2 cells for CDH1, sFRP1, sFRP2, p15, p16, GATA4 and GATA5, and as an average for four of these genes (sFRP2, sFRP5, GATA4, GATA5) from previous studies6 of HCT-116 DKO and wild type cells (far right two columns). Error bars indicate standard errors. c. Ratio of H3K9me2 and H3K9me3 to input DNA in Tera-2 cells for CDH1, sFRP1, sFRP2, p15, p16, GATA4 and GATA5, and as an average for four of these genes (sFRP2, sFRP5, GATA4, GATA5) from previous studies6 in HCT116 wild type cells, where each of the genes is DNA hypermethylated and lacks any basal transcription, and HCT116 DKO cells where each gene has become fully DNA demthylated and is re-expressed6 (far right two columns). d. Western blot analysis for the repressive histone modifications, H3K9me2 and H3K9me3 in Tera2 cells and the human ES cell line WA01. Lamin B was used as a loading control.
While the chromatin pattern identified above in EC cells is similar to that for DNA hypermethylated genes in adult cancers, several important differences exist. First, in adult cancer cells, the activating mark H3K4me is diminished, and these genes generally have fully repressive rather than bivalent chromatin6,24. However, this activating mark is re-enriched when the genes in adult cancer cells are induced to DNA de-methylate and re-express, either by genetic knockout of DNA methyltransferases or treatment with DAC6,24. Second, in adult cancers, the repressive chromatin present for DNA hypermethylated genes is initially more enriched for H3K9me26,24 than is seen in the EC cells. The ratio of H3K9me3 to HeK9me2 in EC for unmethylated genes is greater than 5:1 in Tera2 cells compared to an average of 1.2:16 for DNA hypermethylated promoters in adult cancers (Fig. 4d). Interestingly, in EC cells the fully methylated RASSF1a gene and the minimally methylated sFRP5 gene both demonstrate an increased presence of the H3K9me2 mark at their promoters (Fig. 4a). Most importantly, when DNA hypermethylated genes are de-methylated in adult cancer cells, H3K9me2 is the only repressive mark uniformly reduced6,24 and the ratio of H3K9me3 to H3K9me2 increases to 4:1, (see average for previously published results, Fig. 4d.), a value virtually identical to that for unmethylated genes in EC cells6,24 (Fig. 4d).
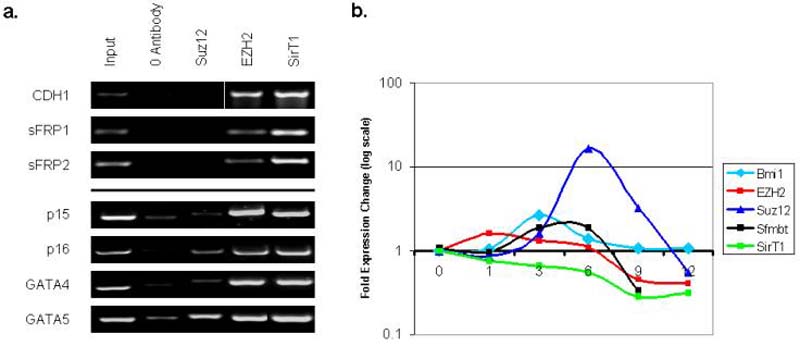
The chromatin findings for genes in EC cells present an opportunity to study how the various repressive histone modifications and the proteins that maintain them are altered with differentiation of these cells. This is a key question since DNA hypermethylated genes in adult cancers are very deeply, heritably repressed, and thus difficult to reactivate unless the DNA methylation is removed. We first observed that key PcG proteins SUZ12, EZH2, and SirT1 are enriched at the promoters of the genes in EC cells (Fig. 5a). The steady state levels of these proteins fall (Fig. 5b), as do their levels at the above promoters with ATRA treatment (Fig. 5c). Additionally, several PcG proteins, including Bmi1, Suz12, and Sfmbt show a transient increase in expression at various points during the differentiation process, followed by a lowering of expression as cells enter a more differentiated state. This data supports the extensive work of others in discerning a role for this family during normal differentiation 16.
Figure 5. Changes in histone modifications and localization of known polycomb group (PcG) proteins to the gene promoters in Tera-2 cells with ATRA induced differentiation.
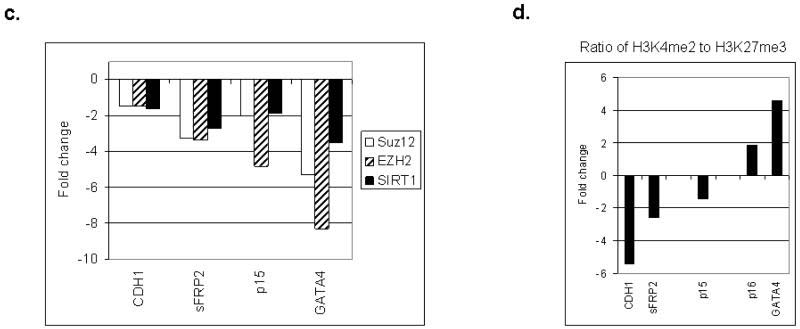
a. ChIP reactions were performed using antibodies to Suz12, EZH2 and SIRT1 in Tera-2 cells for genes that are expressed at a low to medium basal state in undifferentiated Tera-2 and up-regulated with differentiation (p16, GATA4, GATA5, p15), and genes that are expressed at a high basal degree in Tera-2 and down-regulated with differentiation (CDH1, sFRP1, and sFRP2). Representative results of two independent experiments are shown. A zero antibody negative control is included for comparison. b. RT/PCR was performed as described in Figure 2 for Bmi1, Suz12, EZH2, Sfmbt and SIRT1 during ATRA induced differentiation of Tera-2 cells. Fold expression change (log scale) is shown following 0, 1, 3, 6, 9, and 12 days of differentiation. c. Real time ChIP PCR shows a reduction in PcG protein localization to the promoters of CDH1, sFRP2, p15, and GATA-4 following ATRA (2 uM, 10 days) induced differentiation of Tera-2 cells. Fold change compared to undifferentiated cells is shown. A representative experiment from two or more PCR determinations is shown. d. Quantitative ChIP PCR showing fold change of H3K4me2/H3K27me3 ratio following ten days of ATRA treatment in genes that are down-regulated with ATRA treatment (CDH1 and sFRP2) and genes that are up-regulated with ATRA (p15 and GATA4). A representative experiment from two or more PCR determinations is shown.
In murine ES cells, many developmental genes marked by the above bivalent chromatin states are maintained in a low expression state but demonstrate a plasticity of chromatin and expression by increasing transcription and shifting to a more monovalent active chromatin pattern when differentiation cues are received 11. We see this for p16 and GATA4 which have a moderate to low basal expression state in EC, with equal initial H3K4me2 to H3K27me3 ratio (Fig. 4a, 4b), but adopt a more active, monovalent state as their expression is distinctly increased by ATRA (Fig. 5d). A second subset of the genes frequently DNA hypermethylated in adult cancers, which have a higher basal expression level in EC (CDH1, sFRP1, sFRP2) and a higher initial ratio of active to repressive marks (Fig. 4a, 4b), generally decrease expression with all-trans retinoic acid (ATRA) treatment (Fig. 2b) and exhibit a decrease in the ratio of H3K4me2 to H3K27me3 (Fig. 5d). An exception is p15, which is expressed at an intermediate level in undifferentiated cells, demonstrates significant up-regulation with differentiation (Fig. 2b), but already displays an active, monovalent chromatin state in EC cells (Fig. 4a, 4b), which is not significantly altered with differentiation (Fig. 5d).
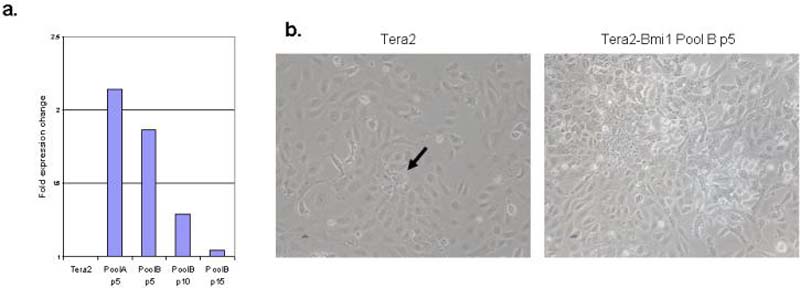
If a stem cell gene promoter chromatin pattern, including PcG-mediated repressive histone modifications, might help render certain genes vulnerable to DNA hypermethylation, can one perturbate the system in embryonic cells to further test this hypothesis? We tested this by forcing over-expression of Bmi1, a central component of PRC1. PRC1 is involved in recognition of the H3K27 mark established by EZH2 in the PRC2 complex and subsequent maintenance of PcG mediated long term gene silencing13,14. Bmi1 is endogenously expressed in the wild type Tera2 cells and shows a transient increase and subsequent decline during ATRA induced differentiation (Fig. 5b). Forced, stable over-expression of Bmi1 in these cells results in an initial rise in mRNA for the gene which is sustained for >10 passages and then returns to baseline (Fig. 6a). This is accompanied in pooled cells, and multiple cloned populations studied, by an overall increase in cell proliferation, cell number, and loss of contact inhibition of subsets of cells in vitro (Fig. 6b), seen only infrequently in wild type cells (arrow, left panel, 6b). The over-expression of Bmi1 does not acutely induce methylation of most unmethylated tumor-suppressor genes examined including p16, E-cadherin, GATA4 or GATA5. However, in the pooled cells, and in two of five separate clones studied, increased DNA methylation of the anti-Wnt gene, sFRP5, occurs over time (Fig. 6c), and this is never observed with chronic passing of the wild type cells. The histone modifications at the sFRP5 promoter remain unchanged in the pooled Bmi1 over-expressing cells through passage 10 (Fig. 6d). However, as DNA methylation increases at passage 20 for one clone examined, the ratio of H3K9me2 to H3K9me3 becomes approximately equal (Fig. 6d and, thus, similar to that for DNA hypermethylated genes in adult cancers6 (Fig. 4c).
Figure 6. Over-expression of Bmi1 can cause progressive promoter DNA methylation of the SFRP5 gene in EC cells.
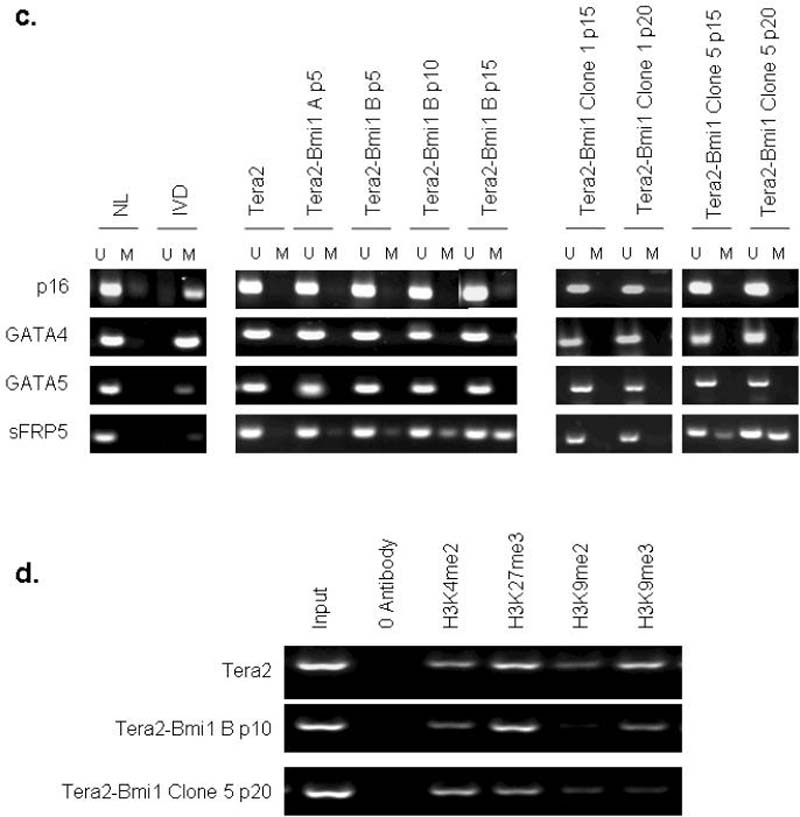
a. Tera2 cells were stably infected with a Bmi1 expressing lentivirus, and qRT/PCR for Bmi1 transcript is shown in Bmi1 infected pools of cells at passage 5, 10, and 15 post-infection. A representative experiment from two PCR determinations is shown. b. Wild type Tera2 (left panel) and Bmi1 over-expressing Tera2 cells (right panel) in culture (10×). Arrow (left panel) indicates small infrequent cluster of cells in Tera2 which demonstrate increased proliferation and loss of contact inhibition. c. Methylation analysis by MSP was performed for p16, GATA4, GATA5, and sFRP5 for Tera2 and Bmi1 over-expressing pools passage 5, 10, and 15 and five individual clones at passage 15 and 20. For clones, representative results for two of five clones are shown. For all MSP, representative results of two independent experiments are shown. M= methylated signal; U = unmethylated. Normal lymphocytes (NL) and in-vitro methylated DNA (IVD) are included as positive and negative controls for methylated DNA. d. Chromatin IP was performed at the sFRP5 promoter in Tera2 cells, pooled Bmi1 infected cells at passage10 post-infection, and a single clone of Bmi1 infected cells at passage 20. ChIP was performed using antibodies to H3K4me2, H3K9me27, H3K9me2, H3K9me3 as described in Fig. 4.
In summary, our studies reveal that genes frequently DNA hypermethylated and deeply transcriptionally silenced in adult cancers usually lack such DNA methylation in normal and neoplastic embryonic cells. However, the chromatin of these genes is virtually identical in embryonic cancer cells to that for the genes in adult cancers, especially when the DNA methylation in the latter cells is reduced and the involved genes are re-expressed. The repressive pattern for the EC cells may, then, represent a “transition” state, somewhere between ES cells and fully DNA hypermethylated genes in adult cancers, for repressing gene expression to facilitate neoplastic progression. The fact that DNA hypermethylated genes in adult cancers, when transiently induced to DNA demethylate with drugs, retain a promoter chromatin pattern virtually identical to what we now show in EC cells, may be important as to why these same genes re-acquire the DNA methylation and silencing once drug is removed6,25.
In terms of human cancer biology, our findings suggest that a stem cell like promoter “ground state”, involving the key PcG mark, H3K27me3, for these genes may be indicative of the contribution of stem cell and/or progenitor cells to the derivation of adult cancers (Supplemental Fig. 7). We and others have suggested that stem/progenitor cells are especially at risk for cancer initiation due to their continued expansion during states such as chronic wound healing and inflammation9,26. The stem cell chromatin state that we now show, if further repressive marks for H3K9 are added, may provide a program for making key tumor suppressor genes vulnerable for imposition of promoter CpG island DNA methylation during such expansion (Supplemental Fig. 7). These changes may enhance the likelihood of tumor initiation and progression from cell transformation as it renders a transient “transcription ready” state to one of heritable, permanent gene silencing.
METHODS
Cell culture
Tera-1, Tera-2, and HCT-116 (ATCC) cells were maintained in McCoy's 5A medium supplemented with 10% FBS and grown at 37 degrees under 5% CO2. DNA for methylation specific PCR (MSP) was isolated in the laboratory of Dr. Saul Sharkis, Johns Hopkins University from the human ES cell line WA01 (Wisconsin Alumni Research Foundation: WiCell Research Institute), according to established protocols. Cross-linking for human ES cell chip and subsequent DNA isolation was performed in the laboratory of Dr. Linzhao Cheng using the human ES cell lines WA01 and WA09 (Wisconsin Alumni Research Foundation: WiCell Research Institute).
Bisulfite treatment and methylation specific PCR
Bisulfite treatment and MSP were performed as described previously27. DNA was extracted following a standard phenol-chloroform extraction method. Primer sequences and cycling conditions are included in Supplementary Table 2. Any information not included is available by request from the authors.
RNA purification and real-time RT/PCR analysis
RNA was isolated with TRIzol™ Reagent (Invitrogen, Carlsbad CA, USA) according to the manufacturer's instructions. For reverse transcription-PCR (RT-PCR), 1 μg of total RNA was reverse transcribed by using the Superscript First-Strand Synthesis System (Invitrogen, Carlsbad CA, USA). Quantitative real-time RT/PCR was performed as described previously28. PCR primers and amplification conditions are included in Supplementary Table 2. Any information not included is available by request from the authors.
Chromatin Immunoprecipitation
ChIP assays were performed as described previously6, with the modification that IP was performed using Dynal Magnetic beads purchased from Invitrogen. (Protein A beads 100-02D, Protein G beads 100-04D). Antibodies to H3K9me27, H3K9me2, H3K9me3 were produced as previously described6. Antibodies to Suz12 (Abcam, Cambridge, MA), H3K4me2, EZH2 (Upstate, Charlottesville, VA), and SIRT1 (Delta Biolabs, Gilroy,CA) were purchased from commercial sources. Primers and amplification conditions are included in Supplementary Table 2. Any information not included is available by request from the authors.
Lentiviral vector preparation, viral production, and infection
An untagged Bmi1 lentiviral expression clone was generated using the full-length cDNA from a pBABE-puro retroviral construct kindly provided by Dr. Goberdhan Dimri, Northwestern University and the ViraPower Promoterless Lentiviral Gateway System (Invitrogen Corp. Carlsbad CA, USA). Briefly, a Bmi1 entry clone with an intact stop codon was incorporated along with a second UbC promoter containing entry clone obtained with this kit (pENTR5'-UbCp) into the pLenti6/R4R2/V5-DEST vector from Invitrogen. The expression clone was transformed into Stbl3 competent cells (Invitrogen Corp.) and Bmi1 containing recombinants were selected using Ampicillin and Blasticidin resistance and confirmed by restriction digest. Plasmid DNA was purified using GenElute™ Plasmid Maxiprep Kit (Sigma-Aldrich Corp.), and Lentivirus was packaged in 293FT cells and infected in Tera2 cells using manufacturer's recommended protocols. Blasticidin (0.5-1 ug/ml) was added to complete media 48 hours post-infection, and stable expressing pools and clones were maintained in 0.5 ug/ml blasticidin for the duration of the experiments.
Supplementary Material
Acknowledgements
This work is supported by grants NIH CA116160 and NCI CA043318 to S.B.B Special thanks to Leslie Meszler at the Cell Imaging Core Facility at The Sidney Kimmel Comprehensive Cancer Center, Dr. Peter Argani, Pathology Dept., Johns Hopkins University, and Dr. Goberdhan Dimri at Northwestern University for providing the Bmi1 cDNA.
Footnotes
Competing Interests Statement. The commercial rights to the MSP technique belong to Oncomethylome. S.B.B and J.G.H. serve as consultants to Oncomethylome and is entitled to royalties from any commercial use of this procedure.
References
- 1.Al-Hajj M, Wicha MS, Benito-Hernandez A, Morrison SJ, Clarke MF. Prospective identification of tumorigenic breast cancer cells. Proc Natl Acad Sci U S A. 2003;100:3983–8. doi: 10.1073/pnas.0530291100. [DOI] [PMC free article] [PubMed] [Google Scholar]
- 2.Clarke MF, Fuller M. Stem cells and cancer: two faces of eve. Cell. 2006;124:1111–5. doi: 10.1016/j.cell.2006.03.011. [DOI] [PubMed] [Google Scholar]
- 3.Jones PA, Baylin SB. The fundamental role of epigenetic events in cancer. Nat Rev Genet. 2002;3:415–28. doi: 10.1038/nrg816. [DOI] [PubMed] [Google Scholar]
- 4.Jones PA, Laird PW. Cancer epigenetics comes of age. Nat.Genet. 1999;21:163–167. doi: 10.1038/5947. [DOI] [PubMed] [Google Scholar]
- 5.Feinberg AP, Tycko B. The history of cancer epigenetics. Nat Rev Cancer. 2004;4:143–53. doi: 10.1038/nrc1279. [DOI] [PubMed] [Google Scholar]
- 6.McGarvey KM, et al. Silenced tumor suppressor genes reactivated by DNA demethylation do not return to a fully euchromatic chromatin state. Cancer Res. 2006;66:3541–9. doi: 10.1158/0008-5472.CAN-05-2481. [DOI] [PubMed] [Google Scholar]
- 7.Kondo Y, Shen L, Issa JP. Critical role of histone methylation in tumor suppressor gene silencing in colorectal cancer. Mol Cell Biol. 2003;23:206–15. doi: 10.1128/MCB.23.1.206-215.2003. [DOI] [PMC free article] [PubMed] [Google Scholar]
- 8.Nguyen CT, et al. Histone H3-lysine 9 methylation is associated with aberrant gene silencing in cancer cells and is rapidly reversed by 5-aza-2'-deoxycytidine. Cancer Res. 2002;62:6456–61. [PubMed] [Google Scholar]
- 9.Baylin SB, Ohm JE. Epigenetic gene silencing in cancer - a mechanism for early oncogenic pathway addiction? Nat Rev Cancer. 2006;6:107–16. doi: 10.1038/nrc1799. [DOI] [PubMed] [Google Scholar]
- 10.Andrews DF, 3d, Nemunaitis J, Tompkins C, Singer JW. Effect of 5-azacytidine on gene expression in marrow stromal cells. Mol.Cell Biol. 1989;9:2748–2751. doi: 10.1128/mcb.9.6.2748. [DOI] [PMC free article] [PubMed] [Google Scholar]
- 11.Bernstein BE, et al. A bivalent chromatin structure marks key developmental genes in embryonic stem cells. Cell. 2006;125:315–226. doi: 10.1016/j.cell.2006.02.041. [DOI] [PubMed] [Google Scholar]
- 12.Azuara V, et al. Chromatin signatures of pluripotent cell lines. Nat Cell Biol. 2006 doi: 10.1038/ncb1403. [DOI] [PubMed] [Google Scholar]
- 13.Ringrose L, Paro R. Epigenetic regulation of cellular memory by the Polycomb and Trithorax group proteins. Annu Rev Genet. 2004;38:413–43. doi: 10.1146/annurev.genet.38.072902.091907. [DOI] [PubMed] [Google Scholar]
- 14.Sparmann A, van Lohuizen M. Polycomb silencers control cell fate, development and cancer. Nat Rev Cancer. 2006;6:846–56. doi: 10.1038/nrc1991. [DOI] [PubMed] [Google Scholar]
- 15.Vire E, et al. The Polycomb group protein EZH2 directly controls DNA methylation. Nature. 2006;439:871–4. doi: 10.1038/nature04431. [DOI] [PubMed] [Google Scholar]
- 16.Kuzmichev A, et al. Composition and histone substrates of polycomb repressive group complexes change during cellular differentiation. Proc Natl Acad Sci U S A. 2005;102:1859–64. doi: 10.1073/pnas.0409875102. [DOI] [PMC free article] [PubMed] [Google Scholar]
- 17.Lee TI, et al. Control of developmental regulators by polycomb in human embryonic stem cells. Cell. 2006;125:301–13. doi: 10.1016/j.cell.2006.02.043. [DOI] [PMC free article] [PubMed] [Google Scholar]
- 18.Boyer LA, et al. Polycomb complexes repress developmental regulators in murine embryonic stem cells. Nature. 2006 doi: 10.1038/nature04733. [DOI] [PubMed] [Google Scholar]
- 19.Bracken AP, Dietrich N, Pasini D, Hansen KH, Helin K. Genome-wide mapping of Polycomb target genes unravels their roles in cell fate transitions. Genes Dev. 2006 doi: 10.1101/gad.381706. [DOI] [PMC free article] [PubMed] [Google Scholar]
- 20.Schotta G, et al. A silencing pathway to induce H3-K9 and H4-K20 trimethylation at constitutive heterochromatin. Genes Dev. 2004;18:1251–62. doi: 10.1101/gad.300704. [DOI] [PMC free article] [PubMed] [Google Scholar]
- 21.Tamaru H, et al. Trimethylated lysine 9 of histone H3 is a mark for DNA methylation in Neurospora crassa. Nat Genet. 2003;34:75–9. doi: 10.1038/ng1143. [DOI] [PubMed] [Google Scholar]
- 22.Johnson L, Cao X, Jacobsen S. Interplay between two epigenetic marks. DNA methylation and histone H3 lysine 9 methylation. Curr Biol. 2002;12:1360–7. doi: 10.1016/s0960-9822(02)00976-4. [DOI] [PubMed] [Google Scholar]
- 23.Jackson JP, et al. Dimethylation of histone H3 lysine 9 is a critical mark for DNA methylation and gene silencing in Arabidopsis thaliana. Chromosoma. 2004;112:308–15. doi: 10.1007/s00412-004-0275-7. [DOI] [PubMed] [Google Scholar]
- 24.Fahrner JA, Eguchi S, Herman JG, Baylin SB. Dependence of histone modifications and gene expression on DNA hypermethylation in cancer. Cancer Res. 2002;62:7213–8. [PubMed] [Google Scholar]
- 25.Liang G, et al. Cooperativity between DNA methyltransferases in the maintenance methylation of repetitive elements. Mol Cell Biol. 2002;22:480–91. doi: 10.1128/MCB.22.2.480-491.2002. [DOI] [PMC free article] [PubMed] [Google Scholar]
- 26.Beachy PA, Karhadkar SS, Berman DM. Tissue repair and stem cell renewal in carcinogenesis. Nature. 2004;432:324–31. doi: 10.1038/nature03100. [DOI] [PubMed] [Google Scholar]
- 27.Herman JG, Graff JR, Myohanen S, Nelkin BD, Baylin SB. Methylation-specific PCR: a novel PCR assay for methylation status of CpG islands. Proc Natl Acad Sci U S A. 1996;93:9821–6. doi: 10.1073/pnas.93.18.9821. [DOI] [PMC free article] [PubMed] [Google Scholar]
- 28.Pruitt K, et al. Inhibition of SIRT1 reactivates silenced cancer genes without loss of promoter DNA hypermethylation. PLoS Genet. 2006;2:344–352. doi: 10.1371/journal.pgen.0020040. [DOI] [PMC free article] [PubMed] [Google Scholar]
Associated Data
This section collects any data citations, data availability statements, or supplementary materials included in this article.


