

Abstract
Objective
To determine whether an fMRI memory encoding task distinguishes among cognitively Normal elderly individuals, patients with Mild Cognitive Impairment (MCI), and patients with early AD.
Methods
Twenty-nine subjects (11 Normal, 9 MCI, 9 AD) were studied with an fMRI memory encoding task. A passive sensory task was also performed to assess potential intergroup differences in fMRI responsiveness. We studied activation in the medial temporal lobe for the memory task and in the anatomic Rolandic area for the sensory task. Inter-group comparisons were performed using Receiver Operating Characteristic (ROC) analyses. The ROC method provides rigorous control of artifactual false positive “activation.” Subjects were tested for recall and recognition of the encoding task stimuli following the fMRI study.
Results
Medial temporal lobe activation was greater in Normals than MCIs and ADs (p = .03 and p = .04). There was no difference between ADs and MCIs in fMRI memory performance. There was an association between fMRI memory activation (area under the ROC curve) and post fMRI performance on recognition and free recall. There was no difference among the three groups on the sensory task.
Conclusion
MCI and AD subjects had less medial temporal lobe activation on the memory task than the Normals, but similar activation as Normals on the sensory task. These findings suggest decreased medial temporal activation may be a specific marker of limbic dysfunction due to the neurodegenerative changes of AD. In addition, fMRI is sufficiently sensitive to detect changes in the prodromal, MCI, phase of the disease.
Keywords: fMRI, Alzheimer’s, Mild Cognitive Impairment, Memory, Encoding
Introduction
Several different functional magnetic resonance imaging (fMRI) activation paradigms show differences in activation between normal elderly and patients with Alzheimer’s disease (AD) including visual saccades,1 visual and motor responses,2 semantic processing,3,4 angle discrimination,5 and memory.6–9 Differences in fMRI activation are also found in individuals at risk for developing AD using attention,10 naming, fluency11,12 and memory 13 tasks.
Changes in memory function are of particular interest because memory impairment is a cardinal feature of AD and is the hallmark clinical feature of Mild Cognitive Impairment -amnestic type (MCI).14 Individuals with MCI are at significantly increased risk for eventually developing AD compared with cognitively normal elderly persons.15 Early detection of alterations in brain function that underlie focal memory impairment has the potential to identify candidates for treatment that may halt or delay progression of cognitive deficits. Functional MRI holds promise as a potential noninvasive tool for detecting changes in brain function before individuals progress to meet clinical criteria for dementia and may complement other established imaging modalities. An often-heard axiom is that functional changes precede structural changes in neurodegenerative diseases. As a functional measure, fMRI therefore should theoretically have an advantage in early detection over other imaging techniques that detect disease related structural changes.
The major aim of this study was to test the hypothesis that an fMRI memory encoding task discriminates among Normal elderly, patients with MCI, and patients with early AD. A secondary hypothesis tested was that Normal elderly, patients with MCI, and patients with early AD have similar activation in response to a passive sensory task. We tested these aims by comparing groups with ROC analysis. We expected to find more robust medial temporal activation with the memory task in normal versus MCI or AD subjects, and better activation in MCI than AD subjects. The sensory task was used as a control measure on which we expected to find no inter-group differences.
Methods
Subjects
All subjects were recruited from the Alzheimer’s Disease Research Center (ADRC)/Alzheimer’s Disease Patient Registry (ADPR) at the Mayo Clinic in Rochester, MN. These are IRB approved prospective longitudinal databases of aging and dementia.16 Informed consent was obtained from every subject (or their appropriate proxy) prior to participation. Thirty-five subjects were studied: 14 cognitively Normal subjects, 11 patients with Mild Cognitive Impairment (MCI), and 10 patients with early AD. All subjects completed neuropsychological testing as part of the standard procedure for participation in the ADRC/ADPR. Prior to recruitment for this fMRI study, participants had been assigned to diagnostic group categories during ADRC/ADPR consensus committee meetings consisting of a geriatrician, neurologists, neuropsychologists, psychometrists, and nurses who had seen the patient.
Criteria for the diagnosis of cognitively Normal controls were: (1) no active neurologic or psychiatric disorders, (2) if medical problems were present, the illnesses or their treatments did not interfere with cognitive function, (3) a normal neurologic exam, (4) no psychoactive medication, (5) independently functioning community dwellers.
The clinical criteria for the diagnosis of MCI were: (1) memory complaint, preferably corroborated by an informant, (2) objective memory impairment for age and education 17,18, (3) largely normal general cognitive function, (4) essentially intact activities of daily living, (5) not demented.19 The diagnostic determination reflected clinical judgment and was not based on fixed cutoff scores on psychometric tests.
The diagnosis of probable AD was made according to the Diagnostic and Statistical Manual for Mental Disorders, III Edition-Revised (DSM-III-R) Criteria for dementia, and National Institute of Neurological and Communicative Disorders and Stroke/Alzheimer’s Disease and Related Disorders Association Criteria (NINCDS/ADRDA) for AD.19,20 All AD patients recruited for this study had a Clinical Dementia Rating (CDR)21 score of 0.5 or 1.0 and Mini-Mental State Exam 22 score of ≥ 20. This step was taken to ensure that AD patients were cognitively capable of performing the fMRI memory activation paradigm.
Recruitment Exclusionary criteria
Potential subjects were excluded if they demonstrated evidence for cortical infarction, excessive subcortical vascular disease, space occupying lesions, non-AD dementing disorders or had concurrent illnesses other than AD that might interfere with cognitive function. Standard MRI exclusionary criteria–e.g. pacemaker - were incorporated as well.
Memory Activation Paradigm
All subjects completed training prior to the scanning session that included an overview of the memory and sensory tasks. Subjects were fitted with MR-compatible lenses if needed.
The memory activation paradigm was designed to emphasize encoding and consisted of four full cycles. Each cycle consisted of a half cycle of the activation task for 21 seconds and a half cycle of the foil task for 21 seconds. Prior to the scan, subjects were reminded to carefully memorize each picture for later recall and recognition testing. During each activation half cycle, three photographs were presented a rate of one every seven seconds, for a total of 12 photographs viewed during the entire scanning run. The photographs consisted of scenes of people engaged in activities of daily living and were drawn from a library that was compiled for this purpose (Photodisc™ 1994). The foil portion of the paradigm consisted of the presentation of a single pixelated image in which the pixels of one of the photographs were randomly reshuffled and the original image was not recognizable. The pixilated image controlled for basic aspects of visual processing such as luminance and color level proportion, but did not control for specific aspects of feature detection and object recognition. We used a non-recognizable stimulus for the foil rather than a control photograph to simplify the task and avoid confusion in the impaired subjects.
Visual stimuli were presented via an LCD visual display mounted on a birdcage head coil. The stimulus presentation was synched with the scanner to provide precise temporal coordination between the MR scanning parameters and stimulus delivery.
Subjects were tested for free recall of the pictures immediately after the encoding run while still in the MR scanner. They were tested for recognition memory in a forced choice format outside the scanner approximately 5 minutes after the study was completed.
Sensory Activation Paradigm
To assess for potential systematic differences in the ability to mount an fMRI BOLD response across the three clinical groups, a sensory fMRI activation task was also performed on each volunteer during the same scanning session as the memory task. We employed a passive palm-brushing task. This activation paradigm also consisted of four full cycles. Each cycle was divided into a 21 second half cycle of rest alternated with a 21 second half cycle of right-hand stimulation. To ensure experimental uniformities, the palm brushing was performed by the same individual (MMM) on all subjects.
Image Acquisition
Whole brain asymmetric spin-echo echoplanar fMRI (TR 2750s, TE 50 ms, echo offset of −20 msec, FOV 24 cm, matrix 64 × 64) was performed using a 3.0T scanner (General Electric, Milwaukee, WI). Twenty-six contiguous 5 mm axial slices were selected to provide coverage of the entire brain. Each functional run consisted of 64 time course image volumes. The duration of the scan was limited so that the total exam time was tolerable for elderly subjects. Each set of multislice images was preceded by orbital navigator echoes in the sagittal, axial, and coronal planes to record subject motion during the scan.23 In addition, real-time calculation of activation maps allowed visual inspection of results, such that scans with obvious motion artifact could be discarded. Motion parameters from all three degrees of rotational freedom and three degrees of translational freedom obtained from the orbital navigator data were examined after each study. We discarded studies that had > 3 mm of translation or > 3 degrees of rotation. This resulted in a final data set of 11 Normals (3 discarded), 9 MCI (2 discarded) and 9 AD (1 discarded).
Each subject also underwent a 3D SPGR anatomic reference scan (TR = 17 msec, TE = 5 msec, FOV = 24 cm, matrix = 512 × 192, 1.5 mm-thick coronal images) during the same scanning session as the functional runs.
Data Analysis
The time series data were initially processed in AFNI.24 Correlation coefficients for the memory and sensory tasks were calculated using a staggered sinusoidal stimulus waveform function. The correlation coefficient was calculated between signal intensity cycling in MRI and the known timing of the activation paradigm on a pixel by pixel basis. A representative functional map of the memory task is shown in Figure 1. Retrospective motion correction of the EPI volumes within each fMRI time series was completed with the 3dReg AFNI plug-in. Next, the EPI volumes and high-resolution anatomic SPGRs were spatially registered for each run using ANALYZE.25
Figure 1.
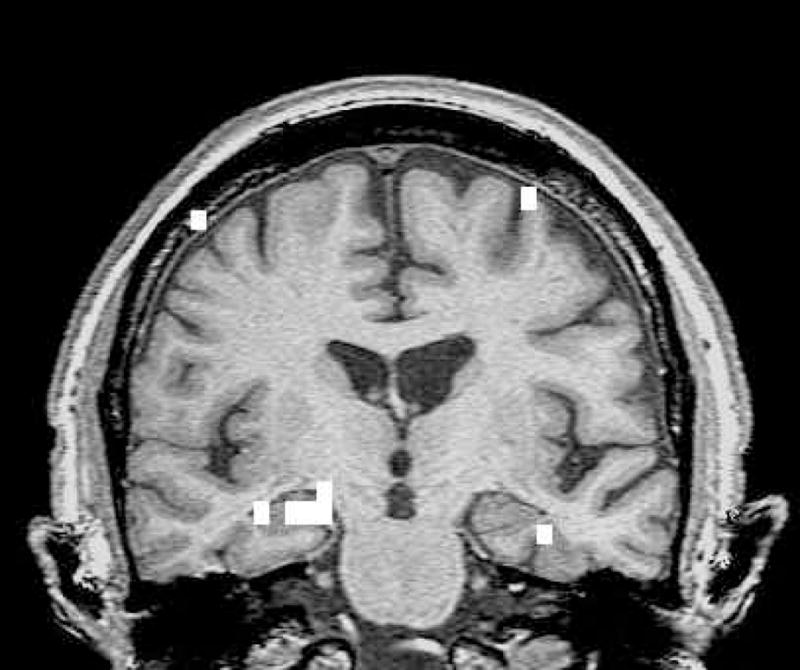
Memory activation map. Coronal image of a memory activation map of an AD patient (thresholded at r = .41). True positive activation in medial temporal lobe bilaterally, right greater than left.
A potential weakness in fMRI data analysis in general is the practice of selecting pixels with correlation coefficients that exceed a single arbitrarily determined threshold to represent “true” activation.26 An alternative approach, used here, is ROC curve analysis. In ROC analysis the relationship of true and false activation levels is probed without imposing a threshold to make a binary decision on whether or not a voxel is activated. Instead, a range of thresholds is considered. In order to perform ROC analyses, we defined neuroanatomic regions of interest (ROIs) in which activation should appear with a specific task and then accumulated probability tables for voxels in the region. The pertinent ROI for the memory task was the medial temporal lobe and for the sensory task was the anatomic pre- and post central gyri. ROIs were drawn on the high-resolution T1-weighted images of every subject, which had been spatially registered to that subject’s fMRI EPI image volume.
The ROI for the memory task encompassed the hippocampi, parahippocampal gyri, and fusiform gyri bilaterally. This ROI included the entire hippocampus along its anteroposterior extent.27 The posterior border of the medial temporal lobe ROI was determined by the slice on which the hippocampal fornix was visible in full profile. The anterior boundary was determined by the most anterior slice on which the head of the hippocampus was visualized. The lateral border was the occipito-temporal sulcus. The medial border of the ROI was the CSF-brain interface in the uncal cistern. The superior border was the hippocampal-CSF interface in the choroid fissure. Figure 2 shows the ROI for the memory encoding task.
Figure 2.
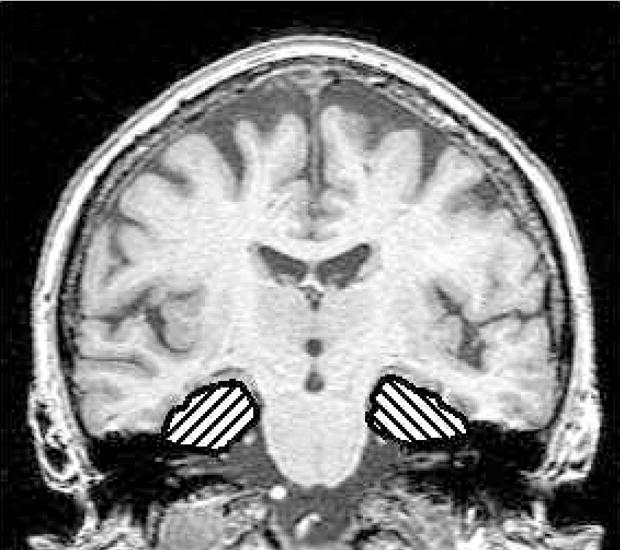
ROI for the memory task. Coronal image shows an example of the bilateral medial temporal lobe ROIs encompassing the hippocampus, fusiform, and parahippocampal gyri.
The ROI for the sensory task was the hand region of the sensorimotor homunculus. This can be determined unequivocally using reliable neuroanatomic landmarks on axial T1-weighted images to identify the pre- and post-central gyri and the central sulcus.28–36 The sensory ROIs were drawn on axial slices for each participant. Figure 3 shows the ROI for the sensory task.
Figure 3.
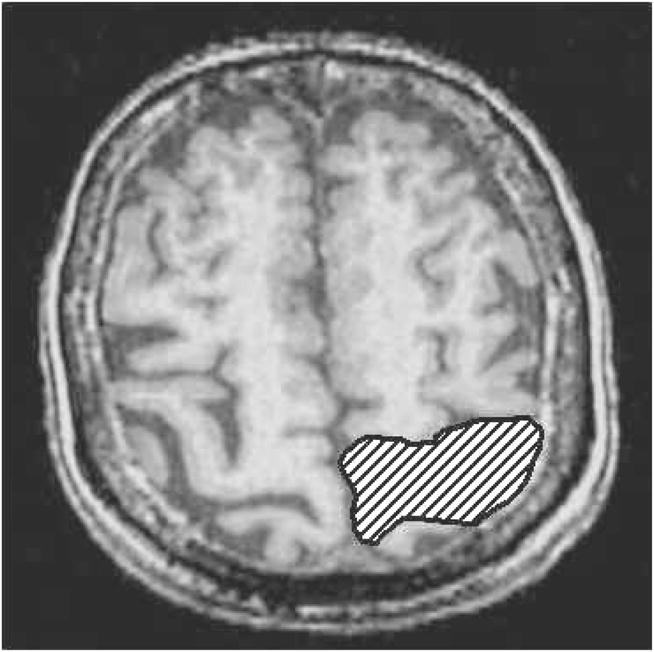
ROI for the sensory task. Axial image shows the ROI drawn over the left sensory-motor strip.
For a given fMRI time-series, a series of activation maps were generated by incrementally varying the correlation coefficient threshold from 0 to 1.0. At any given correlation coefficient threshold, the true positive fraction (TPF) was defined as the number of pixels in the ROI (i.e., medial temporal lobe for memory task; sensory-motor strip for sensory task) that exceeded the threshold divided by the total number of pixels in the ROI. The false positive fraction (FPF) was defined as an estimate of the distribution under the null hypothesis divided by the total number of pixels in the same ROI. The false positive activation estimates were obtained by permuting the temporal ordering of the time series data.37 For each voxel 2,000 random permutations of the time series data were generated. For each permutation of the time series data, a correlation coefficient was calculated. These pseudocorrelation coefficients for the permuted data were tabulated as false positive activation estimates within each of the ROIs. Thus, true positive correlation coefficient distributions in each ROI were compared to an estimate of the pseudo-correlation coefficient distribution under the null hypothesis (i.e., the false positive fraction) in the same ROI–medial temporal for the memory task and peri-Rolandic for the sensory paradigm. Traditional ROC curves were then generated with sensitivity (TPF) on the ordinate and 1 minus specificity (FPF) on the abscissa26,38,39 and plotted across a FPF range of 0 to 0.05.
Statistics
Non-parametric values were used for descriptive purposes and hypothesis testing. To test for an effect of clinical group membership on fMRI activation (i.e., area under the ROC curve), Spearman rank correlations were performed on the combined fMRI data for all three groups, treating group as an ordinal variable. A series of one-sided rank sum pair-wise comparisons were performed to test for differences in fMRI performance (area under the ROC curve across a FPF range of 0 to 0.05) between pairs of subject groups. These analyses were performed separately for the memory and sensory fMRI tasks. A Spearman rank correlation was also performed to test for an association between the area under the ROC curve versus performance on the free recall task among all 29 subjects combined.
Results
There were no differences between the groups in age, education, gender, and handedness. As expected, the groups were different on the MMSE22, Mattis Dementia Rating Scale40, percent retention on the Rey Auditory Verbal Learning Test41, and CDR Sum of Box scores21 (see Table 1).
Table 1.
Group demographics and clinical aspects of the subjects
| Normal Elderly (n = 11) | MCI (n = 9) | AD (n = 9) | |
|---|---|---|---|
| Age (mean) | 79.3 | 76.5 | 79.6 |
| Men/Women | 7/4 | 5/4 | 4/5 |
| Education (mean and range) | 12.9 (8,20) | 15.8 (12,20) | 13.8 (12,20) |
| Handedness R/L | 9/2 | 8/1 | 9/0 |
| CDR | 0 | 0.5 | 5 = .5/4 = 1.0 |
| CDR Sum of Boxes1 | 0 | .57 | 3.6 |
| MMSE1 | 29.1 | 28.4 | 23.4 (n = 8) |
| Mattis Dementia Rating Scale1 | 140.1 | 133.7 (n = 7) | 120.5 |
| AVLT % Retention1,2 | 12.2 | 6.4 (n = 7) | 5.2 |
| APOE, ε43 carrier/noncarrier/not available | 2/8/1 | 3/4/2 | 5/3/1 |
One-way ANOVA, p < .05, CDR not available in 2 MCI subjects
MOANS Age-corrected scaled scores (mean = 10, S.D. ± 3)
Subjects with a genotype of ε2/4 and ε3/4 were grouped as ε4 carriers; subjects with a genotype of ε2/3 and ε3/3 were grouped as ε4 noncarriers
Table 2 lists the median and inter-quartile range for the area under the ROC curve for each patient group for the memory and sensory tasks. A group membership effect was present on memory task activation performance (r = −.37, p = .02), but not on the sensory task. For the memory task, pair-wise rank sum tests indicated a difference between the Normals and MCIs (p = .03) and between the Normals and ADs (p = .04), but not between the MCIs and ADs (p = .5).
Table 2.
Area under the fMRI ROC curve by clinical group and activation task
| Task | Normal Elderly (n = 11) | MCI (n = 9) | AD (n = 9) |
|---|---|---|---|
| Memory* | 3.9 (3.3, 4.4) | 2.4 (1.9, 3.0) | 2.6 (1.6, 3.7) |
| Sensory | 5.5 (3.0, 5.7) | 3.5 (3.3, 5.4) | 7.6 (6.0, 10.0) |
p < .05
Values in the table are median and interquartile range, expressed as area × 10−3. Since the TPF and 1-FPF are proportions, they are unitless and the area under the curve (AUC) is also unitless. Pairwise comparisons were completed between each clinical group for both tasks. There was a significant difference between the Normals and MCIs (Rank Sum Test one-sided p = .03) and Normals and ADs (Rank Sum Test one-sided p = .04) for the memory task, but not between the MCIs and ADs. The difference between the groups on the sensory task was not significant.
Group ROC curves for the memory encoding task are shown in Figure 4. For a given fMRI time-series, as the correlation coefficient threshold is moved successively from low to high values, there is corresponding movement from the upper right to the lower left hand portion of the ROC curve. Activation performance of the Normals was better (ROC curve to the left of) than the MCI and AD groups. The MCI and AD groups were not significantly different. On a descriptive basis, seven of the AD patient’s individual ROC curves were to the right of (below) the Normals’ median. Conversely, nine of the Normals’ individual ROC curves were to the left (above) and two were to the right (below) of the AD patients’ median. Of the nine AD patients, six were taking Aricept when they completed this study. There was no association between use of Aricept and area under the ROC curve in the AD group.
Figure 4.

Memory ROC curves. Median and Interquartile ranges are plotted for the three groups: Normals are indicated by squares, MCIs by triangles, and ADs by circles.
As expected, there were also group differences on free recall performance immediately after the scanning run and on recognition performance completed outside the scanner (Table 3). The AD group consistently performed the most poorly - but their performance on the recognition test indicates that on average they were attending to the stimuli while in the scanner. There was an association between performance on the fMRI memory task (area under the ROC curve) and performance on post fMRI free recall (r = .39, p = .05) across all 29 subjects.
Table 3.
Post-scan memory testing
| Task | Normal Elderly (n = 11) | MCI (n = 9) | AD (n = 8) |
|---|---|---|---|
| Free Recall* (correct out of 12) | 6.1 | 4.2 | 1.75 |
| Recognition* (% correct) | 96.1 | 86.8 | 85.7 |
One-way ANOVA, p < .05
Discussion
Medial temporal lobe activation can be obtained in the elderly with an fMRI complex visual scene encoding paradigm. We found that activation in this brain region is greater in Normals than in patients with MCI and AD. The MCI patients were not significantly different from ADs. Our interpretation of this data is that the AD related neurodegenerative changes in the medial temporal lobe produce a functional (fMRI) impairment in MCIs that is of roughly equivalent magnitude to that observed in AD subjects. One measure of the potential sensitivity of any diagnostic test to early changes of AD is its ability to discriminate patients in the prodromal (MCI) phase from cognitively normal control subjects. Our results are encouraging in that regard. However, a more rigorous test of early diagnostic sensitivity is the ability of a test to predict whether or not individual elderly subjects will or will not eventually progress to AD. Our results do not address this issue at this time, but this is planned in the future.
We employed a passive sensory task as a control experiment to confirm that members of each clinical group on average had the potential to produce an equivalent BOLD response. There was no significant difference between the groups on the passive sensory task which we interpret to mean that the MCI and AD group’s depressed memory fMRI activation is not simply due to a globally impaired BOLD response. The results also imply that the depressed fMRI activation seen on the memory task in ADs and MCIs is not a non-specific disease related phenomenon, rather it is specific for the functional domain (memory) that clinically differs between cognitively normal and impaired subjects. When the memory and sensory results are considered together, they suggest that decreased temporal lobe activation may be a specific marker of medial temporal lobe dysfunction due to neurodegenerative disease, not a non-specific marker of old age.
Other groups have also assessed memory with fMRI in AD. Reduced fMRI activation has been reported in the hippocampal and entorhinal areas with memory tasks.6–9 Although we are not aware of any fMRI study that has specifically evaluated MCI subjects, our results agree in general with the aforementioned publications. Compensatory increased activation has been found in AD subjects during an encoding task in the medial parietal, posterior cingulate, and superior frontal regions.9 Using the ROC method, we were not in a position to evaluate all possible brain areas, and therefore cannot compare our results to studies in which extra temporal activation was evaluated.
Others have measured subregions of the medial temporal lobe (subiculum, entorhinal cortex) and found differences in memory activation among subgroups of individuals with memory decline relative to normals.8 The spatial resolution of the raw EPI images in our fMRI acquisition (3.75 mm × 3.75 mm × 5 mm) was coarser than the structures in question - the width of the entorhinal cortex or subiculum is in the range of three to four millimeters. We therefore elected to not attempt to isolate fMRI activation to specific subfields of the hippocampal formation (e.g., subiculum or CA1) or the entorhinal cortex.
There is no universally agreed upon method for analyzing fMRI data. The ROC method has advantages and disadvantages, and we do not mean to imply that it is necessarily the preferred method of fMRI analysis in all circumstances. An advantage is that it provides a systematic way to control for artifactual false positive “activation” in the image data across subjects. A disadvantage is that one must make a priori assumptions about where activation will occur. Unlike widely used brain mapping methods, the ROC method does not allow one to compare potential inter-group activation differences across the entire 3D volume of the brain. Despite this limitation, however, the ROC method may be quite useful for certain diagnostic questions, and it may also allow straightforward comparison of results between investigators. We employed well established functional-anatomic relationships for ROI definition in this study --medial temporal lobe for memory function, and para-central sulcus for primary sensory function. We felt that for this particular study, the improved reliability resulting from strict accounting of false positive artifactual activation was worth the associated trade-off of loss of anatomic coverage.
Another advantage of the ROC technique in general is the use of ROIs that are drawn on individual’s anatomy. Precise spatial registration among subjects is necessary if one is using the brain mapping approach to fMRI analysis - i.e., testing for inter-group differences in image space after spatial normalization. With the ROC approach, one doesn’t need to rely on precise spatial registration among subjects because the ROIs are drawn uniquely to each subject’s anatomy.
The particular implementation of the ROC method we used entailed calculating the true and false positive activation fraction in the same area of the brain for a given task. This has at least two useful properties. First, the number of pixels used to calculate the true positive and false positive fractions is identical. Second, different areas of the brain have their own unique noise properties. By using the same ROI for the true and false positive calculation, the noise properties are in theory better matched than if different areas of the brain were used to calculate the true vs. false positive fraction.
We acknowledge that there are inherent inaccuracies in tracing anatomic boundaries on near-isotropic T1-wighted images, and then superimposing these traces on spatially registered fMRI time series image data that were acquired as 5 mm thick axial slices. This is particularly true in the medial temporal lobe where susceptibility artifacts commonly cause anatomic distortion. Although we used a spin-echo echo planar acquisition specifically to minimize this phenomenon, some degree of distortion in susceptible areas is an inherent feature of most fMRI acquisition sequences. We drew the ROIs as “loose traces” around the medial temporal structures in order to account for the possibility of anatomic mismatch between the SPGR and the time series data. As a result we did not exclude areas of medial temporal activation from the ROI, but we did include some CSF in the medial temporal ROIs. Including CSF in the ROI decreased sensitivity by including inert–i.e., non-activating pixels -- in the calculation of TPF.
We limited the false positive fraction range of the ROC curves from 0 to 0.05. While this choice may be arbitrary, had we extended the false positive fraction range to greater than 0.05, we would have by definition been accepting greater than 5% false positive pixels as true positive activation. Limiting the false positive fraction range to less than 0.05 may be equivalent to the standard statistical practice of limiting the a priori probability of Type I error to less than 5%.
We did not directly assess responses during the memory activation paradigm, and therefore cannot guarantee that all subjects were fully attending to stimuli. We opted not to use handheld response units due to the difficulty subjects had in using the device as well as to reduce the probability of head motion during scans. Nonetheless, free recall on post scan testing corresponded to neurocognitive data and performance on the recognition test suggests that subjects were complying with directions.
Another limitation of this study, and fMRI in general, is the dropout rate due to motion corruption. Despite limiting the duration of each run as well as the entire scan time, we had to exclude 17% of our subjects because of excessive motion artifact. Advances in prospective motion correction engineering technology could substantially improve the reliability of fMRI for clinical purposes.
Our results indicate that the fMRI bold response of individuals with MCI during a memory paradigm is comparable to individuals with AD. Contrary to our expectation, the MCI and AD groups were indistinguishable in our data. Different activation paradigms and evaluation of activation in other brain regions with the objective of distinguishing MCI from AD may be a fruitful area for future studies. The results we have obtained while somewhat preliminary and focused only on medial temporal lobe activation, are nonetheless encouraging as they imply that fMRI is sufficiently sensitive to detect AD related changes in the prodromal, MCI, phase of the disease.
Acknowledgments
The authors thank Phil Rossman and Chris LaPlante for technical assistance.
Supported by NIH-NIA: AG19142, AG16574, & AG06786
References
- 1.Thulborn K, Martin C, Voyvodic J. Functional MR imaging using a visually guided saccade paradigm for comparing activation patterns in patients with probable Alzheimer’s disease and in cognitively able elderly volunteers. American Journal of Neuroradiology. 2000;21:524–531. [PMC free article] [PubMed] [Google Scholar]
- 2.Buckner R, Snyder A, Sanders A, Raichle M, Morris J. Functional brain imaging of young, nondemented, and demented older adults. Journal of Cognitive Neuroscience. 2000;12:24–34. doi: 10.1162/089892900564046. [DOI] [PubMed] [Google Scholar]
- 3.Johnson S, Saykin A, Baxter L, et al. The relationship between fMRI activation and cerebral atrophy: comparison of normal aging and Alzheimer disease. NeuroImage. 2000;11:179–187. doi: 10.1006/nimg.1999.0530. [DOI] [PubMed] [Google Scholar]
- 4.Saykin A, Flashman L, Frutiger S, et al. Neuroanatomic substrates of semantic memory impairment in Alzheimer’s disease: patterns of functional MRI activation. Journal of the International Neuropsychological Society. 1999;5:377–392. doi: 10.1017/s135561779955501x. [DOI] [PMC free article] [PubMed] [Google Scholar]
- 5.Prvulovic D, Hubl D, Sack A, et al. Functional imaging of visuospatial processing in Alzheimer’s disease. NeuroImage. 2002;17:1403–1414. doi: 10.1006/nimg.2002.1271. [DOI] [PubMed] [Google Scholar]
- 6.Kato T, Knopman D, Liu H. Dissociation of regional activation in mild AD during visual encoding. Neurology. 2001;57:812–816. doi: 10.1212/wnl.57.5.812. [DOI] [PubMed] [Google Scholar]
- 7.Rombouts S, Barkhof F, Veltman D, et al. Functional MR imaging in Alzheimer’s disease during memory encoding. American Journal of Neuroradiology. 2000;21:1869–1875. [PMC free article] [PubMed] [Google Scholar]
- 8.Small S, Perera G, Delapaz R, Mayeux R, Stern Y. Differential regional dysfunction of the hippocampal formation among elderly with memory decline and Alzheimer’s disease. Annals of Neurology. 1999;45:466–472. doi: 10.1002/1531-8249(199904)45:4<466::aid-ana8>3.0.co;2-q. [DOI] [PubMed] [Google Scholar]
- 9.Sperling R, Bates J, Chua E, et al. fMRI studies of associative encoding in young and elderly controls and mild Alzheimer’s disease. Journal of Neurology, Neurosurgery, and Psychiatry. 2003;74:44–50. doi: 10.1136/jnnp.74.1.44. [DOI] [PMC free article] [PubMed] [Google Scholar]
- 10.Burggren A, Small G, Sabb F, Bookheimer S. Specificity of brain activation patterns in people at genetic risk for Alzheimer disease. American Journal of Geriatric Psychiatry. 2002;10:44–51. [PubMed] [Google Scholar]
- 11.Smith C, Andersen A, Kryscio R, et al. Altered brain activation in cognitively intact individuals at high risk for Alzheimer’s disease. Neurology. 1999;53:1391–1396. doi: 10.1212/wnl.53.7.1391. [DOI] [PubMed] [Google Scholar]
- 12.Smith C, Andersen A, Kryscio R, et al. Women at risk for AD show increased parietal activation during a fluency task. Neurology. 2002;58:1197–1202. doi: 10.1212/wnl.58.8.1197. [DOI] [PubMed] [Google Scholar]
- 13.Bookheimer S, Magdalena H, Strojwas B, et al. Patterns of brain activation in people at risk for Alzheimer’s disease. New England Journal of Medicine. 2000;343:450–456. doi: 10.1056/NEJM200008173430701. [DOI] [PMC free article] [PubMed] [Google Scholar]
- 14.Petersen R, Smith G, Waring S, Ivnik R, Tangalos E, Kokmen E. Mild cognitive impairment clinical characterization and outcome. Archives of Neurology. 1999;56:303–308. doi: 10.1001/archneur.56.3.303. [DOI] [PubMed] [Google Scholar]
- 15.Petersen R, Smith G, Ivnik R, et al. Apolipoprotein E status as a predictor of the development of Alzheimer’s disease in memory impaired individuals. Journal of the American Medical Association. 1995;273:1274–1278. [PubMed] [Google Scholar]
- 16.Petersen R, Kokmen E, Tangalos E, Ivnik R, Kurland L. Mayo Clinic Alzheimer’s Disease Patient Registry. Aging. 1990;2:408–415. doi: 10.1007/BF03323961. [DOI] [PubMed] [Google Scholar]
- 17.Petersen R, Stevens J, Ganguli M, Tangalos E, Cummings J, DeKosky S. Practice parameter: Early detection of dementia: Mild cognitive impairment (an evidence based review). Report of the Quality Standards Subcommittee of the American Academy of Neurology. Neurology. 2001;56:1133–1142. doi: 10.1212/wnl.56.9.1133. [DOI] [PubMed] [Google Scholar]
- 18.Petersen R, Morris J. Clinical Features. In: Petersen R, editor. Mild Cognitive Impairment. New York: Oxford; 2003. pp. 15–39. [Google Scholar]
- 19.American Psychiatric Association. Diagnostic and Statistical Manual of Mental Disorders, Revised. Washington, D.C: American Psychiatric Association; 1987. [Google Scholar]
- 20.McKhann G, Drachman D, Folstein M, Katzman R, Price D, Stadlan E. Clinical diagnosis of Alzheimer’s disease: report of the NINCDS-ADRDA work group under the auspices of Department of Health and Human Services Task Force on Alzheimer’s disease. Neurology. 1984;34:939–944. doi: 10.1212/wnl.34.7.939. [DOI] [PubMed] [Google Scholar]
- 21.Morris J. The clinical dementia rating (CDR): current version and scoring rules. Neurology. 1993;43:2412–2414. doi: 10.1212/wnl.43.11.2412-a. [DOI] [PubMed] [Google Scholar]
- 22.Folstein M, Folstein S, McHugh P. “Mini-mental state”: A practical method for grading the cognitive state of patients for the clinician. Journal of Psychiatric Research. 1975;12:189–198. doi: 10.1016/0022-3956(75)90026-6. [DOI] [PubMed] [Google Scholar]
- 23.Ward H, Riederer S, Grimm R, Ehman R, Felmlee J, Jack C. Prospective Multiaxial Motion Correction for fMRI. Magnetic Resonance in Medicine. 2000;43:459–469. doi: 10.1002/(sici)1522-2594(200003)43:3<459::aid-mrm19>3.0.co;2-1. [DOI] [PubMed] [Google Scholar]
- 24.Cox R. AFNI: software for analysis and visualization of functional magnetic resonance neuroimages. Computers and Biomedical Research. 1996;29:162–173. doi: 10.1006/cbmr.1996.0014. [DOI] [PubMed] [Google Scholar]
- 25.Robb R, Hanson D. A software system for biomedical image analysis. Proceedings of Visualization and Biomedical Computing. 1990;1:507–518. [Google Scholar]
- 26.Constable R, Skudlarski P, Gore J. An ROC approach for evaluating functional brain MR imaging and post processing protocols. Magnetic Resonance in Medicine. 1995;34:57–64. doi: 10.1002/mrm.1910340110. [DOI] [PubMed] [Google Scholar]
- 27.Jack C, Petersen R, Xu Y, et al. Medial temporal atrophy on MRI in normal aging and very mild Alzheimer’s disease. Neurology. 1997;49:786–794. doi: 10.1212/wnl.49.3.786. [DOI] [PMC free article] [PubMed] [Google Scholar]
- 28.Beisteiner R, Gomiscek G, Erdler M, Teichtmeister C, Moser E, Deecke L. Comparing localization of conventional functional magnetic resonance imaging and magnetoencephalography. European Journal of Neuroscience. 1995;7:1121–1124. doi: 10.1111/j.1460-9568.1995.tb01101.x. [DOI] [PubMed] [Google Scholar]
- 29.Berger M, Cohen W, Ojemann G. Correlation of motor cortex brain mapping data with magnetic resonance imaging. Journal of Neurosurgery. 1990;72:383–387. doi: 10.3171/jns.1990.72.3.0383. [DOI] [PubMed] [Google Scholar]
- 30.George J, Aine C, Mosher J, et al. Mapping function in the human brain with magnetoencephalography, anatomical magnetic resonance imaging, and functional magnetic resonance imaging. Journal of Clinical Neurophysiology. 1995;12:406–431. doi: 10.1097/00004691-199509010-00002. [DOI] [PubMed] [Google Scholar]
- 31.Iwasaki S, Nakagawa H, Fukusumi A, et al. Identification of pre-and post-central gyri on CT and MR images on the basis of the medullary pattern of cerebral white matter. Radiology. 1991;179:207–213. doi: 10.1148/radiology.179.1.2006278. [DOI] [PubMed] [Google Scholar]
- 32.Orrison W, Davis L, Sullivan G, Mettler F, Flynn E. Anatomic localization of cerebral cortical function by magnetoencephalography combined with MR imaging and CT. American Journal of Neuroradiology. 1990;11:713–716. [PMC free article] [PubMed] [Google Scholar]
- 33.Rumeau C, Tzourio N, Murayama N, et al. Location of hand function in the sensorimotor cortex: MR and functional correlation. American Journal of Neuroradiology. 1994;15:567–572. [PMC free article] [PubMed] [Google Scholar]
- 34.Sobel D, Gallen C, Schwartz B, et al. Locating the central sulcus: comparison of MR anatomic and magnetoencephalographic functional methods. American Journal of Neuroradiology. 1993;14:915–925. [PMC free article] [PubMed] [Google Scholar]
- 35.Walter H, Kristeva R, Knorr U, et al. Individual somatotopy of primary sensorimotor cortex revealed by intermodal matching of MEG, PET, and MRI. Brain Topography. 1992;5:183–187. doi: 10.1007/BF01129048. [DOI] [PubMed] [Google Scholar]
- 36.Yetkin F, Papke R, Mark L, Daniels D, Mueller W, Haughton V. Location of the sensorimotor cortex: functional and conventional MR compared. American Journal of Neuroradiology. 1995;16:2109–2113. [PMC free article] [PubMed] [Google Scholar]
- 37.Bullmore E, Brammer M, Williams S, et al. Statistical methods of estimation and inference for functional MR image analysis. Magnetic Resonance in Medicine. 1996;35:261–277. doi: 10.1002/mrm.1910350219. [DOI] [PubMed] [Google Scholar]
- 38.Skudlarski P, Constable R, Gore J. ROC analysis of statistical methods used in functional MRI: individual subjects. NeuroImage. 1999;9:311–329. doi: 10.1006/nimg.1999.0402. [DOI] [PubMed] [Google Scholar]
- 39.Sorenson J, Wang X. ROC methods for evaluation of fMRI techniques. Magnetic Resonance in Medicine. 1996;36:737–744. doi: 10.1002/mrm.1910360512. [DOI] [PubMed] [Google Scholar]
- 40.Mattis S. Dementia Rating Scale: Professional Manual. Odessa, FL: Psychological Assessment Resources, Inc; 1998. [Google Scholar]
- 41.Rey A. The Clinical Examination in Psychology. Paris: Presses Universitaires de France; 1964. L’examen Clinique en Psychologie. [Google Scholar]