Abstract
Overadjustment is defined inconsistently. This term is meant to describe control (eg, by regression adjustment, stratification, or restriction) for a variable that either increases net bias or decreases precision without affecting bias. We define overadjustment bias as control for an intermediate variable (or a descending proxy for an intermediate variable) on a causal path from exposure to outcome. We define unnecessary adjustment as control for a variable that does not affect bias of the causal relation between exposure and outcome but may affect its precision. We use causal diagrams and an empirical example (the effect of maternal smoking on neonatal mortality) to illustrate and clarify the definition of overadjustment bias, and to distinguish overadjustment bias from unnecessary adjustment. Using simulations, we quantify the amount of bias associated with overadjustment. Moreover, we show that this bias is based on a different causal structure from confounding or selection biases. Overadjustment bias is not a finite sample bias, while inefficiencies due to control for unnecessary variables are a function of sample size.
Epidemiologists often attempt to estimate the total (ie, direct and indirect) causal effect of an exposure (compared with a reference level) on an outcome of interest. Although confounding1 and selection biases2,3 have been discussed extensively in the epidemiologic literature, the concept of “overadjustment” has had relatively little attention. The definition of overadjustment remains vague and the causal structure of this concept has not been well described.
The Dictionary of Epidemiology4 cites a seminal paper by Breslow5 in broadly defining overadjustment as “Statistical adjustment by an excessive number of variables or parameters, uninformed by substantive knowledge (eg, lacking coherence with biologic, clinical, epidemiological, or social knowledge). It can obscure a true effect or create an apparent effect when none exists.” Rothman and Greenland6 discuss overadjustment in the context of intermediate variables: “Intermediate variables, if controlled in an analysis, would usually bias results towards the null.…. Such control of an intermediate may be viewed as a form of overadjustment.” One also finds reference to the term overadjustment in settings with unnecessary control for variables.7 In summary, overadjustment sometimes means control (eg, by regression adjustment, stratification, restriction) for a variable that (a) increases rather than decreases net bias or (b) affects precision without affecting bias.
In an attempt to clarify these concepts, we use causal diagrams to define overadjustment bias and to distinguish overadjustment bias from confounding, selection bias, and unnecessary adjustment. Furthermore, we define unnecessary adjustment as control for a variable that does not affect bias but does affect precision. We illustrate these concepts with an example estimating the total effect of maternal smoking on neonatal mortality, and simulations to describe finite sample behavior.
CAUSAL DIAGRAMS
Ad-hoc causal diagrams have been used to encode investigators’ knowledge about systems of variables in epidemiology and biologic sciences for decades (eg,5,8). Pearl9 formalized causal diagrams as directed acyclic graphs (DAGs), providing investigators with powerful tools for bias assessment. A set of rules for causal diagrams are succinctly described by Greenland et al10 and in the appendix of Hernan et al.11 Briefly, causal diagrams link variables by single-headed (ie, directed) arrows that represent direct causal effects. To represent chains of causation in time, Pearl’s formalization of causal diagrams does not allow a directed path9 (ie, a trail of arrows) to point back to a prior variable (ie, the diagrams are acyclic). For a diagram to represent a causal system, all shared causes of any pair of variables included on the graph must also be included on the graph. The absence of an arrow between 2 variables is a strong claim of no direct effect of the former variable on the latter. We denote control (eg, regression adjustment, stratification, restriction) by placing a box around the controlled variable.
Causal Diagrams for Overadjustment Bias
We define overadjustment bias as control for an intermediate variable (or a descending proxy for an intermediate variable) on a causal path from exposure to outcome. DAG 1 provides a causal diagram representing the simplest case of overadjustment bias. For example, Bodnar et al12 evaluated the mediating role of triglycerides (M in our notation) in the association between prepregnancy body mass index (E in our notation) and preeclampsia (D in our notation), which is consistent with this causal diagram.
 |
(1) |
In this scenario, one can consistently estimate the total causal effect of exposure E on outcome D using common regression techniques by ignoring the intermediate variable M. However, if one controls (ie, adjusts, stratifies, restricts) for the intermediate variable M, which is on a causal pathway between exposure and outcome, the total causal effect of the exposure on the outcome cannot be consistently estimated. Yet, as Cole and Hernán et al11 and others have noted, such adjustment can provide correct estimates of the controlled direct causal effect with added assumptions.13–16 With control for M, the observed association between the exposure E and outcome D will typically be a null-biased estimate of the total causal effect. In cases where the only causal path between exposure E and outcome D is that path mediated through M (ie, no direct effect of E on D, which requires a perturbation of DAG 1), the observed association between exposure E and outcome D will typically be null in expectation, conditional on the intermediate M.
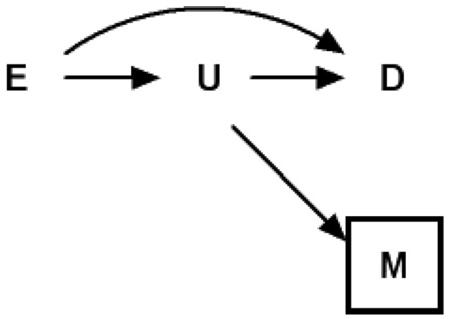
DAG 2 provides a second causal diagram representing perhaps a more common case of overadjustment bias. This diagram encodes the assumption that exposure E and unmeasured intermediate U both affect the outcomes D and M. Weinberg17 described this case in her example of adjusting for prior history of spontaneous abortion (M). An underlying abnormality in the endometrium (U) is the unmeasured intermediate caused by smoking (E), and is a cause of prior (M) and current (D) spontaneous abortion.
 |
(2) |
Note that in DAG 2 the measured variable M is a “descending” proxy for the intermediate variable U, which itself is typically unmeasured; one can think of M as a mismeasured version of U under a classic measurement error model, or as an event caused by U. One can again consistently estimate the total causal effect of exposure E on outcome D using common regression techniques by ignoring M, the imperfect proxy for the unmeasured intermediate variable U. However, if one controls (ie, adjusts, stratifies, restricts) for the variable M in DAG 2, which is a proxy for variable U (on a causal pathway between exposure E and outcome D) the total causal effect of the exposure on the outcome again cannot be consistently estimated. In such cases, one could place a half-box about U to imply the partial adjustment for the unmeasured U that occurs with adjustment for the measured M.
In the cases described by DAG 2, the observed association between the exposure E and outcome D will typically be biased toward the null with respect to the total causal effect. But in such cases, the null-bias will be attenuated compared with DAG 1. Even in the (extreme) case where the only causal path between exposure E and outcome D is mediated through the unmeasured proxy U (ie, no direct effect of E on D, a perturbation of DAG 2), the observed association between exposure and outcome will not be completely negated in expectation. Intuitively, one can see that adjustment for M, where M is an imperfect measure of U, leaves a partially open pathway from E through U to D. Because mismeasurement of exposures is ubiquitous in general18,19 and with pathway markers in particular, it has become popular practice to try to adjust for a proxy variable of the unmeasured intermediate variable in an attempt to decompose the effect measure into direct and indirect components. Investigators employing such approaches should be wary of the inability of proxies to completely close pathways for which they proxy.11
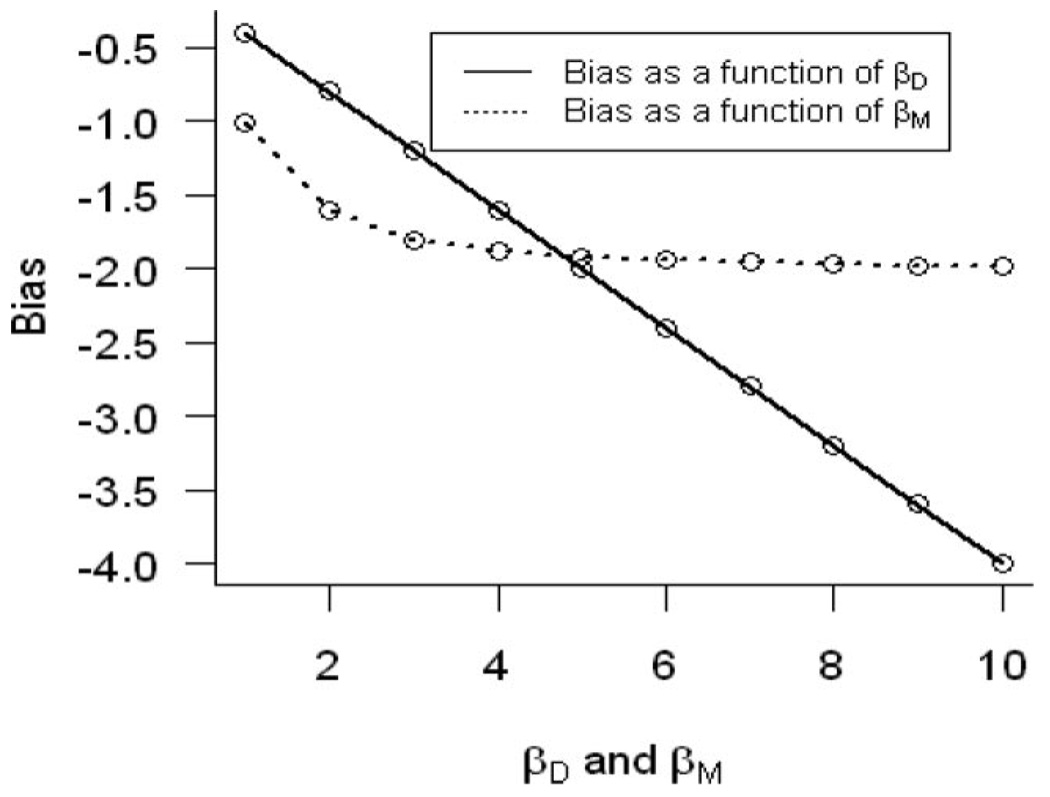
Figure 1 quantifies the overadjustment bias (ie, bias in the total effect estimate) under general linear models assumptions (ie, the direction of the bias will be the same under generalized linear models assumptions but the magnitude may differ depending on the link function), where we define (assuming no direct effect of E on D):
| (1) |
where U is an unmeasured intermediate effect, M is the measured descending proxy of the unmeasured intermediate variable (U), E is the exposure of interest, and D is the outcome of interest.
FIGURE 1.
Bias estimating the total effect of exposure of interest E on the outcome D as a function of the direct effect of the unmeasured intermediate (U) variable (βD) on the outcome D and the direct effect of the unmeasured intermediate (U) variable on another independent descendent (M) of U denoted by βM.
Estimating the unknown parameters in (1) is equivalent to estimating:
However, if one adjusts for M in estimating the effect of E, one would obtain approximately:
| (2) |
Therefore, the bias arising from using model (2) to estimate the total effect of E on D is . One can see in Figure 1 that the bias is a linear function of βD, βU, and a quadratic function of βM. In the case of joint continuously distributed variables, the bias for the total causal effect of exposure E on disease D, conditioning on the measured proxy M, is simply the difference in the partial Pearson correlation between exposure E and disease D, controlling for M, and the simple Pearson correlation between exposure E and disease D.
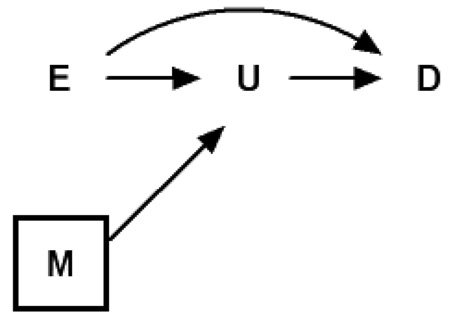
DAG 3 is a duplicate of DAG 2, except that the proxy variable M for unmeasured U is now an “ascending” rather than a “descending” proxy.
 |
(3) |
In DAG 3, adjustment for M will not block the path from exposure E to outcome D, even partially. This is because holding M constant does not alter the effect of exposure E on outcome D through intermediate U. Therefore, ascending proxies should not be used as markers of pathways when attempting to decompose total causal effects. DAG 3 could depict an alternate conception of the study of the mediating effect of triglycerides20; here M would represent some other cause of change in triglycerides, such as dietary or lifestyle factors. There is a lack of bias under general or generalized linear models assumptions, where we defined (assuming no direct effect of E on D):
| (3) |
In the M-adjusted model evaluating the effects of E on D, we would estimate:
and in the crude model, we would estimate:
Therefore, the bias of using the M adjusted model to estimate the effect of E on D is given by . Bias is absent regardless of the magnitude of βUM. One may note the similarity of DAG 3 to standard representations of instrumental variables.21,22 Indeed, in DAG 3, M is an instrument for the effect of intermediate U on outcome D. However, our focus here is the effect of exposure E on outcome D.
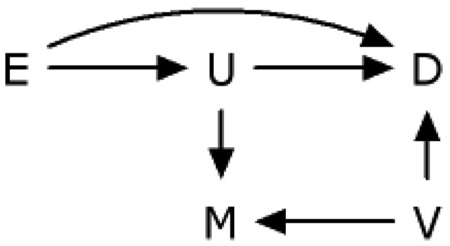
DAG 4 is a generalization of DAG 2. This illustrates a general problem with the control of variables affected by exposure,13,16 such as U or M.
 |
(4) |
Adjusting for a descending proxy M of an unmeasured intermediate variable U (or U itself, if it were measured), is susceptible to collider-stratification bias.23 In this instance, the unmeasured common cause V of the proxy variable M and the outcome variable D causes additional bias in the association between exposure E and outcome D within levels of M. DAG 4 is one of 10 possible cases extending DAG 2 to allow unmeasured common causes of any pair or triad of variables on DAG 2.
Unnecessary Adjustment
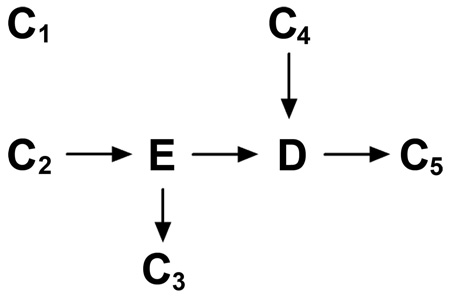
We define unnecessary adjustment as occurring when controlling for a variable whose control does not affect the expectation of the estimate of the total causal effect between exposure and outcome. Unnecessary adjustment occurs in 4 primary cases represented in DAG 5, namely: (a) adjusting for a variable completely outside the system of interest (C1), (b) adjusting for a variable that causes the exposure only (C2), (c) adjusting for a variable whose only causal association with variables of interest is as a descendent of the exposure and not in the causal pathway (C3), and (d) adjusting for a variable whose only causal association with variables of interest is as a cause of the outcome (C4). The result of adjustment for such variables is that the total causal effect of exposure on outcome remains unchanged (in expectation). We denote these cases as “bias-neutral adjustment.” However, there may be precision gain or loss which depends on the relationship between the exposures of interest (E), the unnecessary adjustment variable (C1–C4), the outcome of interest and the given sample size. Adjustment for these types of variables could harm rather than improve one’s estimate in terms of the combination of bias and variance.
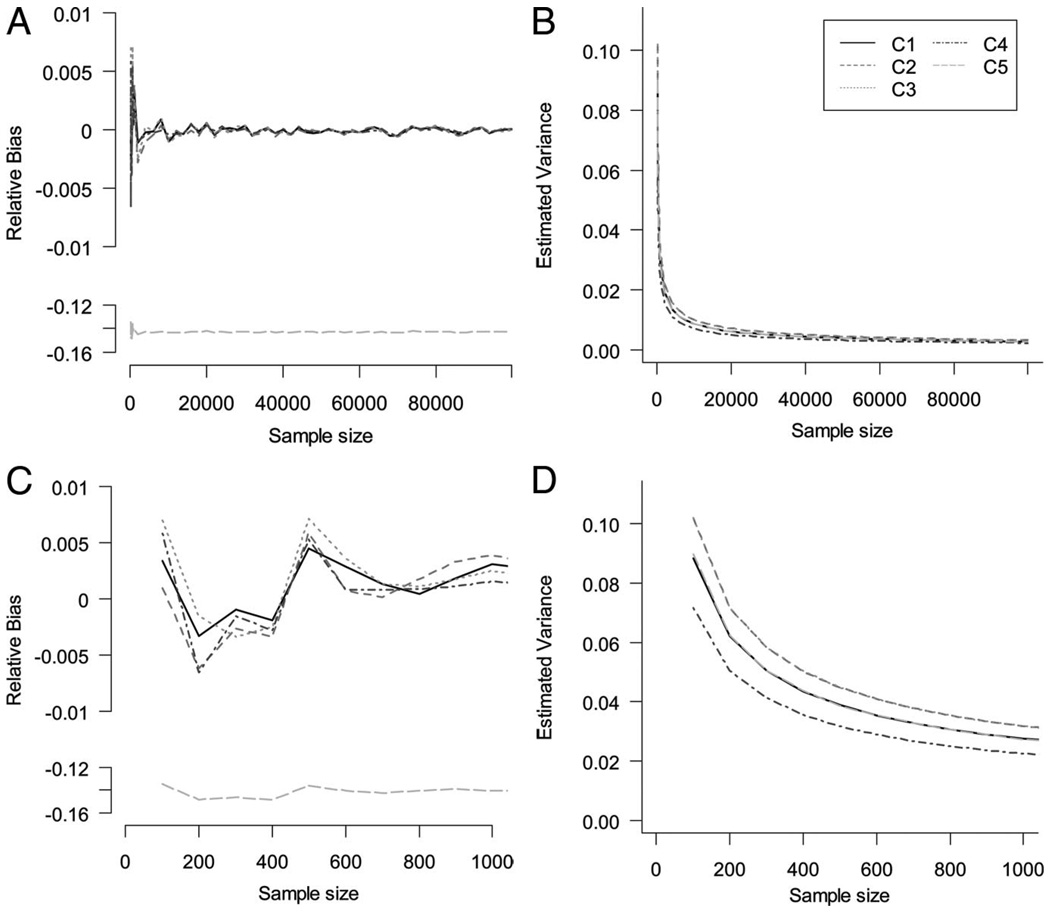
We performed a simulation study with the goal of estimating the total effect between the exposure variable E and the outcome variable D and adjusted for 5 factors including adjusting for a variable whose only causal association with variables of interest is as a descendent of the outcome (C5), to evaluate this trade-off in the linear setting. The causal relation among these 7 factors is depicted in DAG 5. For simplicity, we assumed that C1, C2, and C4 follow standard normal distributions. E is also assumed to be normally distributed, with a mean 10 and a standard deviation of 1. Moreover, we assume that all the relationships in this system are linear, and we set the coefficients for all these associations at 0.5.
 |
(5) |
We set C1–C5 to appear in the linear models one at a time, corresponding to lines C1–C5 in Figure 2. Sample size varies according to the x axis. We vary the sample size of the study from 100 to 100,000 by orders of magnitude. For each sample size, 1000 iterations were implemented and the Monte Carlo mean and variance were estimated.
FIGURE 2.
Large and small sample size properties on Monte Carlo relative bias and variance of total effect estimates after adjusting for unnecessary variables.
Figure 2 depicts the relative bias and variance of total effect estimates after adjusting for unnecessary variables (C1–C4). The relative bias is null for both large and small samples (Fig. 2A, C). We observed a small reduction in variance (gain in efficiency) in the specific simulated situation described here for the estimated total effect depicted in Figure 2B and D when estimating the total effect when adjusting for C1–C4.
The pursuit of unbiased effect estimates is the primary concern when evaluating the presence or absence of overadjustment bias. On the other hand, in the case of unnecessary adjustment effect estimates are unbiased, and the focus turns then to the effect of adjustment on precision. These scenarios have been studied extensively in the literature, especially the case of C4. As noted above, the gain or loss of efficiency is based on the type of model (linear or nonlinear). In the linear setting (shown above), the inclusion of extraneous determinants of the outcome (a predictor, but not a confounder of the outcome) will result in gains in efficiency for the estimation of the association of interest. In particular, a strong association of C4 with outcome (D) improves precision, whereas in the confounding case (not shown here) a strong association of C4 with exposure (E) alone may have a detrimental effect. This is caused by a reduction in the residual sums of squares after the extraneous variable is accounted for.
Robinson and Jewell showed no similar practical gain in nonlinear settings, and one must pay for the inclusion of the extraneous determinant with (at least) 1 degree of freedom.24 Specifically, in the logistic model, associations of both exposure and outcome with C4 have detrimental effects on precision for logistic regression estimators of the total effect. Thus, although adjustment for predictive covariates in classic linear regression can result in either increased or decreased precision, adjustment by logistic regression will result in a loss of precision.
In addition, when the measure of association is noncollapsible (eg, odds,25 incidence density,26 or hazard ratios6), adjusted analyses of C4 may provide different results compared with crude analyses and thus confuse interpretation, because the conditional and marginal causal effects may differ in nonlinear models due to noncollapsibility. Robinson and Jewell24 discussed this topic in detail. They demonstrated that the asymptotic relative precision of β* to β̂ is less than or equal to 1, where β* (estimator of the total effect) is the estimator of the β coefficient from a crude logistic regression and β̂ is the analogous estimator from a model adjusting for a determinant of outcome that is unassociated with exposure. Therefore, in this case the standard error for the crude association is smaller than or equal to the adjusted. However, the adjusted point estimate (an estimate of the covariate-conditional effect) will be larger than or equal to the crude (an estimate of the marginal effect) and biased (very slightly if the disease is rare). The relatively small decrease in the standard error with adjustment is typically outweighed by the relatively large increase in the point estimate with adjustment. Thus, statistical power to test β = 0 using the adjusted estimand is increased, but it is for a different estimand (ie, the covariate-conditional effect rather than the marginal effect).
In the linear model, and as depicted in Figure 2, bias is introduced in C5 when the association between the outcome and the extraneous variable is strong relative to the error in the extraneous variable; adjustment in this case is unwarranted and in extreme cases can cause large bias and loss of precision. Furthermore, this scenario is especially susceptible to collider stratification by an unmeasured variable.27
Example: The Effect of Maternal Smoking and Neonatal Mortality
As an example to illustrate overadjustment bias, we examine the often-studied relation between birth weight and neonatal mortality. Investigators have speculated for decades on possible causes of neonatal mortality, and have consistently demonstrated that birth weight is a strong predictor of neonatal and infant mortality.28,29 When assessing the effect of possible risk factors for neonatal and infant mortality (eg, maternal smoking,28 multiple pregnancies,30 placenta previa31), birth weight stratification or adjustment is frequently undertaken. We follow the premises for a causal diagram as proposed by Basso et al.32 They demonstrated that it is plausible for the observed association between birth weight and neonatal mortality to be due to an unmeasured confounder. Under this conjecture, adjustment for birth weight in the study of neonatal mortality would represent overadjustment.
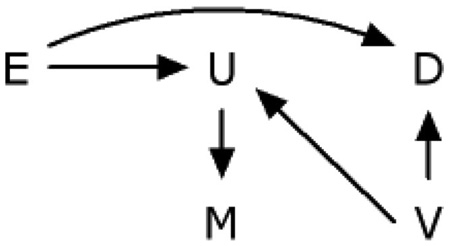
We identified all infants born alive in the United States in 1999–2001 (n = 11,597,620) through the national linked birth/infant death data sets assembled by the National Center for Health Statistics.33 These records contain information on dates and causes of death, birth weight, maternal smoking, and other medical and sociodemographic characteristics systematically recorded on the US birth certificates. Neonatal mortality rates (denoted by the variable D in the causal diagram) were defined as the number of deaths within the first 28 days of life per 100,000 live births. Maternal smoking (denoted by the variable E in the causal diagram) was defined by self-report of prepregnancy smoking. Unmeasured fetal development during pregnancy is denoted by the variable U in the causal diagram. Birth weight can be thought of as a descending proxy for the unmeasured fetal development measured with error (denoted by the variable M in the causal diagrams). Following Basso et al,28 we assume that the relation between birth weight and infant mortality is due to unmeasured confounding by a condition such as malformation, fetal or placental aneuploidy, infection, or imprinting disorder (denoted by the variable V in DAG 6).
 |
(6) |
E = Prepregnancy maternal smoking
D = Neonatal mortality
U = Unmeasured fetal development during pregnancy
V = Unmeasured confounder, such as imprinting disorder
M = Birth weight
Our analysis excluded data from California (due to lack of smoking information), as well as data from infants with missing information on birth weight or maternal smoking, resulting in 10,035,444 live births. We used risk ratios and differences to quantify the association between maternal smoking and neonatal mortality, and 95% confidence intervals (CIs) to quantify precision.
The neonatal mortality rate was 219 per 100,000 live births, and 12% of mothers reported smoking. The unadjusted risk ratio for the association between maternal smoking and neonatal mortality was 2.49 (95% CI = 2.41–2.56). Adjustment for birth weight (M in the graph) by stratification attenuated the risk ratio to 2.03 (1.97–2.09). Therefore, control (ie, adjustment) for birth weight resulted in a risk ratio 18% smaller (1–2.03/2.49) than the unadjusted risk ratio.
The unadjusted risk difference for the association between maternal smoking and neonatal mortality was 274 per 100,000 (95% CI = 262–287). Adjustment for birth weight by stratification attenuated the risk difference to 228 per 100,000 (216–247). Therefore, control (ie, adjustment) for low birth weight resulted in a risk difference 17% smaller (1–228/274) than the unadjusted risk difference. This difference in the measure of association is likely due to the fact that smoking causes changes in U (changes in fetal growth), which affect birth weight and neonatal mortality separately. Using empirical methods for confounding adjustment, the differences between the estimated crude and adjusted risk ratios and differences from this data support the premise of adjusting for birth-weight when looking at the total causal effect of smoking on neonatal mortality. However, the data and prior knowledge are consistent with the change in estimate being due to overadjustment bias; and therefore adjustment may be unwise. Instead, clearly stating a causal question to be addressed, depicting the possible data generating mechanisms using causal diagrams, and measuring indicated confounders (or conducting a sensitivity analysis) are paramount for such cases.
One situation that is prone to create confusion is based on the fact that the adjusted model in this case for birth weight would not be considered overadjustment bias when estimating indirect and direct effects. Such conjectures beg redrawing of DAG 6 to allow a direct causal effect form birth weight to neonatal mortality. In summary, the data alone do not identify causal relationships.
CONCLUSION
The term overadjustment is sometimes used to describe control (eg, regression adjustment, stratification, restriction) for a variable that increases rather than decreases net bias, or that decreases precision without affecting bias. In many situations adjustment can increase bias; this may be, for example, due to a reduction in the total causal effect by controlling for an intermediate variable or due to an induction of associations by collider-stratification3,23 (ie, selection bias arising due to conditioning on a shared effect). In the second case (which we term unnecessary adjustment), noncollapsibility1 of an effect estimate may cause a difference between the uncontrolled and controlled effect estimates, even though no systematic error is present. Moreover, adjusting for surrogates (proxies) of intermediate variables, either ascending or descending, when the desired intermediate variable itself is unmeasured, can have different effects on measures of association depending on the nature of the proxy.
For estimation of total causal effects, it is not only unnecessary but likely harmful to adjust for a variable on a causal path from exposure to disease, or for a descending proxy of a variable on a causal path from exposure to disease. As previously discussed,13,34 estimation of direct effects of exposures (such as maternal smoking) on outcomes (such as infant mortality) by controlling for an intermediate variable (such as low birth weight) are not valid when there are unmeasured shared causes of low birth weight and infant mortality. Such estimates are vulnerable to collider-stratification bias or exposure interactions with the intermediate variable.14
Overadjustment bias is not induced by effect decomposition per se when the proper statistical methods are applied. Robins and Greenland,16 and Joffe et al35 provided the conditions by which the estimation of the direct and indirect effects can be separated, and the proper derivation to do so nonparametrically. Overadjustment bias is induced in the estimation of the total effect by adjusting for an intermediate variable or a descendent of the unmeasured intermediate variable. In this paper, we focused on the estimation of the total causal effect, however, overadjustment bias or unnecessary adjustment may also occur while attempting to decompose the effects; the principles described in this paper are still valid. Here, we have attempted to clarify the concept of overadjustment bias and to separate overadjustment bias from the concept of unnecessary adjustment using DAGs. The nonparametric nature of causal diagrams is their strength and at the same time their pitfall, in that they provide an easy way to identify the source of bias but not the magnitude. After describing the overadjustment causal structure and demonstrating the source of bias, we made linear assumptions to quantify the bias. Our simulation study was not comprehensive to evaluate the effects on efficiency, in that it did not cover all scenarios of effect size, type of outcome and type of mode. This has been extensively studied by others.24 We demonstrated that, even in the linear case, the overadjustment bias is structural and not negligible, and therefore overadjustment is unwarranted (even when by a descending proxy). On the other hand, when estimating total effects, sometimes one can improve (or harm) efficiency without affecting bias by adjusting for variables we defined as unnecessary, or by increasing the study sample size. As an alternative, in these cases one might refer to it as “bias-neutral adjustment.”
In conclusion, when estimating the total effect, we define overadjustment bias as control for an intermediate variable (or a descending proxy for an intermediate variable, but not an ascending proxy) on a causal path from exposure to outcome. We define unnecessary adjustment as any adjustment for variables that does not alter the expectation of the average causal effect of interest but may affect precision. Moreover, overadjustment is a type of bias that is based on a different structure from confounding or selection biases and is not removable in an infinite sample, while inefficiencies due to control for unnecessary variables are a function of sample size.
An important point is that ascending proxies of unmeasured intermediate variables are of little use in decomposing total causal effects into direct and indirect components. The present work reinforces the notion that one is fairly well-protected from particular analytic pitfalls if one follows the mantra not to control for factors affected by exposure.
For analytical proof of the results presented in this paper in the linear case see the Online Appendix (http://links.lww.com/A1099).
Acknowledgments
Supported by the Intramural Research Program of the Eunice Kennedy Shriver National Institute of Child Health and Human Development; National Institutes of Health (to E.F.S.). The NIH, NIAID through R03-AI 071763 (to S.C.). Chercheur-boursier award, and by core support to the Montreal Children’s Hospital Research Institute, from the Fonds de Recherche en Santé du Quebec (to R.P.).
Footnotes
Supplemental digital content is available through direct URL citations in the HTML and PDF versions of this article (www.epidem.com).
REFERENCES
- 1.Greenland S, Morgenstern H. Confounding in health research. Annu Rev Public Health. 2001;22:189–212. doi: 10.1146/annurev.publhealth.22.1.189. [DOI] [PubMed] [Google Scholar]
- 2.Hernan MA, Alonso A, Logroscino G. Cigarette smoking and dementia: potential selection bias in the elderly. Epidemiology. 2008;19:448–450. doi: 10.1097/EDE.0b013e31816bbe14. [DOI] [PubMed] [Google Scholar]
- 3.Hernan MA, Hernandez-Diaz S, Robins JM. A structural approach to selection bias. Epidemiology. 2004;15:615–625. doi: 10.1097/01.ede.0000135174.63482.43. [DOI] [PubMed] [Google Scholar]
- 4.Porta M, editor. A Dictionary of Epidemiology. 5th edn. New York: Oxford University Press; 2008. [Google Scholar]
- 5.Breslow N. Design and analysis of case control studies. Annu Rev Public Health. 1982;3:29–54. doi: 10.1146/annurev.pu.03.050182.000333. [DOI] [PubMed] [Google Scholar]
- 6.Rothman K, Greenland S. Modern Epidemiology. 2nd ed. Philadelphia: Lippincott-Raven; 1998. [Google Scholar]
- 7.Rothman KJ, Greenland S. Causation and causal inference in epidemiology. Am J Public Health. 2005;95(suppl 1):S144–S150. doi: 10.2105/AJPH.2004.059204. [DOI] [PubMed] [Google Scholar]
- 8.Wright S. Correlation and causation. Jf Agric Res. 1921;20:557–585. [Google Scholar]
- 9.Pearl J. Causal diagrams for empirical research. Biometrika. 1995;82:669–710. [Google Scholar]
- 10.Greenland S, Pearl J, Robins JM. Causal diagrams for epidemiologic research. Epidemiology. 1999;10:37–48. [PubMed] [Google Scholar]
- 11.Hernan MA, Hernandez-Diaz S, Werler MM, Mitchell AA. Causal knowledge as a prerequisite for confounding evaluation: an application to birth defects epidemiology. Am J Epidemiol. 2002;155:176–184. doi: 10.1093/aje/155.2.176. [DOI] [PubMed] [Google Scholar]
- 12.Bodnar LM, Ness RB, Markovic N, Roberts JM. The risk of preeclampsia rises with increasing prepregnancy body mass index. Ann Epidemiol. 2005;15:475–482. doi: 10.1016/j.annepidem.2004.12.008. [DOI] [PubMed] [Google Scholar]
- 13.Cole SR, Hernan MA. Fallibility in estimating direct effects. Int J Epidemiol. 2002;31:163–165. doi: 10.1093/ije/31.1.163. [DOI] [PubMed] [Google Scholar]
- 14.Kaufman JS, MacLehose RF, Kaufman S. A further critique of the analytic strategy of adjusting for covariates to identify biologic mediation. Epidemiol Perspect Innov. 2004;1:4. doi: 10.1186/1742-5573-1-4. [DOI] [PMC free article] [PubMed] [Google Scholar]
- 15.Kaufman S, Kaufman JS, MacLehose RF, Greenland S, Poole C. Improved estimation of controlled direct effects in the presence of unmeasured confounding of intermediate variables. Stat Med. 2005;24:1683–1702. doi: 10.1002/sim.2057. [DOI] [PubMed] [Google Scholar]
- 16.Robins JM, Greenland S. Identifiability and exchangeability for direct and indirect effects. Epidemiology. 1992;3:143–155. doi: 10.1097/00001648-199203000-00013. [DOI] [PubMed] [Google Scholar]
- 17.Weinberg CR. Toward a clearer definition of confounding. Am J Epidemiol. 1993;137:1–8. doi: 10.1093/oxfordjournals.aje.a116591. [DOI] [PubMed] [Google Scholar]
- 18.Cole SR, Chu H, Greenland S. Multiple-imputation for measurement-error correction. Int J Epidemiol. 2006;35:1074–1081. doi: 10.1093/ije/dyl097. [DOI] [PubMed] [Google Scholar]
- 19.Spiegelman D, McDermott A, Rosner B. Regression calibration method for correcting measurement-error bias in nutritional epidemiology. Am J Clin Nutr. 1997;65(4 suppl):1179S–1186S. doi: 10.1093/ajcn/65.4.1179S. [DOI] [PubMed] [Google Scholar]
- 20.Schisterman EF, Whitcomb BW, Louis GM, Louis TA. Lipid adjustment in the analysis of environmental contaminants and human health risks. Environ Health Perspect. 2005;113:853–857. doi: 10.1289/ehp.7640. [DOI] [PMC free article] [PubMed] [Google Scholar]
- 21.Greenland S. An introduction to instrumental variables for epidemiologists. Int J Epidemiol. 2000;29:1102. doi: 10.1093/oxfordjournals.ije.a019909. [DOI] [PubMed] [Google Scholar]
- 22.Hernan MA, Robins JM. Instruments for causal inference: an epidemiologist’s dream? Epidemiology. 2006;17:360–372. doi: 10.1097/01.ede.0000222409.00878.37. [DOI] [PubMed] [Google Scholar]
- 23.Greenland S. Quantifying biases in causal models: classical confounding vs collider-stratification bias. Epidemiology. 2003;14:300–306. [PubMed] [Google Scholar]
- 24.Robinson L, Jewell NP. Some Surprising Results About Covariate Adjustment in Logistic Regression Models. Int Stat J. 1991;58:227–240. [Google Scholar]
- 25.Miettinen OS, Cook EF. Confounding: essence and detection. Am J Epidemiol. 1981;114:593–603. doi: 10.1093/oxfordjournals.aje.a113225. [DOI] [PubMed] [Google Scholar]
- 26.Greenland S. Absence of confounding does not correspond to collapsibility of the rate ratio or rate difference. Epidemiology. 1996;7:498–501. [PubMed] [Google Scholar]
- 27.Glymour M. Using Causal Diagrams to Understand Common Problems in Social Epidemiology. In: Oakes J, Kaufman J, editors. Methods in Social Epidemiology. San Francisco: Wiley and Sons; 2006. pp. 393–428. [Google Scholar]
- 28.Basso O, Wilcox AJ, Weinberg CR. Birth weight and mortality: causality or confounding? Am J Epidemiol. 2006;164:303–311. doi: 10.1093/aje/kwj237. [DOI] [PubMed] [Google Scholar]
- 29.Schisterman EF, Hernandez-Diaz S. Invited commentary: simple models for a complicated reality. Am J Epidemiol. 2006;164:312–314. doi: 10.1093/aje/kwj238. [DOI] [PubMed] [Google Scholar]
- 30.Buekens P, Wilcox A. Why do small twins have a lower mortality rate than small singletons? Am J Obstet Gynecol. 1993;168:937–941. doi: 10.1016/s0002-9378(12)90849-2. [DOI] [PubMed] [Google Scholar]
- 31.Ananth CV, Wilcox AJ. Placental abruption and perinatal mortality in the United States. Am J Epidemiol. 2001;153:332–337. doi: 10.1093/aje/153.4.332. [DOI] [PubMed] [Google Scholar]
- 32.Basso O, Rasmussen S, Weinberg CR, Wilcox AJ, Irgens LM, Skjaerven R. Trends in fetal and infant survival following preeclampsia. JAMA. 2006;296:1357–1362. doi: 10.1001/jama.296.11.1357. [DOI] [PubMed] [Google Scholar]
- 33.MacDorman MF, Callaghan WM, Mathews TJ, Hoyert DL, Kochanek KD. Trends in preterm-related infant mortality by race and ethnicity, United States, 1999–2004. Int J Health Serv. 2007;37:635–641. doi: 10.2190/HS.37.4.c. [DOI] [PubMed] [Google Scholar]
- 34.Robins J. The control of confounding by intermediate variables. Stat Med. 1989;8:679–701. doi: 10.1002/sim.4780080608. [DOI] [PubMed] [Google Scholar]
- 35.Joffe MM, Colditz GA. Restriction as a method for reducing bias in the estimation of direct effects. Stat Med. 1998;17:2233–2249. doi: 10.1002/(sici)1097-0258(19981015)17:19<2233::aid-sim922>3.0.co;2-0. [DOI] [PubMed] [Google Scholar]


