

Abstract
Background/Aims
Glycogen storage disease type Ia (GSD-Ia) patients manifest the long-term complication of hepatocellular adenoma (HCA) of unknown etiology. We showed previously that GSD-Ia mice exhibit neutrophilia and elevated serum cytokine levels. This study was conducted to evaluate whether human GSD-Ia patients exhibit analogous increases and whether in GSD-Ia mice a correlation exists between immune abnormalities and, biochemical and histological alterations in the liver.
Methods
Differential leukocyte counts and cytokine levels were investigated in GSD-Ia patients. Hepatic chemokine production, neutrophil infiltration, and histological abnormalities were investigated in GSD-Ia mice.
Results
We show that GSD-Ia patients exhibit increased peripheral neutrophil counts and serum interleukin-8 (IL-8). Compared to normal subjects, HCA-bearing GSD-Ia patients have a 2.8-fold higher serum IL8 concentration, while GSD-Ia patients without HCA have a 1.4-fold higher concentration. Hepatic injury in GSD-Ia mice is evidenced by necrotic foci, markedly elevated infiltrating neutrophils, and increased hepatic production of chemokines.
Conclusion
Peripheral neutrophilia and elevated serum chemokines are characteristic of GSD-Ia with HCA-bearing GSD-Ia patients having the highest serum IL-8. In GSD-Ia mice these elevations correlate with elevated hepatic chemokine levels, neutrophil infiltration, and necrosis. Taken together, peripheral neutrophilia and increased serum chemokines may indicate hepatic injuries in GSD-Ia
Keywords: glycogen storage disease type Ia, hepatic necrosis, hepatic neutrophil infiltration, chemokines, hepatocellular adenoma, glucose homeostasis
1. Introduction
Glycogen storage disease type Ia (GSD-Ia, MIM232200) is an autosomal recessive disorder caused by a deficiency in glucose-6-phosphatase-α (G6Pase-α or G6PC), a key enzyme in glucose homeostasis (1). GSD-Ia patients manifest a phenotype of disturbed glucose homeostasis characterized by fasting hypoglycemia, hepatomegaly, nephromegaly, hyperlipidemia, hyperuricemia, lactic acidemia, and growth retardation (1). A second, less prevalent form of GSD-I, GSD-Ib, exhibits identical metabolic abnormalities, but is caused by mutations of the G6P transporter (1). GSD-Ib patients exhibit additional clinical manifestations of neutropenia and myeloid dysfunctions (1–4). In the last two and half decades, effective dietary therapies (5, 6) have significantly alleviated the metabolic abnormalities of GSD-I. However, hepatocellular adenoma (HCA) with risk for spontaneous hemorrhage and malignant transformation remains a long-term presentation of unknown etiology (7–13).
We have previously generated G6Pase-α-deficient mouse strains that faithfully mimic the metabolic abnormalities characteristic of disturbed glucose homeostasis in GSD-Ia patients (14). An unexpected finding in these mice was neutrophilia (15). To date there are no clinical reports of neutrophil dysfunctions in GSD-Ia patients, suggesting that the elevation in peripheral neutrophil counts is an inflammatory response to tissue injuries. Supporting our observations in the GSD-Ia mice we found increased serum concentrations of granulocyte colony stimulating factor (G-CSF) and cytokine-induced neutrophil chemoattractant (KC), compared to the control littermates (15). G-CSF is a hematopoietic growth factor (16, 17) and KC is a member of the CXC chemokine subfamily having an intervening amino acid between the first two conserved cysteine resides at the amino-terminus (18). The CXC chemokines are potent chemoattractants for neutrophils (19–22). In the first part of this current study we investigate whether neutrophilia and increased serum cytokines are present in human GSD-Ia patients.
GSD-Ia is characterized by hepatomegaly caused by an excessive accumulation of glycogen and fat in the liver (1, 14). Administration of glycogen to the peritoneal cavities of animals is known to induce peritonitis through the recruitment of large numbers of neutrophils into the peritoneal space (23, 24). Similarly, the abnormal retention of lipids within the liver in GSD-Ia may progress to a more severe non-alcoholic steatohepatitis, characterized by inflammation and hepatocellular degeneration (25, 26). Therefore we hypothesized that there is a glycogen- and/or fatty liver-induced inflammatory response in the liver of GSD-Ia mice, leading to increased hepatic neutrophil infiltration and hepatic damage.
In this study, we show that human GSD-Ia patients do exhibit a previously unreported elevation of peripheral blood neutrophil counts and CXC chemokine IL-8, the human homolog of murine KC, and the increase in serum IL-8 is most prominent in HCA-bearing GSD-Ia patients. We show that the liver of these mice produce markedly elevated levels of the chemokines, KC and macrophage inflammatory protein-2 (MIP-2), and that the hepatic injury in GSD-Ia mice is characterized by necrotic foci and increased neutrophil infiltration.
2. Patients and methods
2.1. Subjects
Fifty-five metabolically compensated GSD-Ia patients ranging from age 2 to 39 years and 28 age-matched healthy control subjects were studied. All patients were diagnosed as having GSD-Ia by the standard clinical biochemical methods, and the diagnosis was subsequently confirmed by mutation analysis. Samples were obtained during research admissions when subjects were in good health and afebrile. The study was approved by the Clinical Investigation Committee at the University of Florida, College of Medicine, and informed consent was obtained prior to enrollment in this study.
2.2. The G6Pase-α-deficient GSD-Ia mice
All animal studies were conducted under an animal protocol approved by the NICHD Animal Care and Use Committee. The GSD-Ia mice were treated from birth with a glucose therapy, that consists of intraperitoneal injection of 25–100 μl of 15% glucose, every 12 h, as described (14). Mice that survived weaning were given unrestricted access to Mouse Chow (Zeigler Bros., Inc., Gardners, PA). GSD-Ia is an autosomal recessive disorder (1). Since the phenotypes of wild-type and heterozygous mice are identical, we use the designation “control” or “unaffected” to refer to both wild-type and heterozygous mice.
2.3. Hematological and phenotype analyses
Peripheral blood cell counts were performed on Advia 120 Hematology System (Bayer Diagnostics, Tarrytown, NY). Alanine aminotransferase (ALT), asparate aminotransferase (AST), and alkaline phosphatase (ALP) were determined on Roche Diagnostics Modular Analytics E170 (Indianapolis, IN). G-CSF, KC, MIP-2, and IL-8 were quantified using Quantikine ELISA kits (R&D Systems Inc., Minneapolis, MN). Serum glucose, total cholesterol, and uric acid were analyzed using kits obtained from Thermo Electron (Louisville, CO), triglycerides using a kit from Sigma Diagnostics (St Louis, MO), and lactic acid using a kit from Trinity Biotech (St. Louis, MO).
For H&E staining, tissues were preserved in 10% neutral buffered formalin, embedded in paraffin, and sectioned at 4–6 micron thickness.
2.4. Immunohistochemical analysis of neutrophil infiltration
Mouse livers were snap frozen, embedded in O.C.T. (Sakura Finetek, Terrance, CA), and sectioned at 6 micron thickness. The sections were first quenched in 0.3% hydrogen peroxide/70% methanol for 30 min to inactivate endogenous peroxidases. To identify neutrophils the sections were treated with rat anti-mouse Gr-1 antibody (BD Pharmingen, San Jose, CA) diluted 1 to 50 in PBS containing 1% bovine serum albumin. The endogenous avidin/biotin was blocked using the Avidin/Biotin Blocking Kit obtained from Vector Laboratories (Burlingame, CA). The treated sections were then incubated with biotinylated rabbit anti-rat IgG (Vector Laboratories) and the immune complexes detected using an ABC kit and DAB Substrate from Vector Laboratories according to the manufacturer’s instructions. Slides were counterstained with hematoxylin before mounting. Neutrophils were counted in six randomly selected fields at 200-fold magnification and reported as the mean average.
2.5. Statistical analysis
The unpaired t test was performed using the GraphPad Prism Program, version 4 (GraphPad Software, San Diego, CA). Values were considered statistically significant at p < 0.05.
3. Results
3.1. Human GSD-Ia patients exhibit elevated blood neutrophil counts and serum IL-8
Based on the observation of neutrophilia in GSD-Ia mice (15), we examined peripheral blood neutrophil counts and serum cytokine levels in 55 metabolically compensated GSD-Ia patients (25 female, 30 male) ranging from age 2 to 39 years and compared them to 28 age-matched control subjects. Fourteen of these GSD-Ia patients (25.5%; 8 male, 6 female), ranging from age 10 to 39 years, had HCA at the time of the study. All GSD-Ia patients were on a dietary therapy which maintained euglycemia (Fig. 1A), but, as expected, these patients continue to suffer from hypercholesterolemia, hypertriglyceridemia, hyperuricemia, and lactic acidemia (Fig. 1A), indicating ongoing problems.
Fig. 1.

Analysis of serum profiles of human GSD-Ia patients. Fifty-five metabolically compensated GSD-Ia patients ranging from age 2 to 39 years and 28 age-matched control subjects were examined. Fourteen patients ranging from age 10 to 39 years bear HCA. (A) Serum levels of glucose, cholesterol, triglyceride, uric acid, and lactic acid. (B) Serum levels of ALT, AST, and ALP. Clinical ranges considered normal are ALT: 5 – 40 U/L; AST: 5 – 40 U/L; ALP: 40–120 IU/L. Values represent mean ± SEM. *p<0.05; **p<0.005.
Serum biochemistry for liver function tests showed that the GSD-Ia patients without HCA had normal serum ALT and AST values (Fig. 1B). The HCA-bearing GSD-Ia patients had mildly elevated serum levels of both enzymes. A ratio of AST:ALT greater than 1 is highly suggestive of liver disease (27) and the ratios of AST:ALT in HCA-bearing and HCA-nonbearing GSD-Ia patients were 1.27 and 1.11, respectively. Serum ALP levels between the two GSD-Ia patient groups were similar, both were above the normal references values of 40–120 IU/L (Fig. 1B), also suggestive of liver disease.
The peripheral blood neutrophil counts in human GSD-Ia patients with or without HCA were similar, and both patient groups, on average, were 1.3-fold higher than the control subjects (Fig. 2A). The percentages of blood neutrophils did not differ between GSD-Ia and control subjects (Fig. 2B). However, among GSD-Ia patients, neutrophil percentage in patients with HCA was higher than in patients without HCA. Consistent with the elevated peripheral blood neutrophil counts, serum IL-8 levels in GSD-Ia patients were higher than the controls (Fig. 2C). In GSD-Ia patients without HCA, serum IL-8 levels were 1.4-fold higher than the control subjects while in HCA-bearing patients, serum IL-8 levels were 2.8-fold higher. Among GSD-Ia patients, serum IL-8 in HCA-bearing patient group was 2-fold higher than the patient group without HCA (Fig. 2C). Interestingly, serum IL-8 in GSD-Ib patients was shown to be 1.4-fold higher than the control subjects (28), like HCA-nonbearing GSD-Ia patients. In contrast to the elevated serum G-CSF in GSD-Ia mice (15) and GSD-Ib patients (28), serum G-CSF levels between GSD-Ia patients and controls were similar (Fig. 2D).
Fig. 2.

Analysis of peripheral blood neutrophil counts and serum levels of IL-8 and G-CSF in human GSD-Ia patients. Fifty-five metabolically compensated GSD-Ia patients ranging from age 2 to 39 years and 28 age-matched control subjects were examined. Fourteen patients ranging from age 10 to 39 years bear HCA. (A) Peripheral blood neutrophil counts. (B) The percentages of blood neutrophils. (C) Serum levels of IL-8. (D) Serum levels of G-CSF. Values represent mean ± SEM. *p<0.05; **p<0.005. The differences in the percentages of blood neutrophils and serum G-CSF between GSD-Ia patients and control subjects are not statistically significant.
3.2. GSD-Ia mice manifest metabolic abnormalities
We have previously shown that the GSD-Ia mice maintained on a glucose therapy manifest a metabolic phenotype near-identical to that seen in GSD-Ia patients (14). Like the human patients, metabolic abnormalities in GSD-Ia mice improve with age. However, while metabolically compensated GSD-Ia patients can maintain euglycemia (Fig. 1A), the GSD-Ia mice continue to suffer from hypoglycemia, hypercholesterolemia, hypertriglyceridemia, hyperuricemia, and lactic acidemia (Fig. 3A). They also manifest nephromegaly (Fig. 3B) and hepatomegaly (Fig. 3C).
Fig. 3.

GSD-Ia mice manifest metabolic abnormalities. (A) Serum levels of glucose, cholesterol, triglyceride, uric acid, and lactic acid in 6-week-old unaffected (n = 16) and GSD-Ia (n = 24) mice. (B) The weights of the kidney relative to total body weight in 6-week-old unaffected (n = 8) and GSD-Ia (n = 8) mice. (C) The weights of the liver relative to total body weight in unaffected and GSD-Ia mice during postnatal development. Each point represents the average of 8 or more animals. (D) Post-natal glycogen storage in unaffected and GSD-Ia mice during postnatal development. Each point represents a minimum of 7 animals. Values represent mean ± SEM. *p <0.05 **p <0.005; ***p <0.0001.
Hepatomegaly in GSD-Ia is caused by excessive glycogen and fat deposition (1). In wild-type mice, the average relative liver weight increases slightly during the 6 weeks of postnatal development to 4.5% of body weight (Fig. 3C). In GSD-Ia mice, an increase in the relative liver weight is already prominent at age 1 week reaching 8.5% of body weigh (Fig. 3C). Liver enlargement peaks at age 2–3 weeks before leveling off at a level 2.2-fold higher than the control littermates at age 6 weeks (Fig. 3C).
In the unaffected mice, the rate of glycogen storage in the livers increases from 55 ± 2.1 μmol glucosyl residues per gm of liver at age 1 week, to 80.1 ± 8.3 μmol glucosyl residues per gm of liver at age 6 weeks (Fig. 3D). In GSD-Ia mice, the rate of glycogen accumulation is four times higher at 218.5 ± 7.2 μmol glucosyl residues per gm of liver at age 1week (Fig. 3D). Consistent with the improvement of the metabolic profile with age, liver glycogen storage in GSD-Ia mice becomes less severe in 6-week-old mice at a level 1.4-fold higher than the control littermates (Fig. 3D).
3.3. Elevated hepatic KC, MIP-2 and neutrophil infiltration in GSD-Ia mice
The levels of the CXC chemokines, KC and MIP-2 in the liver of GSD-Ia and control mice differ significantly by age 6 weeks. Hepatic KC in GSD-Ia mice is 3.8-fold higher while MIP-2 is 8.3-fold higher than the control littermates (Fig. 4).
Fig. 4.
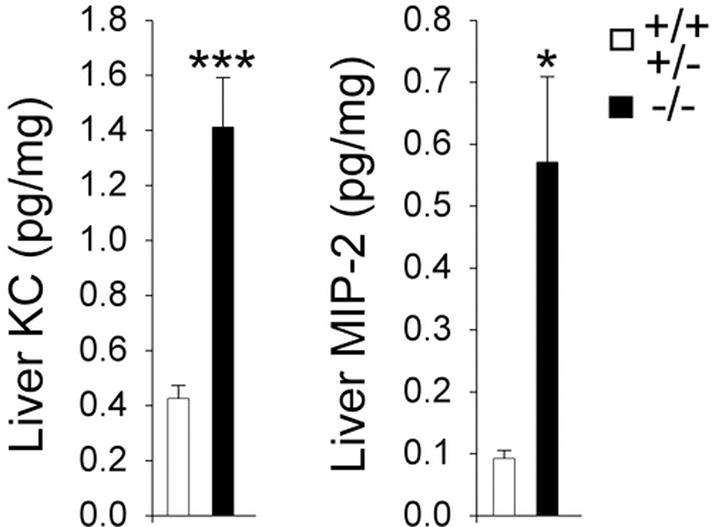
Analysis of hepatic KC and MIP-2 in GSD-Ia mice. Quantification of hepatic KC and MIP-2 concentrations (pg/mg liver protein) in 6-week-old unaffected (n = 9) and GSD-Ia (n = 9) mice. Values represent mean ± SEM. *p<0.01; ***p<0.0001.
Infiltrating neutrophils were readily detectable in the liver of 6-week-old GSD-Ia mice as discrete cells and also appeared as clusters (Fig. 5A). In the six randomly selected fields at 200-fold magnification we routinely identified 2 to 3 neutrophil clusters in the liver of GSD-Ia mice. Neutrophil clusters were rarely found in the liver of control littermates and among the 5 control mice examined, we only detected 2 small neutrophil clusters of 5–7 cells, both in the same control mouse. Because the number of neutrophils in these clusters varied from 5–7 to 30–40, each cluster was scored as one neutrophil count. This has the effect of underestimating the true neutrophil counts in the GSD-Ia mice. Despite this conservative approach, the mean hepatic neutrophil counts were 22.6 ± 1.8 in GSD-Ia mice and 5.0 ± 0.7 in the unaffected mice, representing a minimum 4.6-fold higher neutrophil count in GSD-Ia mice compared to controls (Fig. 5B).
Fig. 5.

Increased neutrophil infiltration in the liver of GSD-Ia mice. (A) Immunohistochemical analysis of hepatic neutrophil infiltration at magnifications of × 400. Representative experiments are shown. Arrows denote infiltrated neutrophils. (B) Quantification of hepatic neutrophil infiltration. Values represent mean ± SEM. **p<0.001.
3.4. The liver of GSD-Ia mice exhibit histological abnormalities
In the liver of 6-week-old unaffected mice, no histological abnormality was observed (Fig. 6A and 6B). In contrast, the liver of 6-week-old GSD-Ia mice accumulated excessive glycogen in hepatocytes (Fig. 6C to 6H). Moreover, within a 20 mm2 section, multiple small clusters of neutrophils, occasionally admixed with a few necrotic hepatocytes were frequently observed in the liver of GSD-Ia mice (Fig. 6C and 6D). Hepatic pathology also included necrotic foci admixed with multiple degenerate neutrophils (Fig. 6E to 6H), varying from 1 to 7 foci per 20 mm2 section, which were identified in all 6-week-old GSD-Ia mice (n = 5) studied.
Fig. 6.

Histological analysis of the liver in GSD-Ia mice. H&E stained liver sections in 6-week-old unaffected (+/+) and GSD-Ia (−/−) mice at magnifications of × 400. Representative sections are shown. Multiple foci of infiltrating neutrophils as well as necrotic foci admixed with multiple degenerate nutrophils were identified in all 5 GSD-Ia mice examined.
4. Discussion
GSD-Ia patients under good metabolic control for hypoglycemia continue to suffer from hepatomegaly, nephromegaly, hyperlipidemia, hyperuricemia, lactic acidemia, and HCA of unknown etiology remains a common complication (1, 7–13). Understanding the etiology of HCA, which can undergo malignant transformations, would benefit the long term care and treatment of patients. One aspect of the GSD-Ia disorder which has not been investigated so far is whether there is an immune component that needs to be addressed. In the past, a key clinical difference between GSD-Ia and GSD-Ib, has been the recognition of an underlying neutrophil dysfunction in GSD-Ib (1–4). The connection between the loss of glucose homeostasis and the immune abnormality has been unclear. Since the G6PT gene involved in GSD-Ib has a ubiquitous expression profile (29) compared to the liver/kidney/intestine restricted profile of the G6Pase-α gene involved in GSD-Ia (30), the difference has been ascribed to a putative secondary activity of the G6PT protein, in myeloid tissues, rather than a consequence of a disturbed glucose homeostasis. It was interesting, therefore, when we recently showed that GSD-Ia mice, manifesting a phenotype mimicking the human GSD-Ia disorder, exhibit peripheral neutrophilia and increased serum concentrations of KC and G-CSF (15), suggestive of underlying immune challenge. In this study, we sought to determine if the observed immune abnormality was elucidating previously unrecognized sub-clinical conditions in GSD-Ia. We show that human GSD-Ia patients also exhibit elevated peripheral blood neutrophil counts and increased serum IL-8, the human analogue of murine KC, paralleling the murine GSD-Ia model.
Previous studies (7, 10, 11) of serum biochemistry of liver function reported that GSD-Ia patients without HCA (n = 8) had normal values of ALT (39.8 ± 9.9) and minimal elevations in AST (45.8 ± 17.3), and that HCA-bearing GSD-Ia patients (n = 8) had moderate elevations in both ALT and AST with the AST:ALT ratios of 1.16 to 1.27. Serum levels of ALP in GSD-Ia patients had been reported to increase in patients with HCA (7, 10, 13). We now report that in our study of 55 GSD-Ia patients, serum ALP levels are above the normal reference values in 67% irrespective of HCA status or age. In agreement with others, HCA-bearing GSD-Ia patients have mildly elevated serum levels of ALT and AST with an AST:ALT ratio of 1.27. A ratio of AST:ALT greater than 1 is highly suggestive of liver disease (27) and has been associated with advanced alcoholic liver disease (31) and chronic hepatitis C-mediated liver cirrhosis (32). The elevated levels in our patients are therefore consistent with the potential for hepatic damage. Taken together, HCA-bearing GSD-Ia patients exhibit mildly abnormal serum profile suggestive of liver disease.
Studies have shown that elevated peripheral neutrophil counts are associated with alcoholic liver disease and a correlation exists between circulating IL-8 levels and the severity of hepatic injury (33, 34). The highest circulating IL-8 levels were shown to associate with the alcoholic hepatitis group, reaching 437 pg/ml (33). In GSD-Ia patients without HCA, serum IL-8 levels at 35.6 ± 2.3 pg/ml, were similar to that observed with the fatty liver group (33, 34). On the other hand, serum IL-8 levels in HCA-bearing GSD-Ia patients at 70.6 ± 19.7 pg/ml, were higher than the values of 52 ± 8 pg/ml observed in the asymptomatic alcoholic fatty liver group (33). The mild neutrophilia and moderately elevated serum IL-8 would not be expected to result in a clinical manifestation, explaining why these characteristics of GSD-Ia have not been previously reported. However, our findings suggest that serum IL-8 levels should be carefully monitored in HCA-bearing GSD-Ia patients to determine if a correlation exists between circulating IL-8 and the occurrence of HCA.
The neutrophil counts in blood are tightly regulated and represent a balance between the production, release, and clearance of neutrophils from the circulation. The key components in this regulation are G-CSF (16, 17) and the CXC chemokines (19–22). The serum levels of G-CSF and KC in GSD-Ia mice were higher than those of control littermates, although we only observed an increase in serum IL-8 in human GSD-Ia patients. The difference between human and mouse cytokine profiles may reflect the greater clinical controls developed for dietary therapies in human GSD-Ia to maintain euglycemia (Fig. 1A). Such therapies have not yet been refined for GSD-Ia mice, and these mice do continue to suffer hypoglycemia (Fig. 3A).
Glycogen is known to induce inflammation (23, 24) and hepatic steatosis can progress to non-alcoholic steatohepatitis with the pathology of fatty degeneration, inflammation and damage (25, 26). In both these conditions, that is a characteristic of IL-8-mediated neutrophil infiltration known to contribute to inflammation (19–22). Lipid accumulation in hepatocytes has also been shown to stimulate IL-8 production (35). Taken together, one reasonable hypothesis is that the elevated serum IL-8 concentrations seen in GSD-Ia might signal the presence of chronic hepatic inflammation that might lead to hepatic injury. In the GSD-Ia mice, there was clear evidence of hepatic injury, characterized by elevation of KC and MIP-2 within the liver tissue, increased hepatic neutrophil infiltration, and necrotic foci in nearly all 6-week-old GSD-Ia mice examined. Studies also show that necrotic cells can induce inflammation characterized by increased production of KC/MIP-2 and infiltrating neutrophils (36), indicating necrotic foci seen in GSD-Ia mouse liver could pose additional risk of hepatic injury. The increases in CXC chemokines along with elevated infiltrating neutrophils have been shown to associate with many liver injuries, including alcoholic liver disease and hepatocellular carcinoma (33, 34, 37–41). Necrosis seen in mouse GSD-Ia livers that also accumulate excessive glycogen and fat suggest that neutrophil-mediated liver injuries may predispose GSD-Ia patients to develop HCA. Most HCAs seen in GSD-I patients tend to be small, multiple, and nonencapsulated (7–13), but in approximately 10% patients these benign lesions can undergo malignant transformation (11). The management of HCA in GSD-I thus remains difficult due to the absence of predictive signs. Moreover, the signal of HCA to hepatocellular carcinoma transformation in GSD-Ia remains unclear. It would be of interest to monitor the level of these chemokines and neutrophil counts in patients to see if there are any predictive correlations with the development of adenomas.
In summary, we now report that GSD-Ia patients also have an underlying immune abnormality characterized by a sub-clinical neutrophilia and elevated serum concentrations of IL-8 that is more prominent in HCA-bearing patients. Correlated with this, in the mouse model of GSD-Ia we observe hepatic injury characterized by necrotic foci, increased hepatic chemokines, KC and MIP-2, and increased neutrophil infiltration of the liver, suggesting one mechanism by which adenoma may arise.
Acknowledgments
This research was supported by the Intramural Research Program of the NICHD, NIH, the NIH General Clinical Research Center Grant M01 RR 00082 (UF), and the Mentored Career Award K23 RR 017560 (DW). The authors appreciate the nursing support on the GCRC and the technical support of Ms. Catherine Correia.
Abbreviations
- GSD-Ia
glycogen storage disease type Ia
- G6Pase-α
glucose-6-phosphatase-α
- G6P
glucose-6-phosphate
- G6PT
glucose-6-phosphate transporter
- HCA
hepatocellular adenoma
- G-CSF
granulocyte colony stimulating factor
- KC
cytokine-induced neutrophil chemoattractant
- IL-8
interleukin-8
- MIP-2
macrophage inflammatory protein-2
Footnotes
Publisher's Disclaimer: This is a PDF file of an unedited manuscript that has been accepted for publication. As a service to our customers we are providing this early version of the manuscript. The manuscript will undergo copyediting, typesetting, and review of the resulting proof before it is published in its final citable form. Please note that during the production process errors may be discovered which could affect the content, and all legal disclaimers that apply to the journal pertain.
References
- 1.Chou JY, Matern D, Mansfield BC, Chen Y-T. Type I glycogen storage diseases: disorders of the glucose-6-phosphatase complex. Curr Mol Med. 2002;2:121–143. doi: 10.2174/1566524024605798. [DOI] [PubMed] [Google Scholar]
- 2.Beaudet AL, Anderson DC, Michels VV, Arion WJ, Lange AJ. Neutropenia and impaired neutrophil migration in type 1B glycogen storage disease. J Pediatr. 1980;97:906–910. doi: 10.1016/s0022-3476(80)80418-5. [DOI] [PubMed] [Google Scholar]
- 3.Gitzelmann R, Bosshard NU. Defective neutrophil and monocyte functions in glycogen storage disease type 1b: a literature review. Eur J Pediatr. 1993;152:S33–S38. doi: 10.1007/BF02072085. [DOI] [PubMed] [Google Scholar]
- 4.Chou JY, Mansfield BC. Glucose-6-phosphate transporter: the key to glycogen storage disease type Ib. In: Broer S, Wagner CA, editors. Membrane Transporter Diseases. New York: Springer; 2003. pp. 191–205. [Google Scholar]
- 5.Greene HL, Slonim AE, O’Neill JA, Jr, Burr IM. Continuous nocturnal intragastric feeding for management of type 1 glycogen-storage disease. N Engl J Med. 1976;294:423–425. doi: 10.1056/NEJM197602192940805. [DOI] [PubMed] [Google Scholar]
- 6.Chen YT, Cornblath M, Sidbury JB. Cornstarch therapy in type I glycogen storage disease. N Engl J Med. 1984;310:171–175. doi: 10.1056/NEJM198401193100306. [DOI] [PubMed] [Google Scholar]
- 7.Howell RR, Stevenson RE, Ben-Menachem Y, Phyliky RL, Berry DH. Hepatic adenomata with type 1 glycogen storage disease. JAMA. 1976;236:1481–1484. [PubMed] [Google Scholar]
- 8.Bianchi L. Glycogen storage disease I and hepatocellular tumours. Eur J Pediatr. 1993;52:S63–S70. doi: 10.1007/BF02072092. [DOI] [PubMed] [Google Scholar]
- 9.Labrune P, Trioche P, Duvaltier I, Chevalier P, Odievre M. Hepatocellular adenomas in glycogen storage disease type I and III: a series of 43 patients and review of the literature. J Pediatr Gastroenterol Nutr. 1997;24:276–279. doi: 10.1097/00005176-199703000-00008. [DOI] [PubMed] [Google Scholar]
- 10.Yoshikawa M, Fukui K, Kuriyama S, Tsujimoto T, Nakatani Y, Toyokawa Y, et al. Hepatic adenomas treated with percutaneous ethanol injection in a patient with glycogen storage disease type Ia. J Gastroenterol. 2001;36:52–61. doi: 10.1007/s005350170155. [DOI] [PubMed] [Google Scholar]
- 11.Nakamura T, Ozawa T, Kawasaki T, Nakamura H, Sugimura H. Glucose-6-phosphatase gene mutations in 20 adult Japanese patients with glycogen storage disease type 1a with reference to hepatic tumors. J Gastroenterol Hepatol. 2001;12:1402–1408. doi: 10.1046/j.1440-1746.2001.02645.x. [DOI] [PubMed] [Google Scholar]
- 12.Lee PJ. Glycogen storage disease type I: pathophysiology of liver adenomas. Eur J Pediatr. 2002;161:S46–S49. doi: 10.1007/s00431-002-1002-0. [DOI] [PubMed] [Google Scholar]
- 13.Volmar KE, Burchette JL, Creager AJ. Hepatic adenomatosis in glycogen storage disease type Ia: report of a case with unusual histology. Arch Pathol Lab Med. 2003;127:402–405. doi: 10.5858/2003-127-e402-HAIGSD. [DOI] [PubMed] [Google Scholar]
- 14.Lei K-J, Chen H, Pan C-J, Ward JM, Mosinger B, Lee EJ, et al. Glucose-6-phosphatase dependent substrate transport in the glycogen storage disease type 1a mouse. Nat Genet. 1996;13:203–209. doi: 10.1038/ng0696-203. [DOI] [PubMed] [Google Scholar]
- 15.Kim SY, Chen L-Y, Weinstein DA, Chou JY. Neutrophilia and elevated serum cytokines are implicated in glycogen storage disease type Ia. FEBS Lett. 2007;581:3833–3838. doi: 10.1016/j.febslet.2007.07.013. [DOI] [PMC free article] [PubMed] [Google Scholar]
- 16.Barreda DR, Hanington PC, Belosevic M. Regulation of myeloid development and function by colony stimulating factors. Dev Comp Immunol. 2004;28:509–554. doi: 10.1016/j.dci.2003.09.010. [DOI] [PubMed] [Google Scholar]
- 17.Christopher MJ, Link DC. Regulation of neutrophil homeostasis. Curr Opin Hematol. 2007;14:3–8. doi: 10.1097/00062752-200701000-00003. [DOI] [PubMed] [Google Scholar]
- 18.Fernandez EJ, Lolis E. Structure, function, and inhibition of chemokines. Annu Rev Pharmacol Toxicol. 2002;42:469–499. doi: 10.1146/annurev.pharmtox.42.091901.115838. [DOI] [PubMed] [Google Scholar]
- 19.Mukaida N, Harada A, Matsushima K. Interleukin-8 (IL-8) and monocyte chemotactic and activating factor (MCAF/MCP-1), chemokines essentially involved in inflammatory and immune reactions. Cytokine Growth Factor Rev. 1998;9:9–23. doi: 10.1016/s1359-6101(97)00022-1. [DOI] [PubMed] [Google Scholar]
- 20.Luster AD. Chemokines-chemotactic cytokines that mediate inflammation. N Engl J Med. 1998;338:436–445. doi: 10.1056/NEJM199802123380706. [DOI] [PubMed] [Google Scholar]
- 21.Murdoch C, Finn A. Chemokine receptors and their role in inflammation and infectious diseases. Blood. 2000;95:3032–3043. [PubMed] [Google Scholar]
- 22.Kobayashi Y. Neutrophil infiltration and chemokines. Crit Rev Immunol. 2006;26:307–331. doi: 10.1615/critrevimmunol.v26.i4.20. [DOI] [PubMed] [Google Scholar]
- 23.Yamashita T, Ishibashi Y, Nagaoka I, Kasuya K, Masuda K, Warabi H, et al. Studies of glycogen-induced inflammation of mice. Dynamics of inflammatory responses and influence of antiinflammatory drugs and protease inhibitors. Inflammation. 1982;6:87–101. doi: 10.1007/BF00910722. [DOI] [PubMed] [Google Scholar]
- 24.Mulligan MS, Lentsch AB, Miyasaka M, Ward PA. Cytokine and adhesion molecule requirements for neutrophil recruitment during glycogen-induced peritonitis. Inflamm Res. 1998;47:251–255. doi: 10.1007/s000110050326. [DOI] [PubMed] [Google Scholar]
- 25.McCullough AJ. Pathophysiology of nonalcoholic steatohepatitis. J Clin Gastroenterol. 2006;40:S17–S29. doi: 10.1097/01.mcg.0000168645.86658.22. [DOI] [PubMed] [Google Scholar]
- 26.Cave M, Deaciuc I, Mendez C, Song Z, Joshi-Barve S, Barve S, et al. Nonalcoholic fatty liver disease: predisposing factors and the role of nutrition. J Nutr Biochem. 2007;18:184–195. doi: 10.1016/j.jnutbio.2006.12.006. [DOI] [PubMed] [Google Scholar]
- 27.Giannini EG, Testa R, Savarino V. Liver enzyme alteration: a guide for clinicians. CMAJ. 2005;172:367–379. doi: 10.1503/cmaj.1040752. [DOI] [PMC free article] [PubMed] [Google Scholar]
- 28.Chen L-Y, Shieh J-J, Lin B, Pan C-J, Gao J-L, Murphy PM, et al. Impaired glucose homeostasis, neutrophil trafficking and function in mice lacking the glucose-6-phosphate transporter. Hum Mol Genet. 2003;12:2547–2558. doi: 10.1093/hmg/ddg263. [DOI] [PubMed] [Google Scholar]
- 29.Lin B, Annabi B, Hiraiwa H, Pan C-J, Chou JY. Cloning and characterization of cDNAs encoding a candidate glycogen storage disease type 1b protein in rodents. J Biol Chem. 1998;273:31656–31670. doi: 10.1074/jbc.273.48.31656. [DOI] [PubMed] [Google Scholar]
- 30.Pan C-J, Kei K-J, Chen H, Ward JM, Chou JY. Ontogeny of the murine glucose-6-phosphatase system. Arch Biochem Biophys. 1998;358:17–24. doi: 10.1006/abbi.1998.0849. [DOI] [PubMed] [Google Scholar]
- 31.Nyblom H, Berggren U, Balldin J, Olsson R. High AST/ALT ratio may indicate advanced alcoholic liver disease rather than heavy drinking. Alcohol & Alcoholism. 2004;39:336–339. doi: 10.1093/alcalc/agh074. [DOI] [PubMed] [Google Scholar]
- 32.Sheth SG, Flamm SL, Gordon FD, Chopra S. AST/ALT ratio predicts cirrhosis in patients with chronic hepatitis C virus infection. Am J Gastroenterol. 1998;93:44–48. doi: 10.1111/j.1572-0241.1998.044_c.x. [DOI] [PubMed] [Google Scholar]
- 33.Huang YS, Chan CY, Wu JC, Pai CH, Chao Y, Lee SD. Serum levels of interleukin-8 in alcoholic liver disease: relationship with disease stage, biochemical parameters and survival. J Hepatol. 1996;24:377–384. doi: 10.1016/s0168-8278(96)80156-5. [DOI] [PubMed] [Google Scholar]
- 34.Swiatkowska-Stodulska R, Bakowska A, Drobi ska-Jurowiecka A. Interleukin-8 in the blood serum of patients with alcoholic liver disease. Med Sci Monit. 2006;12:CR215–CR220. [PubMed] [Google Scholar]
- 35.Joshi-Barve S, Barve SS, Amancherla K, Gobejishvili L, Hill D, Cave M, et al. Palmitic acid induces production of proinflammatory cytokine interleukin-8 from hepatocytes. Hepatology. 2007;46:823–830. doi: 10.1002/hep.21752. [DOI] [PubMed] [Google Scholar]
- 36.Tanimoto N, Terasawa M, Nakamura M, Kegai D, Aoshima N, Kobayashi Y, et al. Involvement of KC, MIP-2, and MCP-1 in leukocyte infiltration following injection of necrotic cells into the peritoneal cavity. Biochem Biophys Res Commun. 2007;361:533–536. doi: 10.1016/j.bbrc.2007.07.060. [DOI] [PubMed] [Google Scholar]
- 37.Akiba J, Yano H, Ogasawara S, Higaki K, Kojiro M. Expression and function of interleukin-8 in human hepatocellular carcinoma. Int J Oncol. 2001;18:257–264. doi: 10.3892/ijo.18.2.257. [DOI] [PubMed] [Google Scholar]
- 38.Ren Y, Poon RT, Tsui HT, Chen WH, Li Z, Lau C, et al. Interleukin-8 serum levels in patients with hepatocellular carcinoma: correlations with clinicopathological features and prognosis. Clin Cancer Res. 2003;9:5996–6001. [PubMed] [Google Scholar]
- 39.Okaya T, Lentsch AB. Cytokine cascades and the hepatic inflammatory response to ischemia and reperfusion. J Invest Surg. 2003;16:141–147. [PubMed] [Google Scholar]
- 40.Jaeschke H, Hasegawa T. Role of neutrophils in acute inflammatory liver injury. Liver Int. 2006;26:912–919. doi: 10.1111/j.1478-3231.2006.01327.x. [DOI] [PubMed] [Google Scholar]
- 41.Tachibana Y, Nakamoto Y, Mukaida N, Kaneko S. Intrahepatic interleukin-8 production during disease progression of chronic hepatitis C. Cancer Lett. 2007;251:36–42. doi: 10.1016/j.canlet.2006.10.028. [DOI] [PubMed] [Google Scholar]