

Abstract
The study of oral premalignant lesions (OPL) is crucial to the identification of initiating genetic events in oral cancer. However, these lesions are minute in size, making it a challenge to recover sufficient DNA from microdissected cells for comprehensive genomic analysis. As a step toward identifying genetic aberrations associated with oral cancer progression, we used tiling-path array comparative genomic hybridization to compare alterations on chromosome 3p for 71 OPLs against 23 oral squamous cell carcinomas. 3p was chosen because although it is frequently altered in oral cancers and has been associated with progression risk, its alteration status has only been evaluated at a small number of loci in OPLs. We identified six recurrent losses in this region that were shared between high-grade dysplasias and oral squamous cell carcinomas, including a 2.89-Mbp deletion spanning the FHIT gene (previously implicated in oral cancer progression). When the alteration status for these six regions was examined in 24 low-grade dysplasias with known progression outcome, we observed that they occurred at a significantly higher frequency in low-grade dysplasias that later progressed to later-stage disease (P < 0.003). Moreover, parallel analysis of all profiled tissues showed that the extent of overall genomic alteration at 3p increased with histologic stage. This first high-resolution analysis of chromosome arm 3p in OPLs represents a significant step toward predicting progression risk in early preinvasive disease and provides a keen example of how genomic instability escalates with progression to invasive cancer.
Loss of chromosome 3p is a common genetic event in many human cancers, with several putative tumor suppressor genes located in this region (1, 2). In oral cancer, loss of 3p carries prognostic significance, particularly for risk of disease progression, development of second primary tumors, and emergence of local recurrences (3-7). Alterations on 3p are also thought to be key events in the progression of oral premalignant lesions (OPL) to invasive disease. Previously, three microsatellite markers on this chromosome arm were used to show that 3p loss of heterozygosity (LOH) did occur in OPLs and that alteration of this region increased in frequency with progression to cancer (8). Other reports have also associated alterations in specific segments of 3p in OPLs with elevated risk of invasive transformation (4, 6). However, these markers have not been applicable in all cases, leaving the possibility that there are additional candidates within chromosome 3p that are necessary for progression to oral invasive cancer.
To identify additional segments on chromosome 3p that are associated with disease progression, we undertook tiling-path array comparative genomic hybridization (CGH) for the entire chromosome arm in a panel of premalignant and invasive oral tissues. In addition to its improved resolution, this platform also gave the benefit of being able to work with DNAof limited quantity (because of the small size of the captured lesions) and low quality (because of the use of formalin-fixed paraffin-embedded tissue, which typically precludes effective microarray profiling). This allowed us to profile high-grade dysplasias (HGD; including severe dysplasias and carcinoma in situ lesions, which have a high likelihood of progression to invasive disease), low-grade dysplasias (LGD) with clinical outcome, and oral squamous cell carcinomas (OSCC). Parallel analysis of genomic data from these various tissues showed stage-specific genetic alterations. More importantly, association of these same data with clinical features provided us with a new tool for predicting progression risks in LGDs, where the existing histopathologic criteria are unable to predict progression.
Materials and Methods
Tissue samples
This study involves 94 archival formalin-fixed paraffin-embedded specimens from 86 patients: 24 LGDs (2 hyperplasias and 22 mild and moderate dysplasias), 47 HGDs (severe dysplasias and carcinoma in situ), and 23 OSCCs, all obtained from the British Columbia Oral Biopsy Service. Clinical information and demographics for these cases are presented in Supplementary Table S1. All LGDs and HGDs came from patients with no prior history of cancer. All LGD patients were enrolled in a longitudinal study established at the British Columbia Cancer Prevention Program with a median follow-up of 7 y: Of the 24 LGDs, 15 LGDs did not progress during the period from 1985 to 2007, whereas 9 LGDs progressed to cancer. In British Columbia, patients with HGDs are treated with surgery and followed up for recurrence. All diagnoses were confirmed by the study pathologist (L.Z.). Representative sections were microdissected and DNA was extracted as previously described (9).
Array CGH analysis
Array CGH was done as previously described (9-11). Genomic arrays (SMRT v.1 and v.2) were obtained from the British Columbia Cancer Research Center Array Laboratory (9, 10). Briefly, sample and normal reference genomic DNA (250 ng each) were differentially labeled and mixed with 100 μg of human Cot-1 DNA (Invitrogen), purified, and hybridized to the array at 45°C for 36 h before washing. Hybridized arrays were scanned for signal intensities as previously described (9, 12). Image data were LOWESS, spatial, and median normalized (13, 14). SeeGH software combined duplicate spot data and displayed log 2 ratios in relation to genomic locations in the hg17 assembly (NCBI Build 35; ref. 15). Duplicate spots with SDs >0.075 or with signal-to-noise ratios <3 were stringently filtered, leaving informative clones for breakpoint analysis (9, 12). Segmental gains and losses were detected and confirmed using three separate algorithms: aCGH-Smooth, DNACopy,and LSPHMM (16-18). Altered regions that were concurrently identified by at least two of the three segmentation algorithms were scored: (a) aCGH-Smooth uses a local search algorithm that smoothes the observed array CGH values between consecutive breakpoints to a suitable common value by using maximum likelihood estimation (16). The Lambda and the maximum number of breakpoints in initial pool were set to 6.75 and 100, respectively (12). (b) DNAcopy uses a circular binary segmentation algorithm that uses a random permutation test to determine the statistical significance of change points (17). Default settings were used to delineate sections of differing copy number (13, 17). (c) LSPHMM (location-specific priors hidden Markov models) uses a modification of hidden Markov models to exploit prior knowledge about location of copy number polymorphisms, which were often detected as outliers in standard hidden Markov models (18). Altered regions were further confirmed by visual inspection. To avoid false-positives due to hybridization “noise,” only those alterations containing ≥3 overlapping clones were considered as segmental loss. Whole arm loss was defined as a loss that encompasses all BAC clones from the telomeric to the centromeric end of the 3p arm. Asummary of filtering criteria and genetic pattern detected for each sample is listed in Supplementary Table S2. Filtering threshold was the same for all except for two samples (Supplementary Table S2).
Copy number variation
Detected alterations were filtered for copy number variations that had previously been identified using the same array platform (11). The list of copy number variation-associated BAC clones has been made publicly available on the UCSC Genome Browser and has also been incorporated into LSPHMM software (11, 18). Examples of copy number variations in normal human individuals are presented in Supplementary Fig. S1.
Statistical analysis
Proportion test was used to test if the numbers of samples that show 3p losses in HGDs and OSCCs were statistically distinguishable. Wilcoxon rank-sum test was used to calculate if the probability distributions of the proportion of altered regions between each sample group were different due to chance alone. A two-tailed Fisher’s exact test was applied to calculate the probability that the observed association for the number of genetic alterations between nonprogressing and progressing LGDs, LGDs and HGDs, and HGDs and OSCCs has occurred by chance alone. The significance threshold was set at P < 0.05. All statistical tests were two-sided and were done in the R statistical environment (v2.6.2).
LOH analysis
LOH analysis focused on a region previously shown to be associated with increased risk of progression, using microsatellite markers D3S1234, D3S1228, and D3S1300, which are mapped to 3p14.2-3p14.1 (6). Microsatellite analyses were done as previously described, and LOH was inferred when the signal ratio of the two alleles differed in the normal samples by at least 50% (6). Microsatellite markers that yielded homozygous alleles were termed “noninformative.”
Results and Discussion
We hypothesized that genetic alterations critical for tumorigenesis might be found at the premalignant stage of oral lesions. To test this, we analyzed the 3p arm of 71 OPLs at high resolution to discover changes that occur during the progression of OPLs. Six discrete, recurrently altered regions were identified in 47 HGDs. These regions were then compared against 24 LGDs and 23 OSCCs to determine the prevalence of such changes in different stages of progression. The set of 94 profiles has been deposited to GEO database at NCBI, series accession no. GSE9193. Graphical representations of the data are available online.6
Segmental alterations on chromosome 3p are more frequent than whole arm loss in HGDs
We used three independent breakpoint-detection algorithms on each sample to identify common regions of loss. Only regions identified by two of three algorithms and confirmed by visual inspection were considered to be lost. In addition, because of the existence of copy number variations in the normal human population, previously identified clones associated with copy number polymorphisms were filtered.
Our data showed that small regions of 3p were commonly lost in HGDs. Regions of segmental genetic loss were found in 80.8% of HGDs, with whole arm loss apparent in only a quarter of cases (12 of 47) and segmental alterations in 55.3% (26 of 47 cases). Segmental alterations showed great variability in size, ranging from 5.3 to 88.7 Mbp (Fig. 1A). Genetic gains were infrequent, with only two HGDs showing such changes. The numbers of 3p alterations in HGDs (38 of 47) and OSCCs (23 of 23) were not statistically different (difference in proportions, -0.15; 95% confidence interval, -0.32 to 0.02; P = 0.19, proportion test), with this evidence of similarly increased genetic instability perhaps accounting for the relatively high progression risk for HGDs. The most striking difference in gene alterations between HGDs and OSCCs was the alteration size for each group. Whereas loss of the whole 3p arm is a common occurrence in OSCCs (3, 9), alterations in HGD lesions did not typically encompass the entire chromosome arm. The sizes of 3p alterations in OSCCs and HGDs were significantly different (P = 1.84 × 10⁻⁵, Wilcoxon rank-sum test).
Fig. 1.

Frequency of alterations on the 3p arm. A, summary of copy number changes in 26 HGDs that showed segmental alterations on 3p. Copy number loss is presented as vertical lines on the left side of the ideogram, with vertical lines on the right side indicating copy number gain. For each sample, altered regions that were concurrently identified by at least two of the three methods were scored and confirmed by visual inspection. The top six minimal altered regions are boxed in orange. B, frequency of alteration of the six minimally altered regions in 23 OSCCs (black), 47 HGDs (purple), and 24 LGDs (light purple, progressing LGDs; white, nonprogressing LGDs). The six minimally altered regions were found to be common in progressing LGDs but infrequent in nonprogressing LGDs (P < 0.003, Fisher’s exact test). C, alignment of four HGDs reveals segmental loss of the FHIT locus at 3p14.2. Each column represents a BAC-derived segment. Columns to the left and right of the center line represent DNA copy number losses and gains, respectively. The green and red lines to the left and right side of the center line represent signal intensity log 2 ratios of -0.5 and +0.5, respectively. Paired normal (N12) and HGD (Oral12) samples are shown in the blue box.
Regions of loss in HGDs and comparison to OSCCs
Those 3p alterations apparent in both HGDs and OSCCs are more likely to represent key genomic changes underlying early oral tumorigenesis. We identified six minimally altered regions that were recurrent in at least 75% of HGD cases that harbored segmental alterations (Fig. 1A). These occurred at 3p25.3-p26.1, 3p25.1-p25.3, 3p24.1, 3p21.31-p22.3, 3p14.2, and 3p14.1 (regions A-F in Fig. 1A; Table 1). The data of the upper and lower boundaries of each minimally altered region are illustrated in Supplementary Fig. S2. Most identified minimally altered regions harbored <10 genes. Significantly, alteration of the previously described oral tumor suppressor gene FHIT (19) occurred at the same high frequency as the other identified minimally altered regions, strongly suggesting the presence of additional candidates driving oral tumorigenesis (Table 1; Fig. 1C). Analysis of all OSCCs revealed loss of the entire 3p arm in 19 of 23 cases, a frequency consistent with previous reports (9, 20-25). The presence of expanded deletions between these stages indicates the occurrence of secondary genetic events from OPLs to invasive disease. This also shows the value of analyzing premalignant lesions to identify early genetic events that are likely masked by subsequent accumulated alterations.
Table 1.
Summary of recurrent minimal altered regions identified in 47 HGDs using 3p tiling-path array CGH
| Region | Chromosome band | Proximal flanking clone* | Start bp coordinate | Distal flanking clone* | End bp coordinate | Size (Mbp) | Genes† | Genes associated with cancer‡ |
|---|---|---|---|---|---|---|---|---|
| A | 3p25.3-p26.1 | 776H3 | 7152555 | 629B9 | 9237884 | 2.09 | 7 | GRM7, RAD18, SRGAP3 |
| B | 3p25.1-p25.3 | 525N21 | 10413544 | 464P4 | 14696702 | 4.28 | 28 | ATG7, TIMP4, PPARG, WNT7A, XPC, RAF1 |
| C | 3p24.1 | 775G14 | 30598681 | 48 E16 | 31812073 | 1.21 | 4 | TGFBR2 |
| D | 3p21.31-p22.3 | 606K24 | 36367289 | 494P19 | 46609837 | 10.24 | 95 | MLH1, LRRFIP2, ITGA9, CTDSPL, PLCD1, DLEC1, MyD88, VILL, ACVR2B, GORASP1, AXUD1, CX3CR1, CCR8, CTNNB1, CCK, CCBP2, TMEM158 |
| E | 3p14.2 | 638K20 | 59594324 | 126N04 | 62484320 | 2.89 | 5 | FHIT |
| F | 3p14.1 | 413B3 | 67349894 | 259O22 | 68785539 | 1.44 | 2 | — |
All the listed human BAC clones were selected from the RPCI-11 library.
RefSeq Genes (release 25) according to UCSC May 2004 assembly.
Genes in boldface are candidate tumor suppressor genes in various cancer types.
Evidence of segmental alterations in progressing LGDs
We next examined progressing LGDs (9 of 24; median follow-up time for all cases, >7 years) to determine if they accumulate more and/or different genetic alterations than their morphologically similar nonprogressing counterparts .05(15 of 24). Segmental losses were significantly associated with progression, occurring in 7 of 9 progressing LGDs and only 2 of 15 nonprogressing LGDs (P = 0.003, Fisher’s exact test). These findings are consistent with previous reports of higher frequency of LOH at 3p microsatellite loci in progressing OPLs (5-7). We also observed that the size of segmental losses was larger for progressing LGD cases (53.7 Mbp versus 0.78 Mbp), with the distribution of losses among nonprogressing (n = 15) and progressing LGDs (n = 9) being significantly different (P = 6.1 × 10⁻⁵, Wilcoxon rank-sum test). Interestingly, the aberrations in progressing LGDs resemble those of HGDs (which, as already stated, carry a higher likelihood of progression to invasive disease; Fig. 1B). To examine this further, we evaluated the LGD cases for the alteration status of the six minimally altered regions identified in HGDs. As anticipated, these regions were found to be frequently altered in progressing LGDs but not in nonprogressing LGDs (P < 0.003; Fig. 1B). These data lend credence to the conclusion that the minimally altered regions identified in HGDs represent critical events in progression to invasive disease.
Disrupted genes in dysplastic lesions
One hundred forty-one annotated genes were spanned by the six minimally altered regions identified above (RefSeq release 25, see listing in Supplementary Table S3). Twenty-eight of these are known to be associated with cancer and 17 have functions potentially related to tumor suppressor activity (Table 1). Specifically, nine of these genes have actually been reported as tumor suppressor genes in cancer (TIMP4, PPARG, WNT7A, TGFBR2, MLH1, CTDSPL, VILL, AXUD1, and FHIT; refs. 26-34). The 17 candidate tumor suppressor genes can be generally categorized to have functions involved in the inhibition of cyclic AMP signaling for the induction of apoptosis (GRM7), DNA damage repair (RAD18, XPC), autophagy-related and ubiquitin-activating enzyme activity (ATG7), metalloendopeptidase inhibitor activity (TIMP4), transcription repression activity (PPARG), apoptosis (ACVR2B and AXUD1), mitogen-activated protein kinase signal transduction (SPGAP3 and TGFBR2), Wnt pathway-mediated antitumorigenic signaling (LRRFIP2, WNT7A, ACVR2b, and AXUD1), and negative regulation of progression through cell cycle (MLH1, DLEC1, and FHIT). Specifically, GRM7 was shown to be methylated in chronic lymphocytic leukemia (35), whereas TGFBR2 is transcriptionally repressed in human epithelial tumors (36).
Our candidate minimally altered regions are in agreement with previous studies of OPLs. Regions A, B, D, E, and F coincide with reported allelic losses identified by microsatellite analysis or copy number loss by conventional CGH (5, 6, 8, 22, 24, 25). The improved resolution in the current work has further fine-mapped these regions and allows us to name specific gene candidates (25). The frequent deletion of 3p24.1 has been delineated to 1.21 Mbp, highlighting the potential importance of TGFBRII in oral tumorigenesis (Table 1).
Sequential 3p deletions during OPL development
We examined the 3p arm for frequency of alteration, genetic pattern, and size of change during the multistep oral tumorigenesis. The increased frequency of 3p loss from LGDs (37.5%) to HGDs (80.8%) was significant (P = 4.6 × 10⁻⁴, Fisher’s exact test). In addition, specific genetic patterns were associated with each histologic group (Fig. 2). Whole chromosome arm changes were observed at much higher frequency for OSCCs tumors (Table 2), with the mean deletion size increasing significantly with disease stage; the average deletion was 41.9 Mbp in LGDs, 67.5 Mbp in HGDs, and 83.5 Mbp in OSCCs (P = 0.016 for LGDs versus HGDs and P = 3.6 × 10⁻⁴ for HGDs versus OSCCs, Wilcoxon rank-sum test). Genetic changes on 3p are sequentially associated with increased progressing stages, as most LGDs have no loss, HGDs have segmental losses, and OSCCs have whole arm loss. These data clearly delineate the escalation of genomic instability at chromosome 3p with histopathologic disease stage. (No associations between age or gender were observed for our genomic data, and likewise, smoking status was not found to influence the level of genetic instability on the 3p arm in our data set; Supplementary Table S4).
Fig. 2.
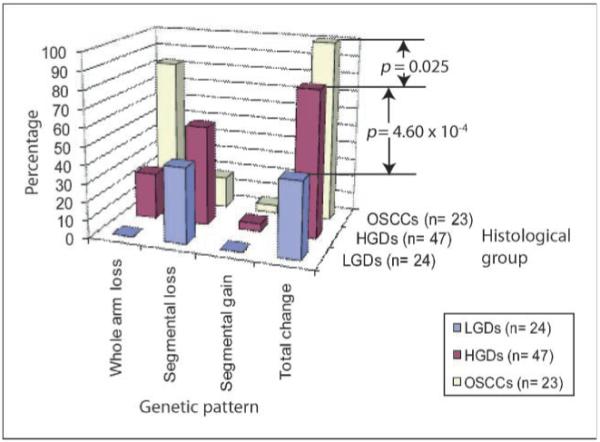
Genetic changes observed in each histologic group on the 3p arm. Significant differences in the frequency of 3p alterations between LGDs and HGDs (P = 4.60 × 10⁻⁴) and between HGDs and OSCCs (P = 0.025) were observed.
Table 2.
Pattern of 3p alterations in oral dysplasias and OSCCs
| Whole arm loss,* % | Segmental alterations,* % | No genetic change,* % | Mean size of loss, Mbp | |
|---|---|---|---|---|
| LGDs† (n = 24) | 0 | 37.5 (9) | 62.5 (15) | 41.9 |
| Nonprogressing LGDs† (n = 15) | 0 | 13.3 (2) | 86.7 (13) | 0.78 |
| Progressing LGDs† (n = 9) | 0 | 77.8 (7) | 22.2 (2) | 53.7 |
| HGDs (n = 47) | 25.5 (12) | 55.3 (26) | 19.1 (9) | 67.5 |
| OSCCs (n = 23) | 82.6 (19) | 17.4 (4) | 0 | 83.5 |
Numbers of cases are given in parentheses.
LGDs are categorized into nonprogressing and progressing LGDs (see Materials and Methods).
Integrating LOH data with copy number alterations
DNA copy number loss can be detected by array CGH, whereas segmental loss or uniparental disomy can be identified by LOH analyses. To explore the relative contributions of each kind of genetic dysregulation to OPLs and OSCCs, we integrated copy number data with informative LOH data for 3p14.1-p14.2 (available for 88 of 94 case). Concordant LOH and copy number loss were observed for 32.9% of these cases, with a further 30.7% exhibiting copy number neutral LOH and 12.5% showing copy number loss not detected by LOH (Supplementary Fig. S3). Complementary integrative analysis by these two approaches facilitates a more complete portrait of genome dysregulation in oral cancer progression and could represent an even more powerful tool for delineating progression risk in OPLs.
Summary
Alteration of chromosome arm 3p has previously been reported as a frequent event for oral cancer, and losses of specific loci within this region have been associated with progression risk in early OPLs. To date, however, there have been no high-resolution analyses of this chromosome arm to identify additional candidates that may drive oral tumorigenesis. By undertaking tiling-path array CGH analysis for a panel of nearly a hundred OPLs and oral tumors, we have confirmed that genetic instability increases on this single arm with progression to invasive cancer; identified new candidate tumor suppressor genes that may contribute to oral cancer progression; and showed that LGDs known to progress to invasive disease harbor gene alterations very similar to those observed in higher-grade dysplastic lesions. This study identified specific regions altered on chromosome 3p that are commonly found in the premalignant stages of oral cancer development but are often masked in invasive tumors due to increased genetic instability.
Supplementary Material
Acknowledgments
We thank Cindy Cui for providing clinical information, and Paul Boutros, Bradley Coe, Raj Chari, Timon Buys, and Cathie Garnis for critical discussions.
Grant support: National Institute of Dental and Craniofacial Research grants R01-DE15965 and R01-DE13124; Genome Canada; the Canadian Institutes of Health Research; and scholarships to I.F.L. Tsui from the Canadian Institutes of Health Research and the Michael Smith Foundation of Health Research.
Footnotes
Disclosure of Potential Conflicts of Interest
No potential conflicts of interest were disclosed.
References
- 1.Garnis C, Buys TP, Lam WL. Genetic alteration and gene expression modulation during cancer progression. Mol Cancer. 2004;3:9. doi: 10.1186/1476-4598-3-9. [DOI] [PMC free article] [PubMed] [Google Scholar]
- 2.Zabarovsky ER, Lerman MI, Minna JD. Tumor suppressor genes on chromosome 3p involved in the pathogenesis of lung and other cancers. Oncogene. 2002;21:6915–35. doi: 10.1038/sj.onc.1205835. [DOI] [PubMed] [Google Scholar]
- 3.Mao L, Hong WK. Papadimitrakopoulou VA. Focus on head and neck cancer. Cancer Cell. 2004;5:311–6. doi: 10.1016/s1535-6108(04)00090-x. [DOI] [PubMed] [Google Scholar]
- 4.Mao L, Lee JS, Fan YH, et al. Frequent microsatellite alterations at chromosomes 9p21 and 3p14 in oral premalignant lesions and their value in cancer risk assessment. Nat Med. 1996;2:682–5. doi: 10.1038/nm0696-682. [DOI] [PubMed] [Google Scholar]
- 5.Partridge M, Pateromichelakis S, Phillips E, Emilion GG, A’Hern RP, Langdon JD. A case-control study confirms that microsatellite assay can identify patients at risk of developing oral squamous cell carcinoma within a field of cancerization. Cancer Res. 2000;60:3893–8. [PubMed] [Google Scholar]
- 6.Rosin MP, Cheng X, Poh C, et al. Use of allelic loss to predict malignant risk for low-grade oral epithelial dysplasia. Clin Cancer Res. 2000;6:357–62. [PubMed] [Google Scholar]
- 7.Rosin MP, Lam WL, Poh C, et al. 3p14 and 9p21 loss is a simple tool for predicting second oral malignancy at previously treated oral cancer sites. Cancer Res. 2002;62:6447–50. [PubMed] [Google Scholar]
- 8.Califano J, van der Riet P, Westra W, et al. Genetic progression model for head and neck cancer: implications for field cancerization. Cancer Res. 1996;56:2488–92. [PubMed] [Google Scholar]
- 9.Baldwin C, Garnis C, Zhang L, Rosin MP, Lam WL. Multiple microalterations detected at high frequency in oral cancer. Cancer Res. 2005;65:7561–7. doi: 10.1158/0008-5472.CAN-05-1513. [DOI] [PubMed] [Google Scholar]
- 10.Ishkanian AS, Malloff CA, Watson SK, et al. A tiling resolution DNA microarray with complete coverage of the human genome. Nat Genet. 2004;36:299–303. doi: 10.1038/ng1307. [DOI] [PubMed] [Google Scholar]
- 11.Wong KK, deLeeuw RJ, Dosanjh NS, et al. A comprehensive analysis of common copy-number variations in the human genome. Am J Hum Genet. 2007;80:91–104. doi: 10.1086/510560. [DOI] [PMC free article] [PubMed] [Google Scholar]
- 12.Coe BP, Lockwood WW, Girard L, et al. Differential disruption of cell cycle pathways in small cell and non-small cell lung cancer. Br J Cancer. 2006;94:1927–35. doi: 10.1038/sj.bjc.6603167. [DOI] [PMC free article] [PubMed] [Google Scholar]
- 13.Chari R, Lockwood WW, Lam WL. Computational methods for the analysis of array comparative genomic hybridization. Cancer Inform. 2006;2:48–58. [PMC free article] [PubMed] [Google Scholar]
- 14.Khojasteh M, Lam WL, Ward RK, MacAulay C. A stepwise framework for the normalization of array CGH data. BMC Bioinformatics. 2005;6:274. doi: 10.1186/1471-2105-6-274. [DOI] [PMC free article] [PubMed] [Google Scholar]
- 15.Chi B, DeLeeuw RJ, Coe BP, MacAulay C, Lam WL. SeeGH—a software tool for visualization of whole genome array comparative genomic hybridization data. BMC Bioinformatics. 2004;5:13. doi: 10.1186/1471-2105-5-13. [DOI] [PMC free article] [PubMed] [Google Scholar]
- 16.Jong K, Marchiori E, Meijer G, Vaart AV, Ylstra B. Breakpoint identification and smoothing of array comparative genomic hybridization data. Bioinformatics. 2004;20:3636–7. doi: 10.1093/bioinformatics/bth355. [DOI] [PubMed] [Google Scholar]
- 17.Olshen AB, Venkatraman ES, Lucito R, Wigler M. Circular binary segmentation for the analysis of array-based DNA copy number data. Biostatistics. 2004;5:557–72. doi: 10.1093/biostatistics/kxh008. [DOI] [PubMed] [Google Scholar]
- 18.Shah SP, Xuan X, DeLeeuw RJ, et al. Integrating copy number polymorphisms into array CGH analysis using a robust HMM. Bioinformatics. 2006;22:e431–9. doi: 10.1093/bioinformatics/btl238. [DOI] [PubMed] [Google Scholar]
- 19.Lee JI, Soria JC, Hassan K, et al. Loss of Fhit expression is a predictor of poor outcome in tongue cancer. Cancer Res. 2001;61:837–41. [PubMed] [Google Scholar]
- 20.Smeets SJ, Braakhuis BJ, Abbas S, et al. Genome-wide DNA copy number alterations in head and neck squamous cell carcinomas with or without oncogene-expressing human papillomavirus. Oncogene. 2006;25:2558–64. doi: 10.1038/sj.onc.1209275. [DOI] [PubMed] [Google Scholar]
- 21.Snijders AM, Schmidt BL, Fridlyand J, et al. Rare amplicons implicate frequent deregulation of cell fate specification pathways in oral squamous cell carcinoma. Oncogene. 2005;24:4232–42. doi: 10.1038/sj.onc.1208601. [DOI] [PubMed] [Google Scholar]
- 22.Chakraborty SB, Dasgupta S, Roy A, et al. Differential deletions in 3p are associated with the development of head and neck squamous cell carcinoma in Indian patients. Cancer Genet Cytogenet. 2003;146:130–8. doi: 10.1016/s0165-4608(03)00127-4. [DOI] [PubMed] [Google Scholar]
- 23.Garnis C, Baldwin C, Zhang L, Rosin MP, Lam WL. Use of complete coverage array comparative genomic hybridization to define copy number alterations on chromosome 3p in oral squamous cell carcinomas. Cancer Res. 2003;63:8582–5. [PubMed] [Google Scholar]
- 24.Kayahara H, Yamagata H, Tanioka H, Miki T, Hamakawa H. Frequent loss of heterozygosity at 3p25-p26 is associated with invasive oral squamous cell carcinoma. J Hum Genet. 2001;46:335–41. doi: 10.1007/s100380170069. [DOI] [PubMed] [Google Scholar]
- 25.Noutomi Y, Oga A, Uchida K, et al. Comparative genomic hybridization reveals genetic progression of oral squamous cell carcinoma from dysplasia via two different tumourigenic pathways. J Pathol. 2006;210:67–74. doi: 10.1002/path.2015. [DOI] [PubMed] [Google Scholar]
- 26.Riddick AC, Shukla CJ, Pennington CJ, et al. Identification of degradome components associated with prostate cancer progression by expression analysis of human prostatic tissues. Br J Cancer. 2005;92:2171–80. doi: 10.1038/sj.bjc.6602630. [DOI] [PMC free article] [PubMed] [Google Scholar]
- 27.Haider AS, Peters SB, Kaporis H, et al. Genomic analysis defines a cancer-specific gene expression signature for human squamous cell carcinoma and distinguishes malignant hyperproliferation from benign hyperplasia. J Invest Dermatol. 2006;126:869–81. doi: 10.1038/sj.jid.5700157. [DOI] [PubMed] [Google Scholar]
- 28.Ishiguro H, Tsunoda T, Tanaka T, Fujii Y, Nakamura Y, Furukawa Y. Identification of AXUD1, a novel human gene induced by AXIN1 and its reduced expression in human carcinomas of the lung, liver, colon and kidney. Oncogene. 2001;20:5062–6. doi: 10.1038/sj.onc.1204603. [DOI] [PubMed] [Google Scholar]
- 29.Kashuba VI, Li J, Wang F, et al. RBSP3 (HYA22) is a tumor suppressor gene implicated in major epithelial malignancies. Proc Natl Acad Sci U S A. 2004;101:4906–11. doi: 10.1073/pnas.0401238101. [DOI] [PMC free article] [PubMed] [Google Scholar]
- 30.Kujan O, Oliver R, Roz L, et al. Fragile histidine triad expression in oral squamous cell carcinoma and precursor lesions. Clin Cancer Res. 2006;12:6723–9. doi: 10.1158/1078-0432.CCR-06-1475. [DOI] [PubMed] [Google Scholar]
- 31.Michalik L, Desvergne B, Wahli W. Peroxisome-proliferator-activated receptors and cancers: complex stories. Nat Rev Cancer. 2004;4:61–70. doi: 10.1038/nrc1254. [DOI] [PubMed] [Google Scholar]
- 32.Sengupta S, Chakrabarti S, Roy A, Panda CK, Roychoudhury S. Inactivation of human mutL homolog 1 and mutS homolog 2 genes in head and neck squamous cell carcinoma tumors and leukoplakia samples by promoter hypermethylation and its relation with microsatellite instability phenotype. Cancer. 2007;109:703–12. doi: 10.1002/cncr.22430. [DOI] [PubMed] [Google Scholar]
- 33.Winn RA, Van Scoyk M, Hammond M, et al. Anti-tumorigenic effect of Wnt 7a and Fzd 9 in non-small cell lung cancer cells is mediated through ERK-5-dependent activation of peroxisome proliferator-activated receptor γ. J Biol Chem. 2006;281:26943–50. doi: 10.1074/jbc.M604145200. [DOI] [PubMed] [Google Scholar]
- 34.You KT, Li LS, Kim NG, et al. Selective translational repression of truncated proteins from frame-shift mutation-derived mRNAs in tumors. PLoS Biol. 2007;5:e109. doi: 10.1371/journal.pbio.0050109. [DOI] [PMC free article] [PubMed] [Google Scholar]
- 35.Rush LJ, Raval A, Funchain P, et al. Epigenetic profiling in chronic lymphocytic leukemia reveals novel methylation targets. Cancer Res. 2004;64:2424–33. doi: 10.1158/0008-5472.can-03-2870. [DOI] [PubMed] [Google Scholar]
- 36.Bierie B, Moses HL. Tumour microenvironment: TGFβ: the molecular Jekyll and Hyde of cancer. Nat Rev Cancer. 2006;6:506–20. doi: 10.1038/nrc1926. [DOI] [PubMed] [Google Scholar]
Associated Data
This section collects any data citations, data availability statements, or supplementary materials included in this article.