

Abstract
Previous studies have shown that the breast cancer suppressor BRCA1 stimulates antioxidant gene expression and protects cells against oxidative stress. To further examine this important function, we tested whether BRCA1 could modulate intracellular levels of reactive oxygen species (ROS). Wild-type BRCA1 (but not a cancer-associated mutant) significantly reduced ROS levels, determined by DCF fluorescence assays by flow cytometry and confocal microscopy. The BRCA1 and REF1 pathways for reduction of ROS levels appear to exhibit cross-talk. BRCA1 also reduced the levels of protein nitration and H2O2-induced oxidative damage to DNA. Thus, BRCA1 may protect cellular macromolecules by reducing intracellular ROS levels.
Keywords: BRCA1, reactive oxygen species (ROS), nitrotyrosine, 8-oxoguanine, REF1, oxidative stress
INTRODUCTION
The breast cancer susceptibility gene BRCA1 encodes a tumor suppressor protein, mutations of which account for about 40-50% of hereditary breast cancers [1]. In sporadic (non-hereditary) breast cancers, BRCA1 expression is absent or decreased in about 30-40% of cases [2]. BRCA1 is a multi-functional protein that has been implicated in regulation of the cell cycle, chemo/radiosensitivity, various transcriptional pathways, and DNA damage signaling and repair (reviewed in [3]). And BRCA1, along with another RING-domain protein (BARD1), exerts an E3 ubiquitin ligase function that may contribute to some of its functional activity [4]. In regard to its role in the DNA damage response, BRCA1 is thought to function as a caretaker in the maintenance of genomic integrity.
Oxidative stress due to the chronic over-exposure to reactive oxygen species (ROS) [eg., superoxide (O2−) and hydrogen peroxide (H2O2)] is though to contribute to a variety of processes, including aging, degenerative diseases, and cancer [5]. On the other hand, ROS also appear to play an essential role as secondary messengers in the normal regulation of a variety of physiological processes [6], suggesting that their production is a double-edged sword. Previously, we found that BRCA1 stimulates expression of various genes involved in the antioxidant response (eg., glutathione S-transferases and oxidoreductases) and confers resistance to oxidizing agents (H2O2 and paraquat) [7]. In addition, BRCA1 stimulated the activity of the antioxidant response transcription factor NFE2L2 (NRF2), via the antioxidant response element.
Here, we have extended our studies of the antioxidant property of BRCA1 by determining if over- and under-expression of BRCA1 can modulate intracellular ROS levels as well as the levels of oxidative lesions of proteins and DNA.
MATERIALS AND METHODS
Cell lines and culture
Human breast carcinoma (MCF-7, T47D), immortalized mammary epithelial (MCF-10A), and prostate carcinoma (DU-145) cells were obtained from the American Type Culture Collection. The cells were cultured in DMEM supplemented with 5% or 10% fetal calf serum, non-essential amino acids (100 mM), L-glutamine (5 mM), streptomycin (100 μ/ml) and penicillin (100 U/ml) [all from BioWhittaker, Walkersville, MD], as described before [7].
Expression vectors and reagents
The wild-type (wt) BRCA1 cDNA (wtBRCA1) in the pcDNA3 vector (Invitrogen, Carlsbard, CA) was described earlier [7]. The wt-REF1 and dominant negative (DN) REF1 cDNAs (in the pcDNA3.1 vector) were generously provided by Dr. Martin L. Smith (Indiana University Cancer Center, Indianapolis, IN). DN-REF1 contains an alanine substitution for cysteine at codon 65, and it blocks redox signaling to p53 and other REF1-responsive proteins [8]. DMSO, H2O2, and t-butyl hydroperoxide (TBHP) were obtained from the Sigma Chemical Co. (St Louis, MO).
Transient transfections
Subconfluent proliferating cells were transfected overnight with the indicated expression vector(s) [6 μg of plasmid DNA per well for a six-well plate or 30 μg per 10-cm dish] using Lipofectamine 2000 transfection reagent (Invitrogen) according to the manufacturer's protocol. The transfected cells were washed and then incubated for several hours in fresh culture medium to allow them to recover from the transfection.
Small interfering (si) RNA treatments
Proliferating cells at about 30-40% of confluency were pre-treated with the siRNA of interest (100 nM for 48-72 hr) using siPORT Amine transfection reagent (Ambion, Foster City, CA). The efficacy of each knockdown was confirmed by Western blotting. The following siRNAs were used in this study: control-siRNA [ON-TARGET plus Non-targeting siRNA (D-001810-01, Dharmacon, Chicago, IL)]; BRCA1-siRNA [pool of two siRNAs custom synthesized by Dharmacon (5′ →3′: CAGCTACCCTTCCATCATA and CTAGAAATCTGTTGCTATG)]; REF1-siRNA [pool of two siRNAs custom made by Dharmacon (5′ →3′: CAAAGTTTCTTACGGCATA and ACAGCAAGATCCGTTCCAA)].
Hydrogen peroxide treatments
Subconfluent proliferating cells were treated with the indicated concentrations of H2O2 in culture medium containing 5% fetal calf serum for 24 hr at 37°C.
Western blotting
Cells were washed with PBS and lysed using RIPA buffer (Sigma) supplemented with protease inhibitor cocktail [Complete Mini, EDTA-free; 11836170-001, Roche Biochemicals, Indianapolis, IN] @ 0°C for 30 min. The lysed cells were rocked at 4°C for 30 min, followed by centrifugation at 12,000 × g for 20 min. The protein content of the supernatant was measured by the Bradford method (BioRad, Hercules, CA); and the supernatants were stored at −80°C. Aliquots of whole cell protein (40 μg) in 4X lithium dodecyl sulfate sample buffer were analyzed on pre-cast 4-20% Tris-glycine gels (Invitrogen). Separated proteins were transferred to PVDF membranes (Millipore, Billerica, MA) and blocked for 1 hr in blocking buffer (Sigma). The membranes were blotted with primary antibody (2 hr at 25°C) and incubated with species-specific horseradish peroxidase (HRP)-conjugated secondary antibody (1:10,000 dilution, Santa Cruz). Protein bands were visualized using the enhanced chemiluminescence system (Santa Cruz). Kaleidoscope pre-stained markers (BioRad) were used as molecular size standards. The primary antibodies were: BRCA1 (C-20, Santa Cruz, 1:200); REF1 (E-17, Santa Cruz, 1:200); and α-actin (C-11, Santa Cruz, 1:400).
Determination of intracellular ROS levels
Flow cytometry
ROS levels were monitored using carboxy-2′,7′-dichlorodihydro-fluorescein diacetate (carboxy-H2DCFDA) [#C400, Molecular Probes, Eugene, OR], which is converted into a non-fluorescent derivative (carboxy-H2DCF) by intracellular esterases [9]. Carboxy-H2DCF is membrane impermeant and is oxidized to the fluorescent derivative carboxy-DCF by intracellular ROS. After the indicated treatments, cells were washed with PBS; incubated with carboxy-H2DCFDA (10 µM × 60 min @ 37°C) in phenol red-free DMEM; washed twice with PBS; scraped into a 5 ml glass tube; made into a single cell suspension using a 1000-μl pipette; and analyzed by flow cytometry [10]. The geometric means of the carboxyDCF fluorescence distributions (obtained at the fluorescein excitation/emission maxima) were calculated using the FCS Express Version 3 software (DeNovo Software, Los Angeles, CA). These values were expressed as means ± SEMs of at least three independent experiments.
Confocal microscopy
ROS levels were assayed using the Image-iT™ LIVE Green Reactive Oxygen Species Detection Kit (Invitrogen). Briefly, cells were plated onto a ‘Fluorodish’, a glass bottom 35-mm cell culture dish designed for confocal microscopy (World Precision Instruments, Sarasota, FL), 24 hr before transfection. After the indicated treatments, the cells were gently washed with warm Hank's balanced salt solution (HBSS) and incubated with carboxy-H2DCFDA (10 µM × 60 min at 37°C) to detect ROS and Mitotraker Red CMXRos (Invitrogen) [50 nM for the last 30 min] to detect mitochondria. The cells were washed with HBSS; incubated with Hoechst 33342 (1 μM × 5 min at 37°C) to stain the nuclei; washed; and visualized using an Olympus Fluoview-FV300 Laser Scanning Confocal System. The fluorescence from the dyes was observed using a standard fluorescein filter set, rhodamine filters, and a filter DAPI set, respectively. Green ROS fluorescence was quantitated using Metamorf image analysis software (Molecular Devices, Downington, PA) based on 100 cells and expressed as means ± SEMs (arbitrary units) of three independent experiments.
Determination of nitrosylated protein levels
After the indicated cell transfections or treatments, whole cell lysates were prepared using RIPA buffer and the protein content was measured. The lysate was stored at −70°C until used. Assays were carried out using 200 μg of whole cell protein by a sandwich ELISA kit [(Nitrotyrosine EIA; #21055, Oxis (Foster City, CA)]. Nitrotyrosine values were calculated as units per μg of protein, based on a standard curve. Values were expressed as means ± SEMs of at least three independent experiments.
Determination of 8-oxoguanine (8-oxo-G) lesions in DNA
8-Oxo-G lesions were measured using an OxyDNA Assay Kit, Fluorometric (Calbiochem). This assay based on the direct and selective binding of an FITC-conjugated fluorescent probe to 8-oxo-G lesions in DNA. After the indicated treatment(s), cells were washed with PBS; collected by trypsinization; fixed with 1% paraformaldehyde (Sigma) for 15 min @ 0°C; fixed again using ice cold 70% ethanol; labeled using the FITC-conjugate per the manufacturer's protocol; and analyzed by flow cytometry as above. Fluorescence values were expressed as means ± SEMs of four independent experiments.
Statistical methods
Statistical comparisons were made using the two-tailed Student's t-test.
RESULTS
BRCA1 regulates intracellular ROS levels, determined by flow cytometry
Proliferating cells were transfected with the indicated vector(s), exposed to H2O2 (0, 75, or 150 nM) for 24 hr, and assayed for carboxy-DCF fluorescence by flow cytometry. We noted that transfection with empty pcDNA3 vector increased the carboxy-DCF fluorescence, indicating that this procedure itself causes oxidative stress. In MCF-7 cells, H2O2 caused more modest increases in ROS levels than the pcDNA3 transfection (Figs. 1A-1B). At all three H2O2 concentrations, wtBRCA1 vector caused reduced levels of ROS, compared with pcDNA3 (P < 0.05, two-tailed t-tests), consistent with a reduction in ROS due to BRCA1 over-expression. [The results for 75 nM H2O2 were similar to those for 150 nM H2O2 and are not shown.]
Fig. 1. BRCA1 over-expression reduces ROS levels in MCF-7 cells.
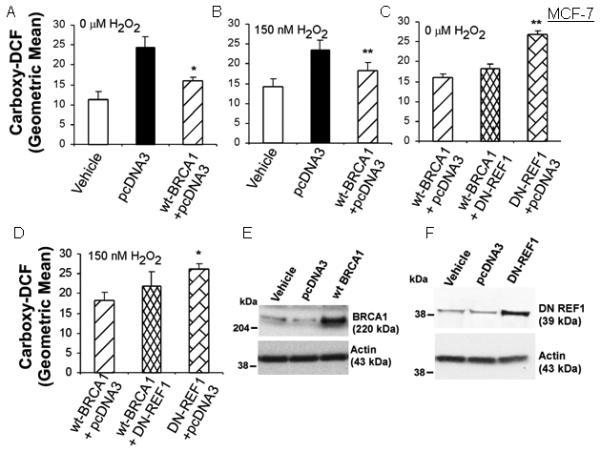
Cells were transfected overnight as indicated; treated ± H2O2 for 24 hr; and assayed for carboxy-DCF fluorescence by flow cytometry. Values are means ± SEMs of the geometric mean fluorescence from at least three independent experiments. Note: Each transfection used the same total amount of plasmid DNA, with pcDNA3 used to make up the difference. Comparisons were made to pcDNA3 vector in A-B and to wtBRCA1 in C-D. **P < 0.05, *P < 0.002. E and F show the BRCA1 and DN-REF1 proteins levels in transfected cells.
In parallel studies, we tested the effect of dominant negative REF1 on ROS levels. In Figs. 1A-1D, we kept the total content of transfected DNA constant (12 μg/well) by addition of pcDNA3 vector. Each active vector (wtBRCA1 and DN-REF1) was used at 6 μg/well. In cells transfected with DN-REF1, ROS levels were slightly higher than in cells transfected with pcDNA3 alone, but the differences were not significant; and the combination (wtBRCA1+DN-REF1) gave ROS levels that were higher than those in cells transfected with wtBRCA1 without DN-REF1 but lower than those in cells transfected with DN-REF1 without wtBRCA1 (Figs. 1C-1D). These findings suggest that DN-REF1 partially overcomes the ability of BRCA1 to reduce ROS levels. Comparable results were observed using T47D cells (Supplementary Fig. 1).
We next tested the effect of BRCA1 knockdown on ROS levels. In MCF-7, control (CON)-siRNA (± H2O2 treatment) increased ROS levels; but in all cases, cells treated with BRCA1-siRNA showed higher ROS levels than cells treated with control-siRNA (P < 0.05) [Figs. 2A-2B]. Transfection of wtREF1 reduced the increase in ROS due to BRCA1-siRNA, but ROS levels remained higher than in the presence of (wtREF1+control-siRNA) [Figs. 2C-2D]. Results for 75 nM H2O2 were similar to those for 150 nM H2O2 (data not shown). Similar results were found in T47D cells (Supplementary Fig. 2), suggesting BRCA1 knockdown increases ROS levels in a manner that is partly compensated by REF1 over-expression.
Fig. 2. BRCA1 knockdown increases ROS levels in MCF-7 cells.
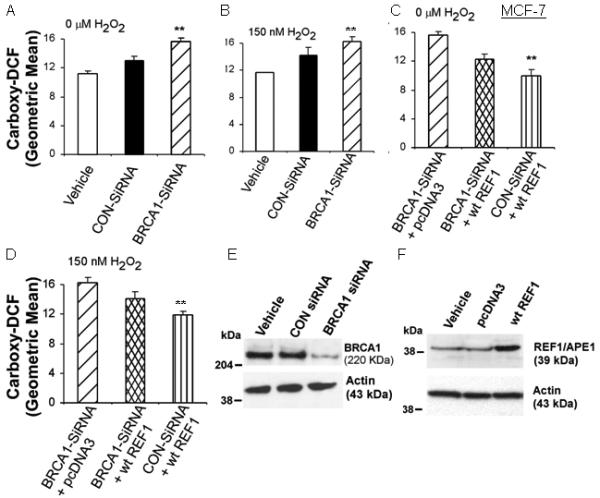
Cells were transfected with the indicated siRNA for 48 hr or/and expression vector, treated ± H2O2 for 24 hr; and then assayed for carboxy-DCF fluorescence by flow cytometry. Values are means ± SEMs of from three independent experiments. Comparisons were made to control-siRNA in A-B and to BRCA1-siRNA in C-D. **P < 0.05. E and F show the BRCA1 and REF1 protein levels in transfected cells.
Like BRCA1-siRNA, REF1-siRNA increased the ROS levels more than did control-siRNA (P < 0.05), without or with H2O2 (Fig. 3A-3B). wtBRCA1 partially reversed the increase in ROS due to REF1-siRNA (Figs. 3C-3D). However, ROS levels due to (REF1-siRNA+ wtBRCA1) remained higher than those due to (control-siRNA+wtBRCA1). Results for 75 nM H2O2 were similar to those for 150 nM H2O2 (data not shown). Comparable results were observed in T47D cells (Supplementary Fig. 3).
Fig. 3. wtBRCA1 attenuates the increase in ROS levels due to REF1-siRNA in MCF-7 cells.
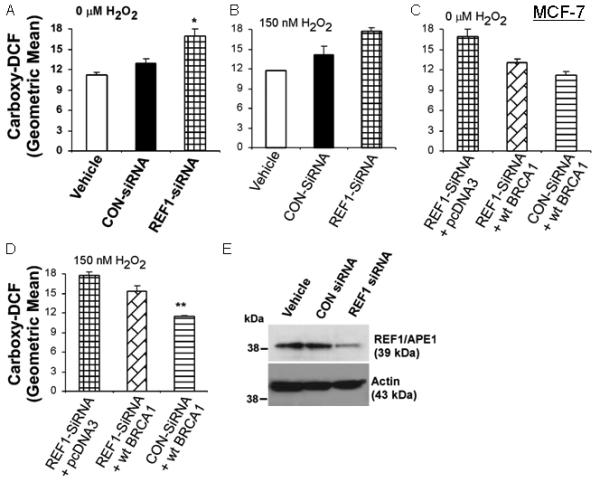
Assays were performed in Fig. 2, except that REF1-siRNA was used instead of BRCA1-siRNA and wtBRCA1 was transfected instead of wt-REF1.
We also tested the effect of BRCA1 on ROS levels in a non-tumorigenic human mammary epithelial cell line. MCF-10A is an immortalized line of mammary epithelial cells derived from a patient with benign fibrocystic disease [11]. Here, the results were similar to those obtained using MCF-7 or T47D cells. Thus, empty pcDNA3 vector caused an increased in ROS levels and wtBRCA1 reduced the ROS levels relative to that observed using pcDNA3 vector (Supplementary Fig. 4A-4B). Conversely, BRCA1-siRNA caused an increase in ROS levels relative to control-siRNA (Supplementary Fig. 4C-4D).
Finally, we tested the effect of a mutant BRCA1 protein on ROS levels in T47D and MCF-7 cells. BRCA1-T300G is a breast cancer-associated point mutation that encodes a full-length loss of function mutant BRCA1 protein (C61G) within the N-terminal RING domain of BRCA1 [4,7]. In both T47D and MCF-7, ROS levels in cells transfected with BRCA1-T300G were higher than those in cells transfected with empty pcDNA3 vector (Supplementary Fig. 5). Like wild-type BRCA1, the BRCA1-T300G protein was stable and well-expressed (data not shown). These findings indicate that the T300G mutation abrogates the ability of the BRCA1 protein to lower ROS levels; and they raise the possibility that the mutant BRCA1 protein may actually increase ROS levels.
Examples of flow cytometry fluorescence histograms for MCF-7 cells treated with H2O2 and/or transfected with wtBRCA1 or pcDNA3 are shown in Fig. 4A-4C. In each case, wtBRCA1 shifted the fluorescence distribution toward lower intensity, relative to pcDNA3 vector. In addition, the oxidant TBHP (t-butyl hydroperoxide) increased ROS levels (Fig. 4D); and ROS levels due to (wtBRCA1+TBHP) were lower than those due to (pcDNA3+TBHP) [Fig. 4E].
Fig. 4. Examples of flow cytometry distributions of carboxy-DCF fluorescence.
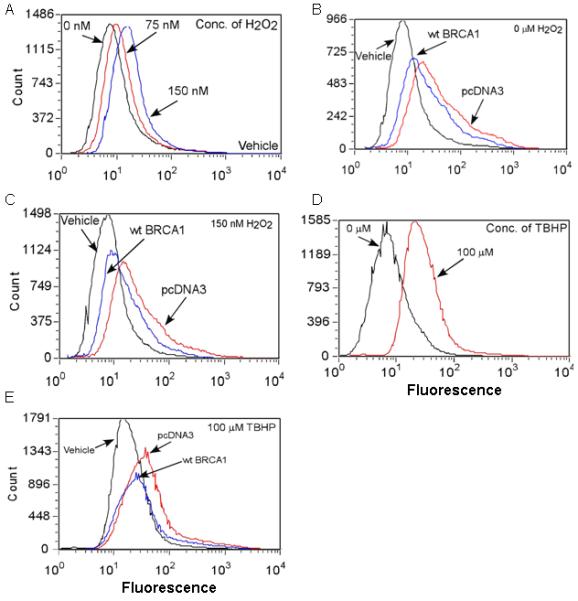
MCF-7 cells were transfected overnight as indicated; exposed to H2O2 or TBHP for 24 hr; and assayed to determine the fluorescence intensity distribution by flow cytometry.
ROS assessment by confocal microscopy
We tested the effect of BRCA1 on ROS levels, visualized by the same green fluorescent dye used for flow cytometry (H2DCFDA). To allow subcellular localization of ROS, cells were co-stained with Mitotraker Red CMXRos (which stains mitochondria red) and Hoechst 33342 (which stains nuclei blue).
Fig. 5 shows confocal imaging of MCF-7 cells transfected with wtBRCA1 (vs pcDNA3 vector or vehicle), without H2O2 treatment. Here, pcDNA3-transfected cells showed ROS staining in both nuclei and cytoplasm (third row). The extent of staining appears to be greater than in vehicle treated cells; while ROS levels in wtBRCA1-transfected cells appear lower than in pcDNA3-transfected cells. The merge of ROS and mitochondrial images (second row) shows a limited amount of mitochondrial ROS, which appear yellow. Supplementary Fig. 6 shows a magnified view of cells transfected and treated with H2O2 (150 nM) for 24 hr. In addition to nuclear and cytoplasmic ROS staining (second row), significant mitochondrial ROS staining was seen (third row) in pcDNA3-transfected cells. wtBRCA1-transfected cells showed lower levels of mitochondrial ROS. Comparable results were observed in cells treated with 75 nM of H2O2 (Supplementary Fig. 7); and lower power images of cells treated with 150 nM of H2O2 are shown in Supplementary Fig. 8. In cells transfected and treated with 100 μM of TBHP for 24 hr, ROS were seen in nucleus, cytoplasm, and mitochondria, with an apparent reduction of ROS levels in all sites in wtBRCA1-transfected relative to pcDNA3-transfected cells (Supplementary Fig. 9).
Fig. 5. Confocal microscopic images of transfected MCF-7 cells.
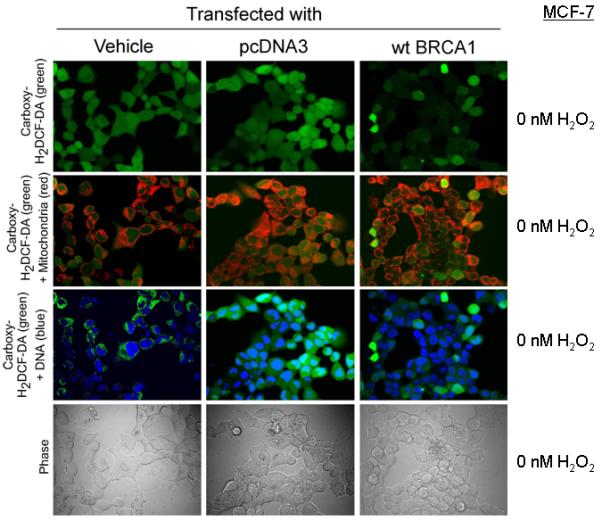
Cells were transfected as indicated; stained to detect ROS (carboxy-H2DCFDA), mitochondria (Mitotraker Red CMXRos), and nuclei (Hoechst 33342); and imaged by confocal microscopy.
Fig. 6 shows quantification of confocal ROS images of MCF-7 cells. Consistent with the flow cytometry data, in non-oxidant-treated MCF-7 cells, ROS levels were lower in wtBRCA1-than pcDNA3-transfected cells (P < 0.002) [Fig. 6A]. ROS levels were higher in cells transfected with (wtBRCA1+DN-REF1) compared to (wtBRCA1+pcDNA3), with the highest levels in cells transfected with (DN-REF1+pcDNA3) (P < 0.05) [Fig. 6B]. In cells transfected and treated with TBHP, ROS levels were lower than in wtBRCA1- than pcDNA3- or vehicle-transfected cells (P < 0.05) [Fig. 6C]. Results obtained in MCF-7 cells transfected and treated with 75 nM (data not shown) or 150 nM of H2O2 (Fig. 6D-6E) were similar to those observed in non-oxidant-treated cells. T47D cells gave comparable results (Supplementary Fig. 10). In all cases, wtBRCA1 caused a decrease in ROS levels that was partly reversed by DN-REF1.
Fig. 6. Quantitation of carboxy-DCF fluorescence by confocal microscopy.
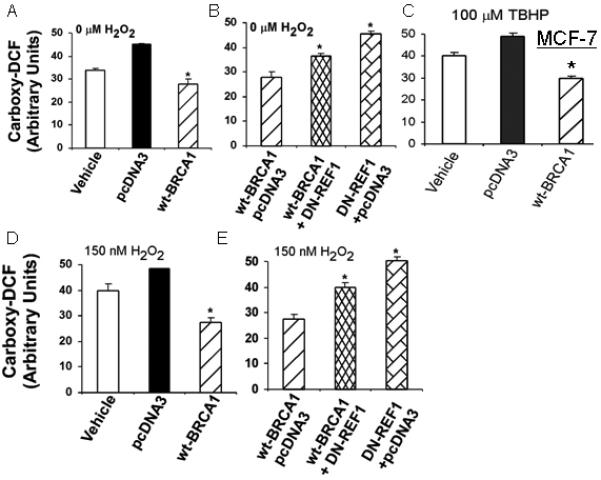
MCF-7 cells were treated as indicated, followed by confocal imaging. The carboxy-DCF green fluorescence was quantified by image analysis (see Methods section). Values are means ± SEMs for three independent experiments. *P < 0.002.
BRCA1 inhibits protein nitration
Nitrotyrosine is a product of nitration of tyrosine residues of proteins by peroxynitrite (ONOO−), which is formed by reaction of O2− and nitric oxide (NO). We tested the effect of BRCA1 on protein nitration in MCF-7, MCF-10A, and T47D cells, using a commercial ELISA for nitrotyrosine. Here, pcDNA3 vector caused no change or a modest increase in nitrotyrosine levels (Fig. 7). In all cell lines, wtBRCA1 caused a reduction in nitrotyrosine levels, compared to vehicle-treated or pcDNA3-transfected cells (P < 0.05), and an increase in BRCA1 protein levels. Consistent with these data, BRCA1-siRNA caused a reduction in nitrotyrosine levels (P < 0.05) and in BRCA1 levels in these cell lines (Fig. 8), suggesting that BRCA1 can inhibit protein nitration.
Fig. 7. BRCA1 over-expression reduces protein nitration.
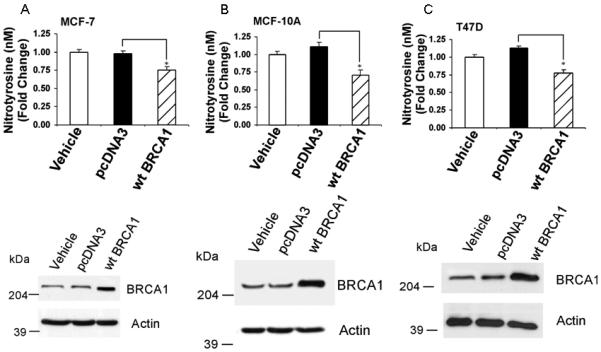
MCF-7 (A), MCF-10A (B), or T47D (C) cells were transfected overnight; washed; post-incubated for 24 hr to allow gene expression; and harvested to determine nitrotyrosine levels by ELISA. The nitrotyrosine content per μg whole cell protein was normalized to the vehicle-treated cells. Values are means ± SEMs of three independent experiments (*P < 0.05). Western blots show the BRCA1 protein levels for the different transfection conditions.
Fig. 8. BRCA1 knockdown increases protein nitration.
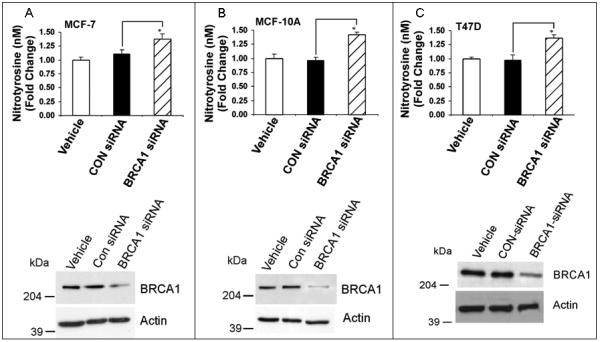
Cells were treated with vehicle only, control (CON)-siRNA, or BRCA1-siRNA (100 nM) for 72 hr and assayed for nitrotyrosine levels as in Fig. 7. *P < 0.05.
BRCA1 reduces 8-oxo-G lesions of DNA
8-Oxo-G lesions were quantified by flow cytometry, as described in the Methods section. H2O2 caused modest but detectable increases in the levels of 8-oxo-G in DNA; and wtBRCA1 reduced (Fig. 9A) while BRCA1-siRNA further increased (Fig. 9B) the 8-oxo-G levels in H2O2-treated cells. Fig. 9C shows an experiment in which cells were transfected with wtBRCA1 or pcDNA3 vector, treated with H2O2 (30 nM) for 24 hr, and then washed to remove any remaining H2O2 and observe changes in 8-oxo-G levels with time after the washout. As expected, the 8-oxo-G levels were lower in wtBRCA1-transfected cells at time 0 (no washout) [P < 0.05]. At 9 hr, 8-oxo-G levels were lower than at time 0 and lower in wtBRCA1-transfected than pcDNA3-transfected cells (P < 0.05). By 24 hr, there was a further reduction in 8-oxo-G in pcDNA3-transfected cells; and the 8-oxo-G levels were similar in wtBRCA1 and pcDNA3 transfected cells. Figs. 9D-9I show representative histograms of 8-oxoG fluorescence corresponding to the conditions tested in Figs. 9A and 9B. These results suggest that BRCA1 can reduce the levels of 8-oxo-G lesions of DNA induced by H2O2.
Fig. 9. BRCA1 reduces 8-oxoguanine DNA lesions.
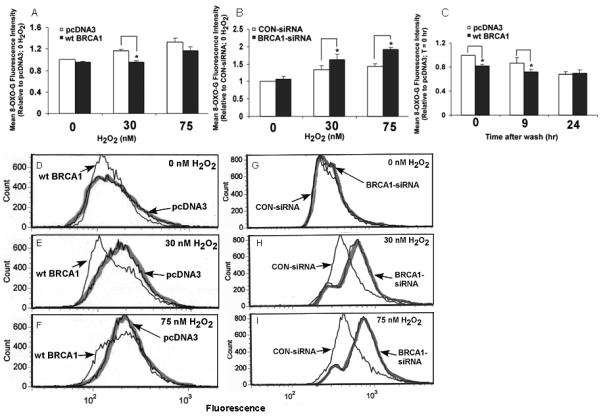
DU-145 cells were transfected with wtBRCA1 vs pcDNA3 vector (A) or BRCA1-siRNA vs control-siRNA (B); exposed to H2O2 for 24 hr; and processed for flow cytometry to detect 8-oxoguanine. Values are means ± SEMs of the geometric mean fluorescence (normalized to control conditions) from four independent experiments. In C, cells were transfected with wtBRCA1 vs pcDNA3; exposed to H2O2 (30 nM) for 24 hr; washed to remove residual H2O2; and incubated in fresh culture medium. 8-Oxoguanine fluorescence is shown as a function of time after wash. *P<0.05. D-I show examples of flow cytometry histograms of 8-oxoguanine fluorescence corresponding to conditions in panel A (D-F) and panel B (G-I).
DISCUSSION
We showed that BRCA1 regulates intracellular ROS levels in several breast carcinoma cell lines and in a non-tumor human mammary epithelial cell line, based on carboxy-DCF fluorescence measurements by flow cytometry and confocal microscopy. Carboxy-DCF is O−, H2O2, and other oxygen species, and so provides an estimate of the total burden of ROS. Although the changes in ROS levels due to BRCA1 were not always large in magnitude, they were easily detectable. Such changes may be physiologically significant, particularly if they are prolonged, since ROS contribute to so many normal and pathologic processes [5,6]. A breast cancer-associated mutation (T300G, or C61G) abrogated the ability of BRCA1 to reduce ROS levels; and expression of the T300G mutant protein actually increased ROS levels, raising the possibility that the mutant protein functions as a dominant negative.
BRCA1 also reduced the levels of protein nitration and H2O2-induced 8-oxoguanine lesions in DNA, two measures of oxidative damage to cellular macromolecules. The BRCA1-mediated reduction in protein nitrotyrosine levels was observed in both carcinoma and non-tumor cell lines. This reduction may be due to a BRCA1-mediated reduction in superoxide ion levels, since peroxynitrite, the reactive intermediate involved in protein nitration, is formed by the reaction of superoxide with nitric oxide [12]. Thus, BRCA1 may protect the integrity of cellular macromolecules. In this regard, we have shown that BRCA1 can stimulate a low grade endoplasmic reticulum stress response, a cytoprotective response to proteins damaged by oxidative and other causes [13].
Our findings are consistent with our previous study showing that BRCA1 can stimulate antioxidant gene expression and protect cells against oxidative stress [7]. They are also consistent with an in vivo study of suggesting that BRCA1-deficient mice are more prone to oxidant-induced lethality [14]. While the precise mechanism(s) by which BRCA1 reduces ROS levels is not yet clear, our findings suggest that loss of the endogenous BRCA1 protein, which is commonly observed in sporadic breast cancers [2], is sufficient to cause increased ROS levels in carcinoma cells, and thus might contribute to development of the breast cancer phenotype.
REF1 is a multi-functional protein that acts an apurinic/apyrimidinic endonuclease in the base excision pathway of DNA repair and a regulator of stress-induced transcription factors. Although the mechanisms are not entirely clear, REF1 expression is induced by oxidative stress; and REF1 protects cells against ROS-induced cell killing [15]. Here, we showed that REF1 knockdown increases ROS levels in a manner that is partly reversed by BRCA1 over-expression and vice versa. These findings suggest that with regard to regulation of ROS levels, BRCA1 and REF1 do not work in a simple series model with one down-stream of the other.
An interesting finding of this study is that cell transfection with plasmid expression vectors or siRNA can itself induce oxidative stress, a factor that needs to be taken into account in studies in which over- or under-expression models are utilized in studies of ROS production.
Supplementary Material
Subconfluent proliferating T47D cells were transfected overnight with the indicated vectors or vehicle only; allowed to recover in fresh medium for several hr; and treated with the indicated concentration of H2O2 for 24 hr. The cells were then assayed for carboxy-DCF fluorescence, as described in the Methods section. Values are means ± SEMs of the geometric mean fluorescence values from at least three independent experiments. Note: Each transfection utilized the same total quantity of plasmid DNA, with empty pcDNA3 vector used to make up the difference. **P < 0.05, *P < 0.002 using the paired two-tailed t-test. Comparisons were made to pcDNA3 vector in panels A-C and to wtBRCA1 vector in panels D-F.
T47D cells were subjected to the indicated treatments followed by confocal microscopic imaging. The carboxy-DCF green fluorescence was quantified as described in the Methods section. Values are means ± SEMs for at least three independent experiments. **P < 0.05, *P < 0.002.
Subconfluent proliferating T47D cells were treated with the indicated siRNA or vehicle only for 48 hr and then transfected as indicated overnight. The cells were then assayed for carboxy-DCF fluorescence by flow cytometry. Values are means ± SEMs of the geometric mean fluorescence values from at least three independent experiments. Comparisons were made to control-siRNA in panels A-C and to BRCA1-siRNA in panels D-F. **P < 0.05, *P < 0.002.
Assays were performed as described for Supplementary Fig. 2, except that REF1-siRNA was used instead of BRCA1-siRNA and wtBRCA1 was transfected instead of wt-REF1.
Subconfluent proliferating MCF-10A cells were transfected overnight with wtBRCA1, empty pcDNA3 vector, or vehicle only (A,B). Alternatively, the cells were treated with BRCA1-siRNA, control-siRNA, or vehicle only (C,D). They were then treated ± H2O2 (150 nM) for 24 hr and assayed for carboxy-DCF fluorescence by flow cytometry. Values are means ± SEMs of the geometric mean fluorescence values from three independent experiments. *P < 0.05 compared with pcDNA3 vector or control-siRNA.
Proliferating MCF-7 (A,B) or T47D (C,D) cells were transfected overnight with wtBRCA1, empty pcDNA3 vector, or vehicle only. The cells were sham-treated (A,C) or exposed to H2O2 (150 nM) for 24 hr and assayed for carboxy-DCF fluorescence by flow cytometry. Values are means ± SEMs of the geometric mean fluorescence values from three independent experiments. *P < 0.05 for comparison with empty pcDNA3 vector.
Cells were transfected as indicated; stained to detect ROS (carboxy-H2DCFDA), mitochondria (Mitotraker Red CMXRos), and nuclei (Hoechst 33342); and exposed to H2O2 (150 nM) for 24 hr prior to staining and imaging (see Methods section).
MCF-7 cells were transfected or treated with vehicle only as indicated; exposed to H2O2 (75 nM) for 24 hr; and stained to detect ROS (H2DCFDA), mitochondria (Mitotraker Red CMXRos), and nuclei (Hoechst 33342). Confocal microscopic images were obtained as described in the Methods section.
Assays were performed as described in Supplementary Fig. 6, except that a lower power image is shown.
Assays were performed as described above, except that the cells were exposed to TBHP (100 μM) for 24 hr prior to staining and imaging.
Acknowledgement
We thank Gil Palchik and Susette Mueller for assistance with the confocal microscopy and Michelle Lombard and Karen Creswell for assistance with the flow cytometry experiments. This research was supported, in part, by USPHS grants RO1-CA80000, RO1-CA104546, and R01-CA82599 and by a grant from the Susan G. Komen Breast Cancer Foundation (PDF0403044).
Footnotes
Publisher's Disclaimer: This is a PDF file of an unedited manuscript that has been accepted for publication. As a service to our customers we are providing this early version of the manuscript. The manuscript will undergo copyediting, typesetting, and review of the resulting proof before it is published in its final citable form. Please note that during the production process errors may be discovered which could affect the content, and all legal disclaimers that apply to the journal pertain.
REFERENCES
- 1.Miki Y, Swensen J, Shattuck-Eidens D, Futreal PA, Harshman K, Tavtigian S, Liu Q, Cochran C, Bennett LM, Ding W, et al. A strong candidate for the breast and ovarian cancer susceptibility gene BRCA1. Science. 1994;266:66–71. doi: 10.1126/science.7545954. [DOI] [PubMed] [Google Scholar]
- 2.Wilson CA, Ramos L, Villaseñor MR, Anders KH, Press MF, Clarke K, Karlan B, Chen JJ, Scully R, Livingston D, Zuch RH, Kanter MH, Cohen S, Calzone FJ, Slamon DJ. Localization of human BRCA1 and its loss in high-grade, non-inherited breast carcinomas. Nat Genet. 1999;21:236–240. doi: 10.1038/6029. [DOI] [PubMed] [Google Scholar]
- 3.Rosen EM, Fan S, Ma Y. BRCA1 regulation of transcription. Cancer Lett. 2006;236:175–185. doi: 10.1016/j.canlet.2005.04.037. Review. [DOI] [PubMed] [Google Scholar]
- 4.Ruffner H, Joazeiro CA, Hemmati D, Hunter T, Verma IM. Cancer-predisposing mutations within the RING domain of BRCA1: loss of ubiquitin protein ligase activity and protection from radiation hypersensitivity. Proc Natl Acad Sci U.S.A. 2001;98:5134–5139. doi: 10.1073/pnas.081068398. [DOI] [PMC free article] [PubMed] [Google Scholar]
- 5.McCord JM. Superoxide dismutase in aging and disease: an overview. Methods Enzymol. 2002;349:331–341. doi: 10.1016/s0076-6879(02)49348-2. [DOI] [PubMed] [Google Scholar]
- 6.Linnane AW, Kios M, Vitetta L. Healthy aging: regulation of the metabolome by cellular redox modulation and prooxidant signaling systems: the essential roles of superoxide anion and hydrogen peroxide. Biogerontology. 2007;8:445–467. doi: 10.1007/s10522-007-9096-4. [DOI] [PubMed] [Google Scholar]
- 7.Bae I, Fan S, Meng Q, Rih JK, Kim HJ, Kang HJ, Xu J, Goldberg ID, Jaiswal AK, Rosen EM. BRCA1 induces antioxidant gene expression and resistance to oxidative stress. Cancer Res. 2004;64:7893–7909. doi: 10.1158/0008-5472.CAN-04-1119. [DOI] [PubMed] [Google Scholar]
- 8.Fischer JL, Lancia JK, Mathur A, Smith ML. Selenium protection from DNA damage involves a Ref1/p53/Brca1 protein complex. Anticancer Res. 2006;26:899–904. [PubMed] [Google Scholar]
- 9.Robinson JP, Bruner LH, Bassoe CF, Hudson JL, Ward PA, Phan SH. Measurement of intracellular fluorescence of human monocytes relative to oxidative metabolism. J Leukoc Biol. 1988;43:304–310. doi: 10.1002/jlb.43.4.304. [DOI] [PubMed] [Google Scholar]
- 10.Fernando MR, Lechner JM, Lofgren S, Gladyshev VN, Lou MF. Mitochondrial thioltransferase (glutaredoxin 2) has GSH-dependent and thioredoxin reductase-dependent peroxidase activities in vitro and in lens epithelial cells. FASEB J. 2006;20:2645–2647. doi: 10.1096/fj.06-5919fje. [DOI] [PubMed] [Google Scholar]
- 11.Tait L, Soule HD, Russo J. Ultrastructural and immunocytochemical characterization of an immortalized human breast epithelial cell line, MCF-10. Cancer Res. 1990;50:6087–6094. [PubMed] [Google Scholar]
- 12.Peluffo G, Radi R. Biochemistry of protein tyrosine nitration in cardiovascular pathology. Cardiovasc Res. 2007;75:291–302. doi: 10.1016/j.cardiores.2007.04.024. Review. [DOI] [PubMed] [Google Scholar]
- 13.Fan S, Meng Q, Auborn K, Carter T, Rosen EM. BRCA1 and BRCA2 as molecular targets for phytochemicals indole-3-carbinol and genistein in breast and prostate cancer cells. Br J Cancer. 2006;94:407–426. doi: 10.1038/sj.bjc.6602935. [DOI] [PMC free article] [PubMed] [Google Scholar]
- 14.Cao L, Xu X, Cao LL, Wang RH, Coumoul X, Kim SS, Deng CX. Absence of full-length Brca1 sensitizes mice to oxidative stress and carcinogen-induced tumorigenesis in the esophagus and forestomach. Carcinogenesis. 2007;28:1401–1407. doi: 10.1093/carcin/bgm060. [DOI] [PubMed] [Google Scholar]
- 15.Fritz G, Grösch S, Tomicic M, Kaina B. APE/Ref-1 and the mammalian response to genotoxic stress. Toxicology. 2003;193:67–78. doi: 10.1016/s0300-483x(03)00290-7. Review. [DOI] [PubMed] [Google Scholar]
Associated Data
This section collects any data citations, data availability statements, or supplementary materials included in this article.
Supplementary Materials
Subconfluent proliferating T47D cells were transfected overnight with the indicated vectors or vehicle only; allowed to recover in fresh medium for several hr; and treated with the indicated concentration of H2O2 for 24 hr. The cells were then assayed for carboxy-DCF fluorescence, as described in the Methods section. Values are means ± SEMs of the geometric mean fluorescence values from at least three independent experiments. Note: Each transfection utilized the same total quantity of plasmid DNA, with empty pcDNA3 vector used to make up the difference. **P < 0.05, *P < 0.002 using the paired two-tailed t-test. Comparisons were made to pcDNA3 vector in panels A-C and to wtBRCA1 vector in panels D-F.
T47D cells were subjected to the indicated treatments followed by confocal microscopic imaging. The carboxy-DCF green fluorescence was quantified as described in the Methods section. Values are means ± SEMs for at least three independent experiments. **P < 0.05, *P < 0.002.
Subconfluent proliferating T47D cells were treated with the indicated siRNA or vehicle only for 48 hr and then transfected as indicated overnight. The cells were then assayed for carboxy-DCF fluorescence by flow cytometry. Values are means ± SEMs of the geometric mean fluorescence values from at least three independent experiments. Comparisons were made to control-siRNA in panels A-C and to BRCA1-siRNA in panels D-F. **P < 0.05, *P < 0.002.
Assays were performed as described for Supplementary Fig. 2, except that REF1-siRNA was used instead of BRCA1-siRNA and wtBRCA1 was transfected instead of wt-REF1.
Subconfluent proliferating MCF-10A cells were transfected overnight with wtBRCA1, empty pcDNA3 vector, or vehicle only (A,B). Alternatively, the cells were treated with BRCA1-siRNA, control-siRNA, or vehicle only (C,D). They were then treated ± H2O2 (150 nM) for 24 hr and assayed for carboxy-DCF fluorescence by flow cytometry. Values are means ± SEMs of the geometric mean fluorescence values from three independent experiments. *P < 0.05 compared with pcDNA3 vector or control-siRNA.
Proliferating MCF-7 (A,B) or T47D (C,D) cells were transfected overnight with wtBRCA1, empty pcDNA3 vector, or vehicle only. The cells were sham-treated (A,C) or exposed to H2O2 (150 nM) for 24 hr and assayed for carboxy-DCF fluorescence by flow cytometry. Values are means ± SEMs of the geometric mean fluorescence values from three independent experiments. *P < 0.05 for comparison with empty pcDNA3 vector.
Cells were transfected as indicated; stained to detect ROS (carboxy-H2DCFDA), mitochondria (Mitotraker Red CMXRos), and nuclei (Hoechst 33342); and exposed to H2O2 (150 nM) for 24 hr prior to staining and imaging (see Methods section).
MCF-7 cells were transfected or treated with vehicle only as indicated; exposed to H2O2 (75 nM) for 24 hr; and stained to detect ROS (H2DCFDA), mitochondria (Mitotraker Red CMXRos), and nuclei (Hoechst 33342). Confocal microscopic images were obtained as described in the Methods section.
Assays were performed as described in Supplementary Fig. 6, except that a lower power image is shown.
Assays were performed as described above, except that the cells were exposed to TBHP (100 μM) for 24 hr prior to staining and imaging.