

Abstract
OBJECTIVES
After replication of previous findings we aimed to: 1) determine if previously reported 1H MRSI differences between ALS patients and control subjects are limited to the motor cortex; and 2) determine the longitudinal metabolic changes corresponding to varying levels of diagnostic certainty.
METHODS
Twenty-one patients with possible/suspected ALS, 24 patients with probable/definite ALS and 17 control subjects underwent multislice 1H MRSI co-registered with tissue-segmented MRI to obtain concentrations of the brain metabolites N-acetylaspartate (NAA), creatine, and choline in the left and right motor cortex and in gray matter and white matter of non-motor regions in the brain.
RESULTS
In the more affected hemisphere, reductions in the ratios, NAA/Cho and NAA/Cre+Cho were observed both within (12.6% and 9.5% respectively) and outside (9.2% and 7.3% respectively) the motor cortex in probable/definite ALS. However, these reductions were significantly greater within the motor cortex (P<0.05 for NAA/Cho and P<0.005 for NAA/Cre+Cho). Longitudinal changes in NAA were observed at three months within the motor cortex of both possible/suspected ALS patients (P<0.005) and at nine months outside the motor cortex of probable/definite patients (P<0.005). However, there was no clear pattern of progressive change over time.
CONCLUSIONS
NAA ratios are reduced in the motor cortex and outside the motor cortex in ALS, suggesting widespread neuronal injury. Longitudinal changes of NAA are not reliable, suggesting that NAA may not be a useful surrogate marker for treatment trials. (ALS 2004; 5: 141–149)
Keywords: amyotrophic lateral sclerosis, magnetic resonance spectroscopic imaging, magnetic resonance imaging
Introduction
Amyotrophic lateral sclerosis (ALS) is a neurodegenerative disorder that results in the loss of motor neurons both in the brain and spinal cord leading to paralysis and ultimately death. There is no definitive test for ALS and diagnoses are currently made based on clinical data. The development of a surrogate marker for disease progression would be useful for identifying individuals suffering from the early stages of ALS and for monitoring treatment effects.
The putative neuronal marker, N-acetylaspartate (NAA) is present in high concentrations within the neuronal cell bodies and axons, but almost completely absent from non-neuronal tissue.1 For this reason NAA is considered a marker of neuronal density. In ALS,2 as well as epilepsy,3 changes in NAA concentration have been found to be reversible, suggesting that NAA may also reflect neuronal function and metabolism. NAA may therefore be an effective marker for UMN involvement and degeneration in ALS, evidenced by several studies showing NAA reductions in motor regions.5–12 In addition to NAA, measurements of the concentration of creatine- and phosphocreatine- containing compounds (Cre), which are putative markers of gliosis,12,13 and the concentration of choline containing compounds (Cho), which are thought to be markers of membrane integrity,12,13 were obtained. Because most previous MRS studies of ALS examined regions of interest that were sufficiently distant from the skull to avoid interference from lipids, sampling of motor cortex was often limited.5,9–11,14–22 Using a Multi-planar 1H MRSI technique to sample a larger region that includes the brain surface, reductions of the ratio NAA/Cre+Cho have been observed in the region of the motor cortex and corticospinal tract.7 A quantitative analysis of these data showed that decreased NAA was responsible for the ratio changes in the motor cortex and increased Cho for ratio changes in the corticospinal tract.4,6
Reductions in both NAA9–11 and NAA ratios4–8 have been reported in the motor cortex of individuals with ALS. We have previously reported reduced NAA ratios in probable/definite ALS patients compared with age-matched controls that resulted from both a decrease in NAA and increases in Cre and Cho.8 Furthermore, these metabolites decreased longitudinally, suggesting that MRS measurements could be used to monitor progression of ALS.8
The goals of the current study were to replicate our earlier findings that the ratios NAA/Cre, NAA/Cho and NAA/Cre+Cho are reduced in probable/definite subjects compared with controls, and that NAA, Cre, and Cho decrease over time in ALS. We extended these previous findings with a larger group of subjects, also studying frontal and parietal regions outside the motor cortex. Specifically, we tested the following a priori hypotheses: first, that our previous cross-sectional and longitudinal findings would be replicated; secondly, cross-sectional differences between ALS patients and control subjects would be greater within the motor cortex than differences occurring in other regions; and thirdly, longitudinal changes would occur in both possible and suspected ALS and probable and definite ALS.
Methods
Subjects
This study was approved by the committee on Human Research at the University of California, San Francisco and all subjects provided written informed consent prior to MRI and MRS examination. For the replication of our previous findings, cross-sectional data were collected from 4 possible/suspected (age 50±12 years) and 15 probable/definite (52±12 years), as defined by the World Federation of Neurology El Escorial diagnostic criteria,23 and 14 control subjects (age 42±11 years). Of the 19 ALS patients, 13 were tracked longitudinally (4 possible/suspected and 9 probable/definite) and used for the longitudinal replication analysis. Longitudinal subjects were restudied every three months after the initial scan.
After replication analysis was completed, the subjects we previously reported8 were combined with the later subjects and further analysis was performed on this combined group. To more evenly balance the age of the subject groups, controls younger than 40 years of age were dropped from further analysis. The resulting group for cross-sectional analysis consisted of 21 possible/suspected subjects (age 56±10 years), 24 probable/definite subjects (age 54±12 years) and 17 control subjects (age 51±10 years). Of these subjects, 13 possible/suspected and 15 probable/definite patients received repeated scans (every 3 months for up to 12 months) and were studied longitudinally.
MRI and MRSI acquisition
Acquisition and processing of MR data were identical to our previous report.8 Briefly, proton density and T2-weighted MR images were acquired using a turbo spin echo sequence, (TE 14/85 msec; TR 7000 msec; 3 mm slice thickness; 1.0 × 1.0 mm2 in plane resolution; AT 4 min) covering the entire brain and oriented along the AC-PC line. Volumetric T1-weighted gradient echo MRI (MPRAGE) of the entire brain was acquired, (TE=4 ms; TR 10 ms; 15° flip angle; 1.0 × 1.0 mm2 in plane resolution; AT 7 min) angulated perpendicular to AC-PC line, with 1.5 mm effective slice thickness. Together, proton density and T2 and T1 weighted MR images were used for tissue segmentation.
Multislice 1H MRSI data, using a spin echo sequence, were acquired from three axially oblique multislice planes with 15 mm thickness positioned as shown in Figure 1. One slice was at the level of the internal capsule, and two slices supraventricular with coverage through the motor cortical regions and centrum semiovale. In order to perform longitudinal studies on the exactly same brain regions, positions of the 1H MRSI slices were determined in each subject relative to an imaginary line that connects the anterior and posterior commissures (AC-PC), as seen on high-resolution scout MRI scans. In the initial study, the distance between each slice and the AC-PC line was measured and recorded, and in subsequent studies the 1H MRSI slices were placed in the exactly same positions relative to the AC-PC line.
Figure 1.

(A) Position of 1H MRS multislice volumes of interest. Examples of the (B) top; (C) middle; and bottom slice (D). On the top and middle slice white arrows indicate the motor region, non-motor frontal areas are colored red and parietal regions are colored blue. Motor cortex marking did not extend to the lower slice on this subject.
1H MRSI parameters were: TR/TE=1800/70 ms, 36 phase-encoding steps in each direction with circular sampling, 260 × 260 mm2 field-of-view providing 7.5 × 7.5 mm2 nominal in plane resolution; (AT=30 min). A slice selective inversion pulse was applied 165 msec prior to the first excitation to provide inversion-recovery nulling of lipid resonances. CHESS 24 water suppression was accomplished using three frequency selective RF pulses.
MRI and MRSI processing
MRI segmentation into the primary tissue categories of gray matter, white matter, and CSF was performed by an automated procedure, as described above with minor modifications.25 In addition, an experienced operator marked the left and right motor region on MRI, as well as hemispheric, rolandic, and sylvian fissures, yielding left and right motor regions and frontal/parietal regions. The motor cortex was defined as the first gyrus anterior of the central sulcus. All voxels anterior to the motor region were identified as frontal while all voxels posterior to the motor region were identified as parietal (Figure 1). Together the frontal and parietal brain regions, outside the motor region, are termed ‘non-motor regions’. Voxels from the bottom slice were included only if motor cortex extended to the level of the bottom slice. This bottom slice was included in 6 of the 17 control subjects, 10 of the 21 possible/suspected subjects and 12 of the 24 probable/definite subjects. Of the subjects used in longitudinal analyses, 7 of the 13 possible/suspected patients and 5 of the 15 probable/definite subjects included data from the bottom slice. The temporal lobe was not categorized, because the 1H MRSI slices did not cover this region.
Processing of the 1H MRSI data has been described previously26 and included k-space zerofilling to 642 points, Fourier reconstruction, selective k-space extrapolation,27 and fully automated spectral fitting of the peak areas of NAA, Cre, and Cho, based on a parametric model spectrum and a non-parametric baseline model.28 Quality control was assured by rejecting spectra with less than 4 Hz or greater than 12 Hz line width at half peak height or with variations of the peak location of more than ±0.05 ppm. This resulted in approximately 4% of spectra being rejected. No patients were excluded from any of the analyses. Finally, the peak areas were corrected for receiver gain and expressed relative to the intensity of median ventricular CSF of each subject, as measured from proton density MRI. All metabolite concentrations are expressed in arbitrary units.
MRI and MRSI co-analysis
To calculate absolute values, metabolite values were corrected for coil loading, receiver gain, sensitivity profile of the coil, chemical shift displacements and normalized to the CSF intensity in the MRI to account for scanner instabilities. The composition of MRSI voxels in terms of gray and white matter, left and right motor cortex, and ventricular and sulcal CSF was estimated from aligned segmented MRIs, assuming no head movement between MRSI and MRI acquisition. These metabolite values were then corrected for the amount of tissue contained within the voxel. For ratio data, the metabolite values calculated from the curve program were used.
Statistics
It is possible that disease related atrophy resulted in different proportions of gray to white matter in patients compared with controls. To assess this, two tailed t-tests were conducted to compare the mean ratio of the volume of gray matter to total voxel tissue volume (gray matter+white matter) of ALS and control subjects.
Cross-sectional data were compared using a linear mixed model for each metabolite in each hemisphere with brain region (frontal, motor, or parietal) as a repeated factor, and group (control, possible/suspected, probable/definite) as a between-subjects factor. Cross-sectional differences were assessed by comparing control subjects to ALS patients at the time of their first scan. Control subject data were averaged across hemispheres and separate models were created for analyzing data from the more and less affected hemispheres. Age was a covariate in these analyses. Longitudinal changes within ALS patients were assessed using a mixed linear model with region, affected hemisphere and months from initial scan as repeated measures. The repeated measure was evaluated as a categorical variable to assess pairwise comparisons of individual time points to the initial scan baseline. The number of months from the initial scan was treated as a categorical variable to compare the initial metabolite values with those observed at any given later time point (e.g. 3 months or 6 months).
Results
Replication of our previous findings
We previously found motor cortex metabolic differences between control subjects and patients with probable or definite ALS.8 These patients had decreased NAA/Cre, NAA/Cho and NAA/(Cre+Cho) ratios compared with control subjects in both the more and less affected hemispheres. Analysis of the data from new subjects replicates the cross-sectional finding of Suhy et al, except for the ratio of NAA/(Cre+Cho) in the less affected hemisphere where there was a non-significant decrease (P=0.12). Similar to our previous report, NAA ratio changes were due to both decreased NAA and increased Cre and Cho (Table 1). Our previous report of significant longitudinal (3 month) decreases in motor cortex NAA, Cre, and Cho was not replicated, but the number of subjects followed longitudinally in the replication sample was less than in our first report. Therefore, for the remainder of the analyses described below we combined data from both sets of subjects and eliminated the youngest control subjects to maintain age balance. This larger group allowed us to analyze longitudinal changes within different ALS diagnoses.
Table 1.
Comparison of ALS patients and control subject ratio and absolute metabolites. ALS patient values are averaged over left and right hemisphere.
| Most affected hemisphere |
||||||
|---|---|---|---|---|---|---|
| Control |
Possible/suspected |
Probable/definite |
||||
| Motor | Other | Motor | Other | Motor | Other | |
| NAA/Cre | 2.16±0.16 | 2.08±0.14 | 2.02±0.20 (−6.7%) | 2.02±0.13 (−2.9%) | 2.02±0.25 (−7.3%) | 1.96±0.17 (−5.8%) |
| NAA/Cho | 3.60±0.39 | 3.08±0.36 | 3.39±0.44 (−5.7%) | 2.98±0.35 (−3.0%) | 3.14±1.46 (−12.6%)† | 2.79±0.32 (−9.2%)* |
| NAA/(Cre+Cho) | 1.34±0.10 | 1.22±0.09 | 1.25±0.12 (−6.4%) | 1.18±0.08 (−3.0%) | 1.21±0.14 (−9.5%)* | 1.13±0.10 (−7.3%)* |
| NAA | 17.06±1.64 | 13.95±1.85 | 17.15±1.70 (0.6%) | 13.82±2.85 (−1.0%) | 16.34±2.50 (−4.2%) | 13.31±1.98 (−4.6%) |
| Creatine | 7.45±0.92 | 7.07±1.58 | 7.96±1.08 (6.8%) | 7.36±2.01 (4.1%) | 7.80±1.21 (4.7%) | 7.15±1.55 (1.0%) |
| Choline | 4.34±0.78 | 5.17±1.29 | 4.71±0.75 (8.4%) | 5.44±1.60 (5.2%) | 4.86±0.83 (11.9%) | 5.44±1.55 (5.1%) |
|
Least affected hemisphere |
||||||
|
Control |
Possible/suspected |
Probable/definite |
||||
| Motor | Other | Motor | Other | Motor | Other | |
| NAA/Cre | 2.16±0.16 | 2.08±0.14 | 2.07±0.24 (−4.2%) | 2.02±0.12 (−2.5%) | 1.92±0.20 (−11.6%)‡ | 1.94±0.17 (−6.4%)* |
| NAA/Cho | 3.60±0.39 | 3.08±0.36 | 3.39±0.54 (−3.4%) | 2.98±0.39 (−3.0%) | 3.14±0.43 (−10.8%) * | 2.79±0.32 (−10.3%)* |
| NAA/(Cre+Cho) | 1.34±0.10 | 1.22±0.09 | 1.25±0.12 (−4.2%) | 1.18±0.08 (−2.9%) | 1.21±0.14 (−11.5%)‡ | 1.13±0.10 (−8.1%)* |
| NAA | 17.06±1.64 | 13.95±1.85 | 16.10±2.03 (−5.6%) | 13.47±2.83 (−3.5%) | 15.82±2.20 (−7.2%) | 13.33±2.46 (−4.5%) |
| Creatine | 7.45±0.92 | 7.07±1.58 | 7.47±0.98 (0.3%) | 7.07±1.60 (−0.1%) | 7.77±1.19 (4.3%) | 7.18±1.63 (1.5%) |
| Choline | 4.34±0.78 | 5.17±1.29 | 4.35±0.93 (0.3%) | 5.17±1.63 (−0.1%) | 4.63±0.80 (6.7%) | 5.42±1.33 (4.7%) |
Comparisons were analyzed using single df comparisons within a mixed linear model *P<0.05,
P<0.005,
P<0.0005.
Scores are hemispheric means±standard deviations. Values in parentheses are percentage difference from control subject mean. Absolute metabolite values are in arbitrary units
Cross-sectional differences in motor and non-motor cortex between ALS patients and control subjects (all subjects combined)
Tissue correction procedures adjusted metabolite concentration to account for the volume of CSF in the voxels. The gray matter fraction of the motor region in controls (0.42±0.05) was not significantly different from that of either the possible/suspected (0.41±0.09 in the more affected hemisphere and 0.39±0.08 in the less affected hemisphere) or the probable/definite subjects (0.41±0.09 in the more affected hemisphere and 0.42±0.10 in the less affected hemisphere). Outside the motor region the proportion of gray matter in control subjects (0.52±0.05) was also not different from that of either the possible/suspected (0.51±0.08 in the more affected hemisphere and 0.50±0.08 in the less affected hemisphere) or probable/definite subjects (0.51±0.06 in the more affected hemisphere and 0.50±0.07 in the less affected hemisphere). There were no significant differences between ALS patients and control subjects in the proportion of gray matter either within or outside the motor region. There was, however, a non-significant trend of reduced gray matter in ALS that was consistent with atrophy reported by Ellis et al.29 Gray matter fraction was used as a covariate in cross-sectional analyses to ensure that observed effects were not influenced by tissue loss in ALS.
Table 1 shows significant reductions of NAA ratio measures in the motor cortex of probable/definite ALS patients compared with control subjects. Within the motor cortex, the reduction of NAA/Cre+Cho was significant in both hemispheres (P<0.05 in the more and P<0.0005 in the less affected hemisphere), the reduction of NAA/Cre was significant only in the less affected hemisphere (P<0.0005), and the reduction of NAA/Cho was significant only in both hemispheres (P<0.005 in the more and P<0.05 in the less affected hemisphere). No significant differences were observed in the motor cortex of possible/suspected subjects.
Outside the motor cortex, similar reductions were seen in the probable/definite subjects. In the non-motor cortex of probable/definite patients no reductions of NAA/Cre were present in the less affected hemisphere (P<0.05), while reductions of both NAA/(Cre+Cho) and NAA/Cho were observed in both hemispheres (P<0.05). As with the motor cortex, all the ratio measures that were not significantly reduced exhibited non-significant trends and no significant change was observed in the possible/suspected group. For ratio measures where probable/definite patients showed reductions in both motor and non-motor regions relative to controls, interaction contrasts within the linear mixed effects (LME) model were used to determine if the changes within the motor cortex were of significantly greater magnitude than outside the motor cortex. This was true for two of the measures in the less affected hemisphere. NAA/Cre in the less affected hemisphere was reduced by 11.6% in motor regions and 6.4% outside the motor region (P<0.05). NAA/(Cre+Cho) in the less affected hemisphere was reduced by 11.5% in the motor cortex and 8.1% outside the motor region. Again the motor cortex change was significantly greater than that observed outside the motor cortex (P<0.05). Changes in the motor region were not significantly greater in the more affected hemisphere.
Cross-sectional comparisons of the absolute metabolite levels of ALS subjects showed no significant differences from controls. However, there were trends toward reduced NAA and increased Cre and Cho in probable/definite patients that were consistent with the ratio findings (Table 1).
Longitudinal changes in the motor cortex of ALS patients
The NAA ratios (NAA/Cre, NAA/Cho and NAA/(Cre+Cho)) did not show any significant longitudinal change.
When comparing initial scan to three-month data, a decrease in NAA concentration was observed both within (P<0.005) and outside (P<0.05) the motor cortex. These changes in NAA were observed at three months but not beyond. Additionally, these NAA changes were observed in the more affected hemisphere only.
Similar to NAA, there were significant decreases of Cre (P=0.05) and Cho (P<0.05) in the motor cortex of the more affected hemisphere. Outside the motor cortex, the pattern of creatine and choline change was different from that of NAA. In frontal and parietal non-motor regions, no changes were observed for Cre at three months, but decreases were observed for Cre at nine months (P<0.05) in the more affected hemisphere. Cho was decreased at all time points in the more affected hemisphere (P=0.05) when compared to the initial scan baseline. Additionally, unlike NAA and Cre, longitudinal decreases in Cho were also observed in the less affected hemisphere. Cho was decreased in the less affected hemisphere at both the six (P<0.05) and nine month (P<0.005) time points.
When ALS patients were stratified by diagnosis at study entry (possible/suspected vs. probable/definite), the pattern of longitudinal change in the two groups differed.
In the possible/suspected ALS subjects, significant NAA (P≤0.005) and Cho (P<0.05) decreases were observed at three months in the motor cortex of the more affected hemisphere (Figure 2), while three month Cre changes were not significant. Outside the motor cortex in the more affected hemisphere, the pattern of change in the possible/suspected patients was different from within the motor cortex. No significant change was observed with NAA or Cre. However, Cho was decreased at three months (P<0.05) and this decrease was also present at 6 (P<0.05) and 12 months (P<0.05) (Figure 2c).
Figure 2.
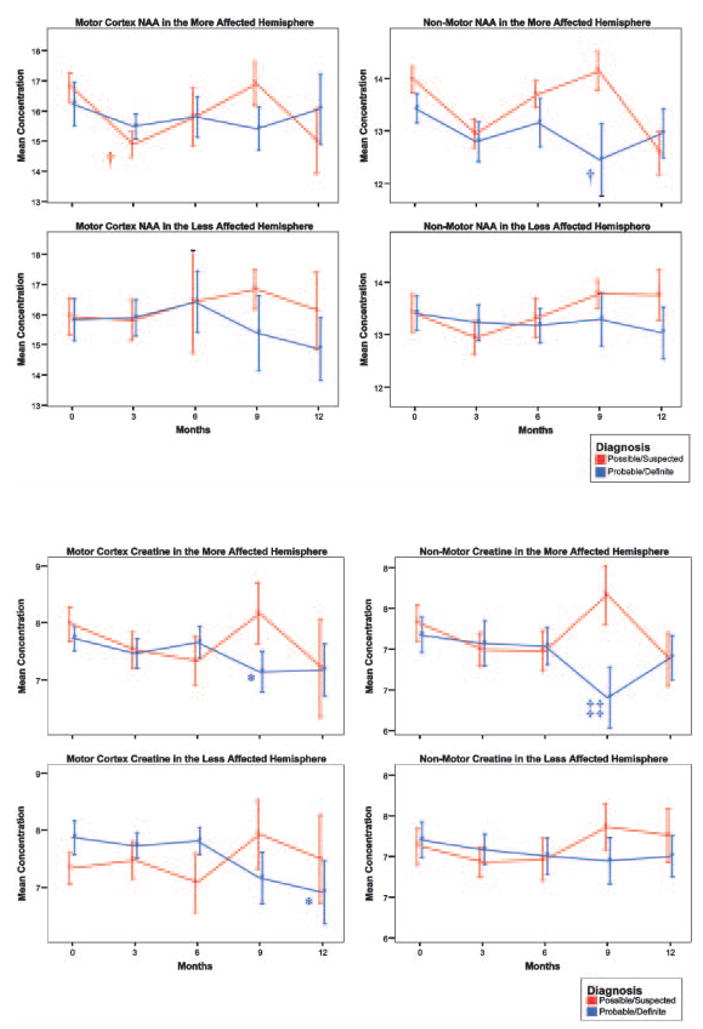

Mean concentrations of (a) NAA (b) creatine and (c) choline at 3-month intervals. Significant values are relative to mean concentrations at the time of the initial scan. Comparisons were made using single df comparisons within a mixed linear model with months from initial scan as a repeated measure (* P≤0.05, ◆P≤0.01, †P≤0.005, ‡P≤0.0005, ‡‡P≤0.0001). Error bars represent standard error of the mean.
The group initially diagnosed as probable/definite did not show any change at three months. However the probable/definite subjects, unlike the possible/suspected subjects, displayed significant longitudinal changes at the later 9- and 12-month time points. NAA change in the probable/definite subjects was limited to the 9-month time point, was only observed outside the motor cortex and only in the more affected hemisphere (P≤0.005). Like NAA, both Cre and Cho were also significantly decreased outside the motor cortex in the probable/definite patients at 9 months in the more affected hemisphere (Cre: P<0.0001, Cho: P<0.01). Unlike NAA, Cre was also significantly reduced at 9 months within the motor cortex in the more affected hemisphere (P<0.05) and at 12 months in the less affected hemisphere (P<0.05). Cho was additionally decreased within the motor cortex at 12 months in the less affected hemisphere (P<0.05).
Discussion
The major findings of this study were as follows: 1. The cross-sectional, but not the longitudinal findings, of Suhy et al8 were replicated. 2. Reduced NAA ratios were observed both inside and outside primary motor areas, but the motor area reductions were of greater magnitude. These results suggest that widespread metabolic changes occur throughout the brain in ALS.3 Longitudinal changes were observed during the first 3 months of observation in possible/suspected ALS patients and changes were observed in probable/definite patients over longer time periods. However, the inconsistent pattern of longitudinal changes observed in this study does not support use of 1H MRSI as a surrogate marker for ALS treatment effects.
Cross sectional changes in and outside the motor areas
The previously reported cross-sectional findings of reduced NAA ratios (NAA/Cre, NAA/Cho and NAA/(Cre+Cho)) in the motor region of patients diagnosed with probable or definite ALS were replicated in the later cohort of subjects. Cross-sectional differences between control subjects and probable/definite subjects were observed both inside the motor region with all three NAA ratio measures (NAA/Cre, NAA/Cho and NAA/Cre+Cho). Additionally the ratios of NAA/Cre and NAA/Cre+Cho were significantly reduced outside the motor region. Most previous MRS research in ALS has focused on changes of the motor neurons. Our findings, however, suggest that metabolic changes are widespread, occurring both within and outside the primary motor areas. In ALS cognitive impairment, primarily when the domain of frontal functioning is present, 30 atrophy occurs outside the motor cortex,29 and decreased NAA/Creratios have been observed in the cingulated.31 While metabolic changes are not limited to the motor region, analyses of interaction contrasts revealed that the differences observed inside the motor region were significantly greater than those outside the motor regions, so changes in this region are the most striking. Therefore, focusing on changes in the motor region may be useful, especially at an early stage of the disease.
Longitudinal studies
The longitudinal portion of the study revealed a decline of NAA and Cho within the motor cortex of possible/suspected patients at 3 months. This decline represents processes occurring early in the disease process. However, our failure to detect these changes at later time points limits the value of this finding. An examination of progressive change in the more affected motor cortex of each individual subject with possible/suspected, reveals that during the first three months NAA either decreases or remains stable in all of these subjects. However, subsequent scans revealed a majority of these same individual subjects had NAA concentrations that exceeded the levels observed at zero and three months (Figure 3). The reason for the reversal of the 3 month decrements when these patients are later tested is currently unexplained. Subjects were enrolled at various disease stages, and the period of time from the onset of symptoms to the time of the initial scan within this group of possible/suspected ALS subjects, ranged from 0.6 to 3.4 years (mean: 1.5±1.0 years). Because of this large variation in the period of time these subjects exhibited symptoms, it is unlikely that the NAA reversal resulted from normal disease progression. Additionally, the initial scanning of these subjects occurred over a period of four years, making it unlikely that the observed NAA reversal resulted from systematic errors due to unstable MRI equipment. Outside the motor cortex these possible/suspected patients exhibited an initial 3 month decline of Cho that remained depressed at later time points, indicating that Cho might be a more reliable or sensitive marker of disease progression. While further research needs to be conducted to clarify these findings, it does not appear that multi-slice MRSI is sensitive to short-term changes in ALS. Declining levels of NAA, Cre and Cho were observed at later time points in the more severely affected probable/definite ALS patient group. With all three metabolites, this late effect was largest and most significant outside the motor cortex at 9 months.
Figure 3.

NAA concentrations in each of the 12 possible/suspected ALS patients tracked longitudinally. Each colored line represents an individual subject. During the first three months NAA either decreases or remains stable in all of these subjects. Subsequent to the 3-month time point, this tendency is no longer present.
No longitudinal changes were observed when using the NAA ratio measures. The reason for this seems to be that all three metabolites, NAA, Cre, and Cho, tend to decrease and increase together.
Further research including data over a longer span of time is necessary to determine if these changes are persistent. The utility of a test that shows greater changes outside the motor cortex, the primary region of interest, is questionable. There is, as already mentioned, neuroimaging29,32,33 and neuro-psychological34 evidence suggesting ALS pathology outside the motor cortex. The lack of change within the motor cortex of patients with more severe diagnosis of probable/definite ALS could reflect a floor effect of NAA change within this region. The changes observed outside the motor cortex in the probable/definite ALS, but not the less severely affected possible/suspected ALS patient, group might indicate that the disease process has progressed beyond motor areas in the probable/definite subjects. Our longitudinal findings differ considerably from the longitudinal, ALS MR spectroscopy report of Block et al showing longitudinal decreases of motor cortex NAA/Cho.9 Our study differed from Block et al in that we report a different population and used MRSI as opposed to single voxel PRESS. Additionally, Block et al report no statistical analysis or the magnitude of decrease they observed, complicating a comparison. In both our previous report8 and this report, we found no longitudinal changes of metabolite ratios because NAA, Cre, and Cho all changed in the same direction. Therefore, based on our inability to detect robust longitudinal changes of metabolites in ALS, our results do not support the use of MRS measurements of NAA or other metabolites as a surrogate marker of progression in ALS for treatment trials.
Conclusions
These results demonstrate widespread metabolic changes throughout the brain in ALS. Although these changes are greatest within motor regions, they are also present outside this region. While these results suggest that MRSI may be useful in the diagnosis of ALS, they do not support longitudinal measurements of metabolites as a surrogate marker to detect treatment effects.
Acknowledgments
This research was supported by the ALS Association (M.W.W.), Rhone Poulenc Rhorer (RIL007/US/GIA; M.W.W.), NIH RO1 grant 1H MRSI of Amyotrophic Lateral Sclerosis’ (NS4032). The authors would like to acknowledge the assistance of Linda Rogers with the statistical design and analysis.
References
- 1.Moffett JR, Namboodiri MA, Cangro CB, Neale JH. Immunohistochemical localization of N-acetylaspartate in rat brain. Neuroreport. 1991;2:131–134. doi: 10.1097/00001756-199103000-00005. [DOI] [PubMed] [Google Scholar]
- 2.Kalra S, Cashman NR, Genge A, Arnold DL. Recovery of N-acetylaspartate in corticomotor neurons of patients with ALS after riluzole therapy. Neuroreport. 1998;9:1757–1761. doi: 10.1097/00001756-199806010-00016. [DOI] [PubMed] [Google Scholar]
- 3.De Stefano N, Matthews PM, Arnold DL. Reversible decreases in N-acetylaspartate after acute brain injury. Magn Reson Med. 1995;34:721–727. doi: 10.1002/mrm.1910340511. [DOI] [PubMed] [Google Scholar]
- 4.Rooney WD, Miller RG, Gelinas D, Schuff N, Maudsley AA, Weiner MW. Decreased N-acetylaspartate in motor cortex and corticospinal tract in ALS. Neurology. 1998;50:1800–1805. doi: 10.1212/wnl.50.6.1800. [DOI] [PubMed] [Google Scholar]
- 5.Ellis CM, Simmons A, Andrews C, Dawson JM, Williams SC, Leigh PN. A proton magnetic resonance spectroscopic study in ALS: correlation with clinical findings. Neurology. 1998;51:1104–1109. doi: 10.1212/wnl.51.4.1104. [DOI] [PubMed] [Google Scholar]
- 6.Schuff N, Rooney WD, Miller RG, et al. Reanalysis of multislice 1H MRSI in amyotrophic lateral sclerosis. Magnetic Resonance in Medicine. 2001;45:513–516. doi: 10.1002/1522-2594(200103)45:3<513::aid-mrm1067>3.0.co;2-d. [DOI] [PubMed] [Google Scholar]
- 7.Kalra S, Arnold DL, Cashman NR. Biological markers in the diagnosis and treatment of ALS. J Neurol Sci. 1999;165 (suppl 1):S27–S32. doi: 10.1016/s0022-510x(99)00023-4. [DOI] [PubMed] [Google Scholar]
- 8.Suhy J, Miller RG, Rule R, et al. Early detection and longitudinal changes in amyotrophic lateral sclerosis by 1H MRSI. Neurology. 2002;58:773–779. doi: 10.1212/wnl.58.5.773. [DOI] [PMC free article] [PubMed] [Google Scholar]
- 9.Block W, Karitzky J, Treaber F, et al. Proton magnetic resonance spectroscopy of the primary motor cortex in patients with motor neurone disease: subgroup analysis and follow-up measurements [see comments] Arch Neurol. 1998;55:931–936. doi: 10.1001/archneur.55.7.931. [DOI] [PubMed] [Google Scholar]
- 10.Bradley WG, Bowen BC, Pattany PM, Rotta F. 1H-magnetic resonance spectroscopy in amyotrophic lateral sclerosis. J Neurol Sci. 1999;169:84–86. doi: 10.1016/s0022-510x(99)00221-x. [DOI] [PubMed] [Google Scholar]
- 11.Gredal O, Rosenbaum S, Topp S, Karlsborg M, Strange P, Werdelin L. Quantification of brain metabolites in amyotrophic lateral sclerosis by localized proton magnetic resonance spectroscopy [see comments] Brain. 1997;48:878–881. doi: 10.1212/wnl.48.4.878. [DOI] [PubMed] [Google Scholar]
- 12.Chang L, Ernst T, Osborn D, Seltzer W, Leonido-Yee M, Poland RE. Proton spectroscopy in myotonic dystrophy: correlations with CTG repeats [see comments] ArchNeurol. 1998;55:305–311. doi: 10.1001/archneur.55.3.305. [DOI] [PubMed] [Google Scholar]
- 13.Urenjak J, Williams SR, Gadian DG, Noble M. Proton nuclear magnetic resonance spectroscopy unambiguously identifies different neural cell types. J Neurosci. 1993;13:981–989. doi: 10.1523/JNEUROSCI.13-03-00981.1993. [DOI] [PMC free article] [PubMed] [Google Scholar]
- 14.Pioro EP, Antel JP, Cashman NR, Arnold DL. Detection of cortical neuron loss in motor neurone disease by proton magnetic resonance spectroscopic imaging in vivo. Neurology. 1994;44:1933–1938. doi: 10.1212/wnl.44.10.1933. [DOI] [PubMed] [Google Scholar]
- 15.Jones AP, Gunawardena WJ, Coutinho CM, Gatt JA, Shaw IC, Mitchell JD. Preliminary results of proton magnetic resonance spectroscopy in motor neurone disease (amytrophic lateral sclerosis) J Neurol Sci. 1995;129 (suppl):85–89. doi: 10.1016/0022-510x(95)00072-a. [DOI] [PubMed] [Google Scholar]
- 16.Giroud M, Walker P, Bernard D, et al. Reduced brain N-acetylaspartate in frontal lobes suggests neuronal loss in patients with amyotrophic lateral sclerosis [published erratum appears in Neurol Res 1997; 19: 456] Neurol Res. 1996;18:241–243. doi: 10.1080/01616412.1996.11740412. [DOI] [PubMed] [Google Scholar]
- 17.Cwik VA, Hanstock CC, Allen PS, Martin WR. Estimation of brainstem neuronal loss in amyotrophic lateral sclerosis with in vivo proton magnetic resonance spectroscopy. Neurology. 1998;50:72–77. doi: 10.1212/wnl.50.1.72. [DOI] [PubMed] [Google Scholar]
- 18.Pioro EP, Majors AW, Mitsumoto H, Nelson DR, Ng TC. 1H-MRS evidence of neurodegeneration and excess glutamate+glutamine in ALS medulla. Neurology. 1999;53:71–79. doi: 10.1212/wnl.53.1.71. [DOI] [PubMed] [Google Scholar]
- 19.Bowen BC, Pattany PM, Bradley WG, et al. MR imaging and localized proton spectroscopy of the precentral gyrus in amyotrophic lateral sclerosis. AJNR Am J Neuroradiol. 2000;21:647–658. [PMC free article] [PubMed] [Google Scholar]
- 20.Chan S, Shungu DC, Douglas-Akinwande A, Lange DJ, Rowland LP. Motor neuron diseases: comparison of single-voxel proton MR spectroscopy of the motor cortex with MR imaging of the brain. Radiology. 1999;212:763–769. doi: 10.1148/radiology.212.3.r99au35763. [DOI] [PubMed] [Google Scholar]
- 21.Tarducci R, Sarchielli P, Presciutti O, et al. Study of the primary motor cortex in amyotrophic lateral sclerosis by quantitative 1HMRS. ISMRM. 2000;1:632. [Google Scholar]
- 22.Petropoulos H, Mandler RN, Qualls C, et al. 1H-MRS reveals diffuse neuronal injury in amyotrophic lateral sclerosis. ISMRM. 2000;1:633. [Google Scholar]
- 23.World Federation of Neurology Research Group. El Escorial World Federation of Neurology Criteria for the Diagnosis of Amyotrophic Lateral Sclerosis. J Neurol Sci. 1994;124(suppl):96–107. doi: 10.1016/0022-510x(94)90191-0. [DOI] [PubMed] [Google Scholar]
- 24.Haase A, Frahm J. Multiple chemical-shift-selective NMR imaging using stimulated echoes. J Magn Reson. 1985;64:94–102. [Google Scholar]
- 25.Tanabe JL, Amend D, Schuff N, et al. Tissue segmentation of the brain in Alzheimer’s disease. American Journal of Neuroradiology. 1997;18:115–123. [PMC free article] [PubMed] [Google Scholar]
- 26.Schuff N, Ezekiel F, Gamst A, et al. Region and tissue differences of metabolites in normally aged brain using 1H magnetic resonance spectroscopic imaging. Magn Reson Med. 2001;45:899–907. doi: 10.1002/mrm.1119. [DOI] [PMC free article] [PubMed] [Google Scholar]
- 27.Haupt CI, Schuff N, Weiner MW, Maudsley AA. Removal of lipid artifacts in 1H spectrscopic imaging by data extrapolation. Magn Reson Med. 1996;35:678–687. doi: 10.1002/mrm.1910350509. [DOI] [PMC free article] [PubMed] [Google Scholar]
- 28.Soher BJ, Young K, Govindaraju V, Maudsley AA. Automated spectral analysis III: application to in vivo proton MR spectroscopy and spectroscopic imaging. Magn Reson Med. 1998;40:822–831. doi: 10.1002/mrm.1910400607. [DOI] [PubMed] [Google Scholar]
- 29.Ellis CM, Suckling J, Amaro E, Jr, et al. Volumetric analysis reveals corticospinal tract degeneration and extramotor involvement in ALS. Neurology. 2001;57:1571–1578. doi: 10.1212/wnl.57.9.1571. [DOI] [PubMed] [Google Scholar]
- 30.Hanagasi HA, Gurvit IH, Ermutlu N, et al. Cognitive impairment in amyotrophic lateral sclerosis: evidence from neuropsychological investigation and event-related potentials. Cognitive Brain Research. 2002;14:234–244. doi: 10.1016/s0926-6410(02)00110-6. [DOI] [PubMed] [Google Scholar]
- 31.Strong MJ, Grace GM, Orange JB, Leeper HA, Menon RS, Aere C. A prospective study of cognitive impairment in ALS. Neurology. 1999;53:1665–1670. doi: 10.1212/wnl.53.8.1665. [DOI] [PubMed] [Google Scholar]
- 32.Lloyd CM, Richardson MP, Brooks DJ, Al-Chalabi A, Leigh PN. Extramotor involvement in ALS: PET studies with the GABAA ligand [11C]flumazenil. Brain. 2000;123:2289–2896. doi: 10.1093/brain/123.11.2289. [DOI] [PubMed] [Google Scholar]
- 33.Ludolph AC, Langen KJ, Regard M, et al. Frontal lobe function in amyotrophic lateral sclerosis: a neuropsychologic and positron emission tomography study. Acta Neurol Scand. 1992;85:81–89. doi: 10.1111/j.1600-0404.1992.tb04003.x. [DOI] [PubMed] [Google Scholar]
- 34.Evdokimidis I, Constantinidis TS, Gourtzelidis P, et al. Frontal lobe dysfunction in amyotrophic lateral sclerosis. J Neurol Sci. 2002;195:25–33. doi: 10.1016/s0022-510x(01)00683-9. [DOI] [PubMed] [Google Scholar]