

Summary
Introduction
Quantitative measurements of T2 relaxation in the hippocampus for focus lateralization in mesial temporal lobe epilepsy (mTLE) are well established. Less is known to what degree such relaxation abnormalities also affect regions beyond the ipsilateral hippocampus. Therefore, the aim of this study was to characterize extent and distribution pattern of extrahippocampal relaxation abnormalities in TLE with (TLE-MTS) and without MRI evidence of mesial-temporal sclerosis (TLE-no).
Methods
Double spin echo images (TE1/2: 20/80 ms) acquired in 24 TLE-MTS and 18 TLE-no were used to calculate relaxation rate maps. These maps were analyzed by SPM2 and by selecting regions of interest (ROI) in the hippocampus and several extrahippocampal brain regions.
Results
In TLE-MTS, the results of the SPM and ROI analysis were in good agreement and showed the most severe relaxation rate decreases in the ipsilateral hippocampus but also in other ipsilateral temporal regions, orbitofrontal, and parietal regions and to a lesser degree in contralateral frontal regions. The relaxation rate decreases in TLE-no were confined to small regions in the ipsilateral anterior inferior and medial temporal lobe in the SPM analysis while ROI analysis showed additional regions in the ipsilateral hippocampus, amygdala, and anterior cingulate.
Conclusion
TLE-MTS showed extensive, widespread but predominantly ipsilateral temporal and also extratemporal T2 relaxation rate decreases. In contrast, the findings of the SPM and ROI analyses in TLE-no suggested that if relaxation rate decreases are present, they are less uniform and generally milder than in TLE-MTS. This further supports the hypothesis that TLE-no is a distinct clinicopathological entity from TLE-MTS and probably heterogeneous in itself.
Keywords: TLE, Extratemporal, Voxel-based, Mesiotemporal sclerosis, Normal MRI, Relaxation rate
Mesial temporal lobe epilepsy (mTLE) is one of most common forms of partial epilepsy in adults. In the majority of patients (60%–70%) mTLE is associated with hippocampal sclerosis, which is characterized by hippocampal atrophy on the MRI and severe hippocampal neuronal cell loss on the histological examination. In about 20%–30% of the patients, however, the hippocampus appears normal on the MRI and the histopathological examination shows no or only minimal neuronal loss (TLE-no). Hippocampal sclerosis is typically associated with a prolonged T2 relaxation, i.e., with a visually apparent signal increase on T2-weighted images. Quantitative measurements of T2 relaxation in the hippocampal formation have found to be very useful for focus lateralization in mTLE and not only correctly identify the epileptogenic hippocampus in over 90% of TLE-MTS but also in up to 80% of TLE-no (Namer et al., 1998; Bernasconi et al., 2000). Furthermore, histopathological studies showed the prolonged T2 relaxation to be well correlated with the degree of hippocampal neuronal cell loss and/or gliosis (Briellmann et al., 2002; Von Oertzen et al., 2002). However, despite its usefulness, T2 relaxometry is not widely used clinically for presurgical evaluation. One reason for this is the relatively long acquisition time of the multispin echo Carr–Purcell–Meiboom–Gill sequence traditionally used for T2 relaxometry. Therefore, in clinical settings a simple double spin echo sequence is often preferred to the Carr–Purcell–Meiboom–Gill sequence and has successfully been used for focus lateralization (Duncan et al., 1996; Bartlett et al., 2002; Okujava et al., 2002; Von Oertzen et al., 2002) despite its inherent limitations, e.g., incorrect assumption of a mono-exponential decay in voxels of mixed tissue composition or error propagation from a two point fit of an exponential function etc. (Jack, 1996). Another limitation of T2 relaxation measurements is that they usually employ a region of interest (ROI) analysis, which not only requires an a priori assumption about the focus localization in the brain but also restricts the number of extrafocal brain regions to be explored. However, two recently published studies report the successful application of voxel-based statistical parametric mapping (SPM) to T2 relaxometry (Pell et al., 2004; Rugg-Gunn et al., 2005), thus allowing for an operator independent, automated analysis of the whole brain. The exploration of extrafocal brain areas is particularly important for TLE-MTS because other neuroimaging modalities, e.g., volumetric MRI, MR spectroscopy, PET etc., have shown that structural and metabolic abnormalities are not restricted to the region of the suspected focus but also affect remote brain regions. Extrafocal abnormalities, particularly metabolic abnormalities, have also been described in TLE-no but compared to TLE-MTS are less severe and more often also found contralaterally (Mueller et al., 2004). In this study we calculated T2 relaxation rate maps from double spin echo studies and analyzed them using statistical parametric mapping and ROI analysis. The aims of this study were as follows: (1) To identify regions of T2 relaxation abnormalities beyond the hippocampus in TLE-MTS. Based on the findings of other neuroimaging modalities, we expected them to affect the ipsilateral temporal lobe, frontoorbital region, insula, and parietal regions. (2) To identify regions of T2 relaxation abnormalities beyond the hippocampus in TLE-no, which were expected to affect the same regions as in TLE-MTS but to be less severe and more diffuse.
METHODS
Study population
The committee of human research at the University of California, San Francisco (UCSF) approved the study and written informed consent was obtained from each subject according to the Declaration of Helsinki. Forty-two consecutive patients suffering from drug resistant TLE were recruited from the Northern California Comprehensive Epilepsy Center, UCSF, and the Pacific Epilepsy Program, California Pacific Medical Center, where they underwent evaluation for epilepsy surgery. Twenty-four patients (mean age 35.6 ± 10.1; left TLE/right TLE: 13/11; women/men 9/15) had evidence of mesial temporal lobe sclerosis on MRI, i.e., hippocampal T2 signal hyperintensity and/or atrophy, (TLE-MTS). The remaining 18 patients (mean age 34.7 ± 11.5; left TLE/right TLE: 11/7; women/men: 10/8) had no evidence for mesial temporal sclerosis and, except for one patient with a small right parietal arteriovenous malformation, normal MRIs. The identification of the epileptogenic focus was based on seizure semiology and prolonged ictal and interictal scalp Video/EEG/Telemetry (VET) in all patients. All patients had been seizure free for at least 24 h before the MRI. The control population consisted of 30 healthy volunteers (mean age 30.3 ± 7.9; women/men: 15/15).
MRI acquisition and postprocessing
All subjects were studied on a 1.5 T Vision MR system. The following sequences were obtained as part of a larger study protocol: A 3D volumetric magnetization-prepared rapid gradient echo (MPrage) with TR/TE/TI = 13.5/7/300 ms, 15° flip angle, 1.0 × 1.0 mm2 in-plane resolution and slice thickness 1.5 mm, 144 coronal images. The first 39 subjects (19 controls, 13 TLE-MTS, 7 TLE-no) were studied with a double spin echo (DSE) sequence with TR/TE1/TE2 2575/20/80 ms 1.0 × 1.0 mm2 in-plane resolution and slice thickness 3 mm, 49 axial images, interleaved acquisition. Because the interleaved acquisition resulted in loss of data in a nonnegligible percentage of exams due to motion between the two acquisitions or operator error, a noninterleaved DSE sequence with a longer TR (TR/TE1/TE2 5000/20/80 ms 1.0 × 1.0 mm2 in-plane resolution and slice thickness 3 mm, 49 axial images) was used for the remaining 33 subjects (11 controls, 11 TLE-MTS, 11 TLE-no).
Data were analyzed using SPM2 (Wellcome Department of Cognitive Neurology, www.fil.ion.ucl.ac.uk) running MATLAB 6.1 (The MathWorks, Natick, MA, USA) on a Windows XP computer. Fig. 1 gives an overview of the postprocessing steps. Altogether, there were three postprocessing steps.
FIG. 1.
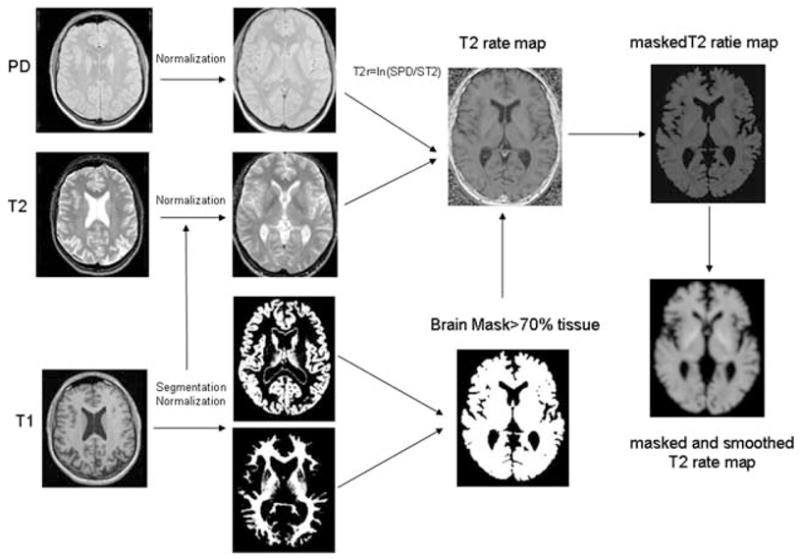
Postprocessing steps (see also Methods). The T1 was coregistered to T2/PD and the resulting image was used for segmentation with SPM2. The gray matter map was then normalized to the gray matter prior and the deformation parameters were applied to the coregistered T1, T2, and PD. The normalized T2 and PD were used to create T2 relaxation rate maps, which were masked with a tissue mask to reduce partial volume effects. For the analysis in SPM, the masked T2 relaxation maps were smoothed with a Gaussian kernel of 4 mm FWH.
Creation of a symmetrical T1 template and priors to allow for the combination of right and left TLE. This step was necessary because the number of subjects in the two patient groups was too small to analyze right TLE and left TLE separately. The symmetrical customized T1-weighted template and symmetrical customized gray, white and CSF priors were created from the T1-weighted images of the control group (30 original images and 30 side-flipped images) (Good et al., 2001b). Left and right TLE were combined by side-flipping all images of the left-sided TLE group so that the focus was on the same side in all TLE subjects.
Creation of a tissue mask. The T1-weighted image was co-registered and resampled to the resolution of the T2/proton density (PD) weighted images. These coregistered and resampled T1-weighted images (original and left-right flipped control images, original right TLE images, and left-right flipped left TLE images) were then segmented in native space into gray and white matter images, followed by a series of fully automated morphological operations for removing unconnected nonbrain voxels from the segmented images as described by Good et al. (2001a). The gray images were then spatially normalized to the customized symmetrical GM template and these deformation parameters applied to all other structural images of this subject (T1, PD, T2-weighted images). The normalized T1-weighted images were then segmented into gray, white and CSF and the brain extraction step was repeated. The resulting gray and white matter images of each subject were used to calculate a tissue mask for this subject which was thresholded at 0.7, i.e., contained only pixels with at least 70% tissue content.
Creation of T2 relaxation rate map: Using the normalized PD (TE = 20 ms) and the normalized T2 (TE =80 ms) weighted images relaxation rate maps were calculated according to the following formula: T2 rate = ln (SPD/ST2) where SPD represents the signal from the PD weighted image and ST2 the signal from the T2 weighted image. The resulting T2 rate maps were then masked with the tissue mask image to reduce CSF partial volume effects.
Data analysis
SPM analysis
For the analysis in SPM2, the masked normalized T2 rate maps were smoothed with a 4 mm isotropic Gaussian kernel. The analysis included grand mean scaling and normalization for global differences in voxel intensity across scans by inclusion of the global mean voxel value as a confounding covariate. Age and TR were included as nuisance variables. Regions with significant decreases of the T2 relaxation rate in TLE-MTS versus controls, TLE-no versus Controls, and TLE-MTS versus TLE-no or TLE-no versus TLE-MTS were detected at an individual voxel intensity threshold of p < 0.001 and a cluster extent threshold of p < 0.05 (300 voxels).
Region of interest (ROI) analysis
To improve the consistency of ROI placement, the following ROIs were drawn on the normalized PD image of one control subject with the ROI tool of MRI-cro (www.mricro.com; Author: Chris Rorden): Left and right amygdala, hippocampal head, temporal stem, fronto-orbital white matter, posterior thalamus, white matter of anterior and posterior cingulate and parietal lobe (c.f., Fig. 2). The coordinates of these ROI were then applied to the PD images of each TLE subject and each remaining control and, if necessary, slightly adjusted to ensure that no CSF was included in the region of the hippocampus/amygdala ROIs or that no gray matter was included in white matter ROIs and finally transferred to the corresponding unsmoothed relaxation rate map.
FIG. 2.
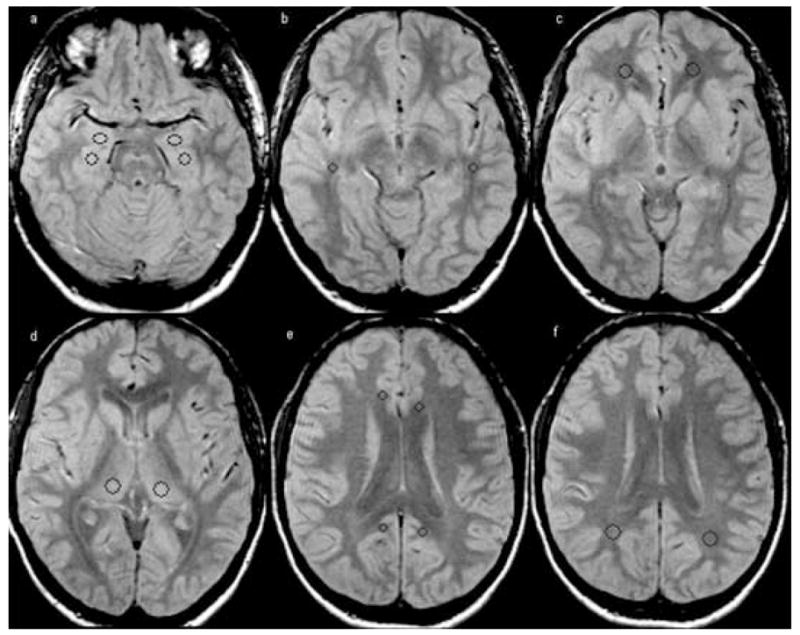
Placement of the regions of interest (ROI) in the hippocampus (size: 44 pixels, Talairach coordinates: −24, −14, −17 and 27,−14,−17) and, amygdala (size: 44 pixels, Talairach coordinates: −23,−4,−17 and 23,−4,−17) (a), temporal stem (size: 24 pixels, Talairach coordinates: −44,−30,−7 and 46,−30,−7) (b), orbitofrontal white matter (size: 61 pixels, Talairach coordinates: −21,42,−7 and 21,42,−7) (c), thalamus (size: 68 pixels, Talairach coordinates: −14,−23,8 and 18,−23,8) (d), posterior (size: 24 pixels, Talairach coordinates: −11,−46,23 and −7,−48,23) and anterior cingulate (size: 24 pixels, Talairach coordinates −10,29,19 and 10,25,19) (e) and parietal white matter (size: 68 pixels, Talairach coordinates: −28,−50,25 and 31,−50,25) (f).
Kruskal–Wallis tests were used to test for group differences for each ROI, i.e., controls (left and right side combined) versus ipsilateral TLE-MTS and ipsilateral TLE-no and controls (left and right side combined) versus contralateral TLE-MTS and contralateral TLE-no followed by post hoc analyses with Mann–Whitney tests. Wilcoxon tests were used to test for ipsi-/contralateral differences in TLE-MTS and TLE-no. Correction for multiple comparisons was performed with Holm’s test. To identify ROI with abnormal low T2 relaxation rates in individual patients (ROI single subject analysis), a threshold defined as: T2 relaxation rate threshold ≤ mean T2 relaxation ratecontrols −2.5 standard deviation T2 relaxation ratescontrols was calculated for each ROI.
RESULTS
SPM analysis
Table 1 displays the results of the SPM analysis. In the comparison TLE-MTS versus controls large ipsilateral clusters of decreased T2 relaxation rate encompassing hippocampus, parahippocampal gyrus, temporal lobe, frontal and frontoorbital regions and several smaller clusters in the ipsilateral parietooccipital lobe and insular region and in the contralateral orbito-frontal and frontal regions were found (TLE-MTS < controls) (cf Fig. 3a). In the comparison TLE-no versus controls (TLE-no < controls) two clusters of decreased T2 relaxation rate were found corresponding to the ipsilateral inferior temporal gyrus and the parahippocampal gyrus (c.f. Figure 3b). When TLE-MTS were compared to TLE-no (TLE-MTS<TLE-no), clusters of decreased T2 relaxation rate were found in the ipsilateral hippocampal head and white matter of the temporal pole and temporal stem; there were no regions of decreased T2 relaxation rate when TLE-no were compared to TLE-MTS (TLE-no < TLE-MTS).
TABLE 1.
SPM analysis: regions of T2 rate decrease
| Contrast | Side | Region | P corr (cluster) | KE | SPM(T) (voxel) | Peak coordinates in SPM |
|---|---|---|---|---|---|---|
| TLE-MTS < Controls | Ipsi | Hippocampus, temporal pole, temporal stem, superior, medial, inferior temporal gyrus parahippocampial gyrus, frontal, frontoorbital | <0.001 | 26,715 | 16.99 | 32,−22,−16 |
| 12.94 | 28–14–22 | |||||
| 10.55 | 38–1–27 | |||||
| Ipsi | Frontoorbital | <0.001 | 4,200 | 5.11 | 13–61–7 | |
| 4.75 | 18,48–13 | |||||
| 4.71 | 15,29,21 | |||||
| Ipsi | Frontal | 0.027 | 301 | 4.14 | 16,18,32 | |
| 3.45 | 23,14,35 | |||||
| Ipsi | Parietooccipital | 0.006 | 384 | 4.63 | 37–65,21 | |
| 4.00 | 29–72,21 | |||||
| Ipsi | Operculum, insula | 0.001 | 514 | 4.38 | 37–22,24 | |
| 4.32 | 35–9,21 | |||||
| Contra | Frontal, frontoorbital | <0.001 | 1,040 | 5.05 | −20,43–1 | |
| 3.99 | −15,29,21 | |||||
| 3.92 | −22,38,16 | |||||
| 0.020 | 316 | 5.00 | −16,56,1 | |||
| Contra | Frontal | 0.038 | 283 | 3.95 | −22,38,16 | |
| TLE-no<Controls | Ipsi | Inferior temporal gyrus | 0.010 | 355 | 5.64 | −22,38,16 |
| 5.04 | 48,6–37 | |||||
| Ipsi | Parahippcampal gyrus | <0.001 | 545 | 4.13 | 38–3–37 | |
| 4.06 | 25 0- 31 | |||||
| 3.98 | 33 1-26 | |||||
| TLE-MTS<TLE-no | Ipsi | Hippocampus, parahippocampal gyrus | <0.001 | 2,713 | 9.87 | 32–21–16 |
| 8.25 | 27–13–22 | |||||
| 5.54 | 28–29–17 | |||||
| Ipsi | Temporal pole | <0.001 | 1,561 | 5.31 | 40,1–39 | |
| 5.17 | 43,7–30 | |||||
| 4.94 | 37,9–37 |
Ipsi, ipsilateral; Contra, contralateral.
FIG. 3.
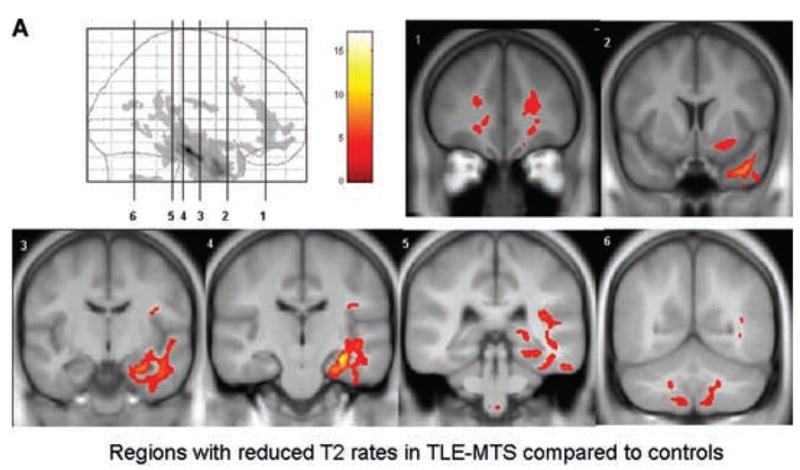

FIG. 3a. Regions with reduced-relaxation rates in TLE-MTS (a) and TLE-no (b) and in TLE-MTS compared with TLE-no (c). TLE-no had no regions with reduced-relaxation rate when compared with TLE-MTS, indicating that T2 relaxation abnormalities are more severe in the former group. The regions are displayed on the averaged symmetrical T1 image of the control group.
Region of interest analysis
The Kruskal–Wallis tests showed a significant group effect (p < 0.05) for ipsilateral amygdala, hippocampus, thalamus, white matter of anterior cingulate and parietal lobe and ipsi- and contralateral temporal stem and fronto-orbital white matter. The results of the post hoc analyses and side comparisons are displayed in Table 2. In TLE-MTS, the findings of the ROI analysis were in good agreement with the findings of the SPM analysis. Compared to controls, a decreased T2 relaxation rate was found in the ipsilateral amygdala, hippocampus, thalamus, anterior cingulate, and parietal lobe and ipsi- and contralateral temporal stem and frontoorbital white matter. In TLE-no, the ROI analysis showed a decreased T2 relaxation rate in the ipsilateral amygdala, hippocampus and anterior cingulate. These regions were normal in the SPM analysis.
TABLE 2.
Region of interest analysis: group and side comparisons
| Controls n = 30 |
TLE-MTS n = 24 |
TLE-no n = 18 |
|
|---|---|---|---|
| Mean (SD) | Mean (SD) | Mean (SD) | |
| Amygdala | Left + right 0.81(0.02) Left + right 0.81(0.02) |
||
| Ipsi | 0.78 (0.03)a,b | 0.79 (0.03)a,b | |
| Contra | 0.80 (0.02) | 0.81 (0.02) | |
| Hippcampus | Left + right 0.79 (0.02) | ||
| Ipsi | 0.73 (0.03)a,b,c | 0.77 (0.03)a,b | |
| Contra | 0.78 (0.02) | 0.79 (0.02) | |
| Temporal stem | Left + right 0.95 (0.03) | ||
| Ipsi | 0.91 (0.03)b,c | 0.93 (0.04) | |
| Contra | 0.92 (0.03) | 0.94 (0.03) | |
| Frontoorbital | Left + right 1.02 (0.02) | ||
| Ipsi | 0.99 (0.03)b,c | 1.01 (0.04) | |
| Contra | 1.00 (0.03)b | 1.02 (0.04) | |
| Anterior cingulate | Left + right 0.98 (0.03) | ||
| Ipsi | 0.96 (0.02)b | 0.97 (0.02)b | |
| Contra | 0.97 (0.04) | 0.97 (0.04) | |
| Posterior cingulate | Left + right 0.97 (0.02) | ||
| Ipsi | 0.96 (0.03) | 0.97 (0.04) | |
| Contra | 0.96 (0.02) | 0.96 (0.03) | |
| Thalamus | Left + right 0.96 (0.02) | ||
| Ipsi | 0.95 (0.03)a,b | 0.96 (0.03) | |
| Contra | 0.97 (0.02) | 0.96 (0.04) | |
| Parietal | Left + right 0.91 (0.03) | ||
| Ipsi | 0.87 (0.03)a,b,c | 0.90 (0.03) | |
| Contra | 0.90 (0.03) | 0.90 (0.04) |
p < 0.05 with Wilcoxon compared to contralateral.
p < 0.05 TLE compared to controls or
TLE-MTS compared to TLE- no with Mann–Whitney test corrected for multiple comparisons with Holm’s test.
One control subject had a pathological low T2 relaxation rate in the right hippocampus, when the thresholds to identify ROIs with abnormal low T2 relaxation rate in individual subjects were applied. Therefore, the finding of one abnormal ROI in each subject was expected by chance alone. 54% of the TLE-MTS (median number of pathological ROI: 2, range: 1–6) and 44% of the TLE-no (median number of pathological ROI: 1, range 0–5) had at least two or more abnormal ROI (p > 0.05, with Fisher’s exact test). Table 3 displays the percentage of TLE-MTS and TLE-no with pathological low T2 relaxation rate values in any given ROI. Except for the ipsilateral hippocampal ROI, which was abnormal in 87% of TLE-MTS but only in 17% of TLE-no (p < 0.0001, with Fisher’s exact test), the frequency in which a ROI was abnormal did not differ between TLE-MTS and TLE-no. Two TLE-MTS had bilateral pathological hippocampal T2 relaxation rates; in both cases the side with the more prominent decrease corresponded to the EEG lateralization. None of the TLE-no had bilateral hippocampal abnormalities.
TABLE 3.
Region of interest analysis: percentage of TLE with ROI below threshold
| Side | TLE-MTS n = 24 |
TLE-no n = 18 |
|
|---|---|---|---|
| Amygdala | Ipsi | 13% | 22% |
| Contra | 0% | 11% | |
| Hippocampus | Ipsi | 87%a | 17% |
| Contra | 8% | 0% | |
| Temporal stem | Ipsi | 25% | 17% |
| Contra | 13% | 6% | |
| Frontoorbital | Ipsi | 17% | 17% |
| Contra | 21% | 11% | |
| Anterior cingulate | Ipsi | 0% | 6% |
| Contra | 4% | 6% | |
| Posterior cingulate | Ipsi | 4% | 11% |
| Contra | 4% | 6% | |
| Thalamus | Ipsi | 8% | 0% |
| Contra | 0% | 6% | |
| Parietal | Ipsi | 8% | 11% |
| Contra | 4% | 6% |
p < 0.05 with Fisher’s exact test.
DISCUSSION
The major findings of this study were the following: (1) TLE-MTS had widespread T2 relaxation rate decrease in the ipsilateral temporal lobe which were most severe in the hippocampus in the SPM and ROI analysis. In TLE-no temporal relaxation rate decrease was restricted to small areas in the ipsilateral inferior and medial temporal lobe in the SPM analysis, additional regions were found in the ipsilateral hippocampus and amygdala in the ROI analysis; (2) TLE-MTS showed widespread ipsilateral extratemporal T2 relaxation rate decrease in the ipsilateral insula, frontal and parietooccipital regions and to a lesser degree also in the contralateral frontal lobe in the SPM and ROI analysis; (3) TLE-no had no extratemporal T2 relaxation rate abnormalities in the SPM analysis. However, in the single subject ROI analysis, the frequency in which extratemporal regions with T2 relaxation rate decrease were found in TLE-no was the same as in TLE-MTS.
The first major finding was that relaxation rate decreases in TLE-no were restricted to the ipsilateral anterior inferior temporal gyrus and parahippocampal gyrus in the SPM analysis while the ROI analysis showed additional but compared to TLE-MTS less severe decreases in the ipsilateral hippocampus and amygdala. In contrast, SPM and ROI analysis found both widespread relaxation rate decreases in the ipsilateral temporal lobe of TLE-MTS, which were most prominent in the ipsilateral hippocampus. Together with the finding that the ipsilateral hippocampus was also the most prominently affected structure when TLE-MTS were compared to TLE-no, this would be consistent with assumption that the hippocampus is the epileptogenic focus in TLE-MTS and that the extrahippocampal temporal regions become secondarily involved during seizure spread. The findings in TLE-no are more difficult to interpret. The SPM analysis found the most severe T2 abnormalities in the ipsilateral inferior and medial temporal lobe but the hippocampus was normal. This could suggest that the hippocampus is not as consistently involved in seizure generation/propagation in TLE-no as it is in TLE-MTS. This assumption is supported by the fact that findings of functional studies, e.g., EEG, PET, or MRS also show milder hippocampal abnormalities in TLE-no than in TLE-MTS. However, extrahippocampal temporal functional abnormalities in TLE-no tend often to be widespread and diffuse. For example, intracranial EEG recordings in TLE-no showed that initial ictal discharges often encompass large areas of the anterior and/or medial and sometimes even lateral temporal lobe (Vossler et al., 2004). Similarly, PET and MRS studies have shown that TLE-no can be associated with widespread temporal metabolic abnormalities although they are often less homogeneous and less severe than those found in TLE-MTS (Lamusuo et al., 2001; Carne et al., 2004; Mueller et al., 2004). The characteristics of the temporal abnormalities in functional studies, i.e., widespread, but diffuse and heterogeneous seem to be at odds with the very circumscribed T2 relaxation rate decreases in TLE-no found by the SPM analysis. However, this seeming discrepancy can be resolved if the findings of the single subject ROI analysis are also taken into account, which suggest that at least in some TLE-no T2 relaxation rate abnormalities can be diffuse and widespread. Further research will be necessary, particularly whole brain single subject analyses of T2 abnormalities and careful comparisons with functional findings to fully characterize the T2 abnormalities in TLE-no and address their value for focus localization in this group.
The second major finding was that TLE-MTS had T2 relaxation abnormalities in ipsi- and to a lesser degree contralateral extratemporal regions in the SPM and the ROI analysis. Two studies, one using ROI analysis (Briellmann et al. 2004) and another study from the same group using voxel-based statistical parametric mapping (Pell et al., 2004) described extrahippocampal T2 relaxation abnormalities in the ipsilateral parahippocampal gyrus and in the white matter of the ipsilateral anterior and lateral temporal lobe but found in contrast to our study no extratemporal abnormalities. Technical differences (use of a standard Carr—Purcell–Meiboom–Gill sequence, differences in the SPM analysis and ROI selection) and differences of the patient population studied most likely account for this discrepancy. Although TLE-MTS belongs to the group of focal epilepsies and resection of the epileptogenic hippocampus results in seizure control in a high percentage of patients, ictal (Van Paesschen et al. 2003; Blumenfeld et al., 2004; Chassagnon et al., 2005) and interictal (Van Bogaert et al., 2000; Chassoux et al. 2004; Mueller et al., 2004) functional studies show that abnormalities are not restricted to the hippocampus but rather involve a widespread subcortical and cortical network, consisting of other limbic structures, thalamus, basal ganglia, insular, frontal, and parietal cortical regions. Furthermore, whole brain volumetric measurements using voxel-based morphometry (Bonilha et al., 2004; Keller et al., 2004; McMillan et al., 2004; Mueller et al., 2006) found abnormalities in the same extratemporal brain regions suggesting that extratemporal abnormalities in functional studies are at least partly due to permanent structural alterations rather than to potentially reversible neuronal/glial dysfunction. The nature of these extrahippocampal/extratemporal abnormalities is unknown. On the one hand, they could represent neurodegenerative changes, e.g., loss of neuronal cells, reduction of neuropil or reactive gliosis caused by local excitotoxic effects of seizures spreading from the epileptogenic focus to connected brain areas. On the other hand, it is equally plausible that they could result from developmental abnormalities, e.g., microdysgenetic abnormalities (Eriksson et al., 2002; Thom et al., 2001), which lower the threshold for seizure generation and thus increase the risk for the development of epilepsy later in life and eventually also favor certain routes of seizure propagation once the epileptic disorder is established. Finally, it is also possible that these abnormalities result from a combination of developmental and neurodegenerative influences. Further research is necessary to determine if these extrahippocampal/extratemporal relaxation abnormalities are associated with functional deficits comparable to extratemporal hypometabolic areas in PET studies (Rauch et al., 1994; Jokeit et al., 1997; Azari et al., 1999) and if their presence and extent influence the probability of becoming seizure free after epilepsy surgery.
The third major finding was that TLE-no had no extratemporal relaxation abnormalities when compared with controls in the SPM analysis. There are two possible explanations for this finding. The first is that relaxation abnormalities in TLE-no are indeed confined to the temporal lobe and that extratemporal brain regions are completely normal. However, in this case it would be expected that SPM would show similar widespread abnormalities in the comparison TLE-MTS with TLE-no as it does in the comparison TLE-MTS with controls. This was not the case. The alternative explanation is that TLE-no do have extratemporal relaxation abnormalities but their peculiar characteristics make them difficult to detect by SPM group analysis. Relaxation abnormalities, which might typically be missed by a SPM group analysis, would be expected to be either mild and lack a uniform distribution pattern or be severe but affect only a minority of patients. The assumption that TLE-no do have extratemporal relaxation abnormalities is supported by the findings of the ROI analysis. In the ROI group comparison, the relaxation rates in the different ROI of TLE-no were between those of TLE-MTS and controls and in the ROI single subject analysis, the percentage of TLE-no with abnormal extratemporal ROIs (44%) was not different from the percentage of TLE-MTS subjects (37%) with abnormal extratemporal ROIs. Based on the findings of the ROI analysis, we therefore conclude that at least a subgroup of TLE-no has extratemporal relaxation abnormalities similar to TLE-MTS. As for TLE-MTS, the nature of those extratemporal abnormalities is unclear. The fact that they seem to be less severe in TLE-no suggests either a different etiology and/or a better protection against whatever mechanism is causing them in TLE-MTS. This further supports the notion that, despite their similar seizure semiology and presumably identical seizure origin, these two forms of mTLE are two different clinico-pathological entities and that the TLE-no group might be heterogeneous in itself.
The study has limitations: (1) As pointed out in the introduction, we used a dual spin echo sequence which has several short comings compared to the Carr–Purcell–Meiboom–Gill sequence traditionally used for relaxation measurements (please see Duncan et al., 1996 and Jack, 1996 for a detailed comparison between DSE and Carr–Purcell–Meiboom–Gill sequence in TLE). Furthermore, the echo times used were not optimized for relaxometry, i.e., the second echo time of 80 ms was rather short. Therefore, we cannot exclude that relaxation abnormalities in TLE-no were missed because of limitations of the sequence. (2) We used two slightly different DSE sequences for this study. We tried to account for this by introducing TR as a nuisance variable in the statistical analysis. We also tested for a systemic error due to the two different TR values by comparing T2 rates of controls studied with the short TR with T2 rates of controls studied with the longer TR and found no significant difference, neither in the ROI analysis nor in the SPM analysis. Therefore, we do not think that the different TR influenced the findings of this study. (3) The focus localization was based on clinical signs and ictal scalp VET recordings. Therefore, we cannot completely exclude that in some of the TLE-no the seizures originated from the lateral temporal lobe, which might have contributed to the heterogeneity observed in this group. (4) In contrast to other studies using SPM for whole brain relaxometry (Rugg-Gunn et al., 2005), we did not perform single subject SPM analysis, although this might have given us further insight into the patterns of relaxation abnormalities found in the two TLE groups. We felt that a single-subject analysis would not be appropriate because the method used for normalization in this study allowed for a certain degree of misregistration particularly in cortical regions. In the group analysis, this resulted probably in a high variability in cortical regions and thus might explain why the relaxation abnormalities were mostly found in white matter structures. In single subject analysis, misregistrations of this type might cause false positive findings, e.g., result in regions with significant reduced-relaxation rates in a deeper-than-usual sulcus. (5) Although it might have given further information regarding the nature of the relaxation abnormalities, we did not try to correlate the relaxation abnormalities with measures of lifetime seizure severity because this information could often not reliably be obtained.
In conclusion, we found widespread extrahippocampal and extratemporal relaxation abnormalities in TLE-MTS. In contrast, relaxation abnormalities in TLE-no were confined to small regions of the anterior temporal lobe, however, the ROI analysis suggested that there is a subgroup of TLE-no, which has similar extratemporal abnormalities as TLE-MTS. This provides further evidence that TLE-MTS is a distinct clinicopathological entity from TLE-no and that the latter group might be heterogeneous in itself.
Acknowledgments
The study has been supported by a NIH grant (ROI-NS31966) to Dr. Laxer.
References
- Azari NP, Knorr U, Arnold S, Antke C, Ebner A, Niemann H, Pettigrew KD, Witte OW, Seitz RJ. Reorganized cerebral interactions in temporal lobe epilepsy. Neuropsychologia. 1999;37:625–636. doi: 10.1016/s0028-3932(98)00130-4. [DOI] [PubMed] [Google Scholar]
- Bartlett PA, Richardson MP, Duncan JS. Measurement of amygdala T2 relaxation time in temporal lobe epilepsy. Journal of Neurology Neurosurgery and Psychiatry. 2002;73:753–755. doi: 10.1136/jnnp.73.6.753. [DOI] [PMC free article] [PubMed] [Google Scholar]
- Bernasconi A, Bernasconi N, Caramanos Z, Reutens DC, Andermann F, Dubeau F, Tampieri D, Pike BG, Arnold DL. T2 relaxometry can lateralize mesial temporal lobe epilepsy in patients with normal MRI. Neuroimage. 2000;12:739–746. doi: 10.1006/nimg.2000.0724. [DOI] [PubMed] [Google Scholar]
- Blumenfeld H, McNally K, Vanderhill SD, Page AL, Chung R, Davis K, Norden AD, Stokking R, Studholme C, Novotney EJ, Zunal IG, Spencer SS. Positive and negative network correlations in temporal lobe epilepsy. Cerebral Cortex. 2004;14:892–902. doi: 10.1093/cercor/bhh048. [DOI] [PubMed] [Google Scholar]
- Bonilha L, Rorden C, Castellano G, Pereira F, Rio PA, Cendes F, Li ML. Voxel-based morphometry reveals gray matter network atrophy in refractory medial temporal lobe epilepsy. Archives of Neurology. 2004;61:1379–1384. doi: 10.1001/archneur.61.9.1379. [DOI] [PubMed] [Google Scholar]
- Briellmann RS, Kalnins RM, Berkovic SF, Jackson GD. Hippocampal pathology in refractory temporal lobe epilepsy. T2 weighted signal change reflects gliosis. Neurology. 2002;58:265–271. doi: 10.1212/wnl.58.2.265. [DOI] [PubMed] [Google Scholar]
- Briellmann RS, Jackson GD, Pell GS, Mitchell LA, Abbott DF. Structural abnormalities remote from the seizure focus. Neurology. 2004;62:2303–2308. doi: 10.1212/01.wnl.0000148646.31755.59. [DOI] [PubMed] [Google Scholar]
- Carne PR, O’Brien TJ, Kilpatrick CJ, MacGregor LR, Hicks RJ, Murphy MA, Bowden SC, Kaye AH, Cook MJ. MRI negative PET positive temporal lobe epilepsy: a distinct surgically remediable syndrome. Brain. 2004;127:2276–2285. doi: 10.1093/brain/awh257. [DOI] [PubMed] [Google Scholar]
- Chassagnon S, Pereira de Vasconcelos A, Ferrandon A, Koning E, Marescaux C, Nehlig A. Time course and mapping of cerebral perfusion during amygdala secondarily generalized seizures. Epilepsia. 2005;46:1178–1187. doi: 10.1111/j.1528-1167.2005.07505.x. [DOI] [PubMed] [Google Scholar]
- Chassoux F, Semah F, Bouilleret V, Landre E, Devaux B, Turak B, Nataf F, Roux FX. Metabolic changes and electro-clinical patterns in mesiotemporal lobe epilepsy: a correlative study. Brain. 2004;127:164–174. doi: 10.1093/brain/awh014. [DOI] [PubMed] [Google Scholar]
- Duncan JS, Bartlett P, Barker GJ. Technique for measuring hippocampal T2 relaxation time. American Journal of Neuroradiology. 1996;17:1805–1810. [PMC free article] [PubMed] [Google Scholar]
- Eriksson SH, Rydenhag B, Uvebrant P, Malmgren K, Norborg C. Widespread microgenesis in therapy resistant epilepsy – a case report on post mortem findings. Acta Neuropathologica. 2002;103:74–77. doi: 10.1007/s004010100426. [DOI] [PubMed] [Google Scholar]
- Good CD, Johnsrude IS, Ashburner J, Henson RNA, Friston KJ, Frackowiak RSJ. Cerebral asymmetry and the effects of sex and handedness on brain structure: a voxel-based morphometric analysis of 465 normal adult human brains. Neuroimage. 2001a;14:685–700. doi: 10.1006/nimg.2001.0857. [DOI] [PubMed] [Google Scholar]
- Good CD, Johnsrude IS, Ashburner J, Henson RNA, Friston KJ, Frackowiak RSJ. A voxel-based morphometric study of aging in 465 normal adult human brains. Neuroimage. 2001b;14:21–36. doi: 10.1006/nimg.2001.0786. [DOI] [PubMed] [Google Scholar]
- Jack CR. Hippocampal T2 relaxometry in epilepsy: past, present, and future. American Journal of Neuroradiology. 1996;17:1811–1814. [PMC free article] [PubMed] [Google Scholar]
- Jokeit H, Seitz RJ, Markowitsch HJ, Neumann N, Witte OW, Ebner A. Prefrontal asymmetric interictal glucose hypometabolism and cognitive impairment in patients with temporal lobe epilepsy. Brain. 1997;120:2283–2294. doi: 10.1093/brain/120.12.2283. [DOI] [PubMed] [Google Scholar]
- Keller SS, Wilke M, Wieshmann UC, Sluming VA, Roberts N. Comparison of standard and optimized voxel-based morphometry for analysis of brain changes associated with temporal lobe epilepsy. Neuroimage. 2004;23:860–868. doi: 10.1016/j.neuroimage.2004.07.030. [DOI] [PubMed] [Google Scholar]
- Lamusuo S, Jutila L, Ylinen A, Kälviäinen R, Mervaala E, Haarparanta M, Jääskeläinen S, Partanen K, Vapalathi M, Rinne J. 18F FDG-PET reveals temporal hypometabolism in patients with temporal lobe epilepsy even when quantitative MRI and histopathological analysis show only mild hippocampal damage. Archives of Neurology. 2001;58:933–939. doi: 10.1001/archneur.58.6.933. [DOI] [PubMed] [Google Scholar]
- McMillan AB, Herman BP, Johnson SC, Hansen RR, Seidenberg M, Meyerand ME. Voxel-based morphometry of unilateral temporal lobe epilepsy reveals abnormalities in cerebral white matter. Neuroimage. 2004;23:167–174. doi: 10.1016/j.neuroimage.2004.05.002. [DOI] [PubMed] [Google Scholar]
- Mueller SG, Laxer KD, Cashdollar N, Flenniken DL, Matson GB, Weiner MW. Identification of abnormal neuronal metabolism outside the seizure focus in temporal lobe epilepsy. Epilepsia. 2004;45:355–366. doi: 10.1111/j.0013-9580.2004.27603.x. [DOI] [PMC free article] [PubMed] [Google Scholar]
- Mueller SG, Laxer KD, Cashdollar N, Buckley S, Paul C, Weiner MW. Voxel-based optimized morphometry (VBM) of gray and white matter in temporal lobe epilepsy (TLE) with and without mesial temporal sclerosis. Epilepsia. 2006;47:900–907. doi: 10.1111/j.1528-1167.2006.00512.x. [DOI] [PMC free article] [PubMed] [Google Scholar]
- Namer IJ, Waydelich R, Armspach JP, Hirsch E, Marescaux C, Grucker D. Contribution of T2 relaxation time mapping in the evaluation of cryptogenic temporal lobe epilepsy. Neuroimage. 1998;7:304–313. doi: 10.1006/nimg.1998.0331. [DOI] [PubMed] [Google Scholar]
- Okujava M, Schulz R, Ebner A, Woermann FG. Measurement of temporal T2 relaxation times using a routine diagnostic MR imaging protocol in epilepsy. Epilepsy Research. 2002;48:131–142. doi: 10.1016/s0920-1211(01)00325-4. [DOI] [PubMed] [Google Scholar]
- Pell GS, Briellmann RS, Waites AB, Abbott DF, Jackson GD. Voxel-based relaxometry: a new approach for analysis of T2 relaxometry changes in epilepsy. Neuroimage. 2004;21:707–713. doi: 10.1016/j.neuroimage.2003.09.059. [DOI] [PubMed] [Google Scholar]
- Rausch R, Henry TR, Ary CM, Engel J, Mazziotta J. Asymmetric interictal glucose hypometabolism and cognitive performance in epileptic patients. Archives of Neurology. 1994;51:139–144. doi: 10.1001/archneur.1994.00540140045013. [DOI] [PubMed] [Google Scholar]
- Rugg-Gunn FJ, Boulby PA, Symms MR, Barker GJ, Duncan JS. Whole brain T2 mapping demonstrated occult abnormalities in focal epilepsy. Neurology. 2005;64:318–325. doi: 10.1212/01.WNL.0000149642.93493.F4. [DOI] [PubMed] [Google Scholar]
- Thom M, Sisodiya S, Harkness W, Scaravilli F. Microdysgenesis in temporal lobe epilepsy. A quantitative and immunohistochemical study of white matter neurons. Brain. 2001;124:2299–2309. doi: 10.1093/brain/124.11.2299. [DOI] [PubMed] [Google Scholar]
- Van Bogaert P, Massager N, Tugendhaft P, Wikler D, Damhaut P, Levivier M, Brotchi J, Goldman S. Statistical parametric mapping of the regional glucose metabolism in mesial temporal lone epilepsy. Neuroimage. 2000;12:129–138. doi: 10.1006/nimg.2000.0606. [DOI] [PubMed] [Google Scholar]
- Van Paesschen W, Dupont P, van Driel G, van Billoen H, Meas A. SPECT perfusion changes during complex partial seizures in patients with hippocampal sclerosis. Brain. 2003;126:1103–1111. doi: 10.1093/brain/awg108. [DOI] [PubMed] [Google Scholar]
- Von Oertzen J, Urbach H, Blumke I, Reuber M, Träber F, Peveling T, Menzel C, Elger CE. Time-efficient T2 relaxometry of the entire hippocampus is feasible in temporal lobe epilepsy. Neurology. 2002;58:527–264. doi: 10.1212/wnl.58.2.257. [DOI] [PubMed] [Google Scholar]
- Vossler DG, Kraemer DL, Haltiner AM, Rostad SW, Kjos BO, Davis BJ, Morgan JD, Caylor LM. Intracranial EEG in temporal lobe epilepsy: Location of seizure onset relates to degree of hippocampal pathology. Epilepsia. 2004;45:497–503. doi: 10.1111/j.0013-9580.2004.47103.x. [DOI] [PubMed] [Google Scholar]