

Summary
Purpose
Long echo time (TE) spectroscopy reliably identifies the epileptogenic hippocampus in mesial temporal lobe epilepsy. Short-TE spectroscopy gives additional metabolic information but may have more artifacts. The aim of this study was to test (a) lateralization of the seizure focus by short-TE spectroscopy, and (b) value of myoinositol (MI) in the identification of the epileptogenic hippocampus.
Methods
Twenty-four patients with temporal lobe epilepsy: 16 with mesial temporal sclerosis (TLE-MTS), eight patients with normal magnetic resonance imaging (MRI; TLE-No), and 16 controls were studied with hippocampal 2D short-TE magnetic resonance spectroscopic imaging (MRSI).
Results
In TLE-MTS, the ipsilateral N-acetylaspartate (NAA) was decreased compared with contralateral (p = 0.03) or controls (p = 0.007). Additionally, the ipsilateral MI was decreased compared with controls (p = 0.012). TLE-No values showed no side differences and were not different from controls. Abnormalities in the anterior hippocampus correctly lateralized the epileptogenic hippocampus in ≤82% of TLE-MTS and in ≤80% of the TLE-No.
Conclusions
The accuracy of short-TE MRSI at 1.5 T for focus lateralization in mTLE is comparable to that of long-TE MRSI. MI might be helpful for focus lateralization, but more information about the factors influencing the MI concentration is needed.
Keywords: Epilepsy, Spectroscopy, Short echo time, Myoinositol
Accurate lateralization of the epileptogenic hippocampus is crucial for the success of epilepsy surgery in mesial temporal lobe epilepsy (mTLE). Magnetic resonance spectroscopy (MRS) correctly identifies the epileptogenic hippocampus by a reduction of the neuronal marker N-acetylaspartate (NAA) in ~75–95% of the patients (TLE-MTS) with MRI evidence for MTS (i.e., hippocampal atrophy and/or increased T2 signal, and in ~60–70% of the patients (TLE-No) with normal MRI. The close proximity of bone, sinuses, and blood vessels in the hippocampal region makes it difficult to achieve a good homogeneity of the magnetic field, and thus spectroscopy studies in the hippocampal region have often used long echo times (TEs) (135–272 ms). Long-TE spectra are less prone to artifacts due to lipid contamination and incomplete water suppression. Furthermore, the limited number of metabolite peaks, NAA, creatine/phosphocreatine (Cr), choline compounds (Cho) facilitates quantification. However, short-TE spectra (25–35 ms) allow the measurement of additional, potentially biochemically important metabolites. One such metabolite is myoinositol (MI), which is well resolved at 1.5 T and therefore can be quantified. The aims of this study were to evaluate (a) whether short-TE magnetic resonance spectroscopic imaging (MRSI) could lateralize mTLE as accurately as can long-TE MRSI; and (b) the value of MI in the identification of the epileptogenic hippocampus in mTLE.
METHODS
Study population
We studied 24 patients with mTLE (age 36.9 ± 9.3 years) and 16 controls (age 32.9 ± 11.2 years). Sixteen patients had evidence for MTS on MRI (TLE-MTS: right mTLE, eight; left mTLE, eight), and eight had normal MRI (TLE-No: right mTLE, three; left mTLE, five). Patients were recruited from the Comprehensive Epilepsy Center at the University of California, San Francisco, where they underwent evaluation for epilepsy surgery. They were seizure free for ≥24 h before the spectroscopic measurement.
Structural MRI and 2D MRSI acquisition
After obtaining informed consent from all participants, studies were performed on a 1.5-T Magnetom Vision™ MR system (Siemens, Inc., Iselin, NJ, U.S.A.). The following images were acquired: (a) T1-weighted fast low-angle shot (FLASH) with TR/TE = 500/14 ms, parallel to the long axis of the hippocampus; (b) double spin-echo (DSE) TR/TE1/TE2 = 2,500/20/80 ms; (c) volumetric magnetization-prepared rapid gradient echo (MPRAGE), TR/TE/TI = 13.5/7/300 ms; 1.0 × 1.0-mm2 in-plane resolution; slice thickness, 1.4 mm. DSE and MPRAGE were used for segmentation (1). The hippocampus was manually marked on the MPRAGE by using a commercially available brain mapping tool (Surgical Navigator Technology, Inc., Boulder, CO, U.S.A.), and this information added to the segmented image. Spectroscopic measurements were done with a 2D MRSI sequence (TR/TE = 1,800/25 ms) by using PRESS volume preselection (15 mm axial, 60 mm left–right, 100 mm anterior–posterior) with 24 × 24 phase-encoding steps and a 210 mm2 field of view (FOV) angulated along the long axis of the hippocampus, covering both hippocampi. Hippocampal voxels were selected on the T1-weighted FLASH image and their position in the hippocampus indicated with a number ranging from 1 for the most anterior in the head to 6, or if appropriate, 7 for the most posterior voxels in the tail (cf. Fig. 1). Only spectra containing ≥12% hippocampus and with clearly resolved peaks of NAA, Cr, Cho, and MI and without baseline distortion due to insufficient water suppression or lipid contamination were chosen for analysis. With these criteria, ~50% of the voxels were rejected, most commonly from the anterior hippocampus (positions 1–3). Metabolite concentrations were corrected for CSF contribution and expressed in arbitrary units.
FIG. 1.
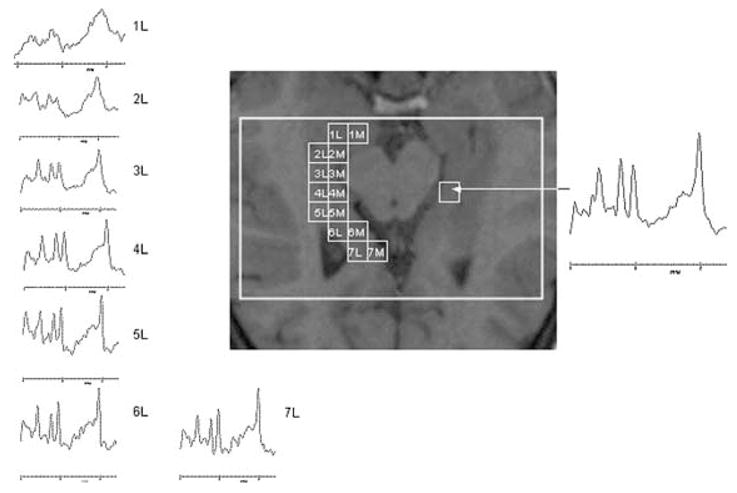
Patient with temporal lobe epilepsy and mesial temporal sclerosis (TLE-MTS) with focus in the left hippocampal formation. The squares indicate the position of the voxels that had to fulfill the quality criteria (see text) and to contain ≥12% hippocampus to be included in the analysis. The number indicates the position, with 1 as the most anterior voxel in the head, and 6, the most posterior voxel in the tail of the hippocampus. M, medial hippocampus; L, lateral hippocampus. Spectra from all positions of the lateral row are displayed to demonstrate spectral quality.
Statistical analysis was done with two-tailed t tests, and correction for multiple comparisons (cmc) was done with Holm’s test. After exclusion of statistically significant right–left differences in the control group (p > 0.05), metabolite concentrations from both sides were averaged for comparisons with patient groups.
RESULTS
Table 1 displays the metabolite concentrations in TLE-MTS, TLE-No, and controls.
TABLE 1.
Mean and SD of hippocampal metabolite concentrations
| TLE-MTS |
TLE-no |
Controls |
|||||
|---|---|---|---|---|---|---|---|
| Ipsi | Contra | Ipsi | Contra | Left | Right | ||
| No. of voxels ant: 29 | No. of voxels ant: 32 | No. of voxels ant: 15 | No. of voxels ant: 13 | No. of voxels ant: 31 | No. of voxels ant: 27 | ||
| Metabolite | Region | No. of voxels post: 29 | No. of voxels post: 48 | No. of voxels post: 24 | No. of voxels post: 25 | No. of voxels post: 73 | No. of voxels post: 76 |
| NAA | Ant | 5.9 ± 1.1ab | 6.6 ± 1.2 | 6.6 ± 1.2 | 6.8 ± 0.9 | 6.9 ± 1.2 | 7.2 ± 1.2 |
| Post | 6.9 ± 1.5bc | 7.4 ± 0.8bc | 7.7 ± 1.6c | 8.1 ± 1.2c | 8.4 ± 1.1c | 8.2 ± 1.3c | |
| Cr | Ant | 4.7 ± 0.8 | 5.1 ± 0.8 | 5.5 ± 0.7 | 5.9 ± 1.0 | 5.3 ± 0.8 | 4.9 ± 0.7 |
| Post | 5.5 ± 0.8c | 5.8 ± 0.9c | 6.2 ± 1.0c | 6.5 ± 0.9 | 5.9 ± 0.5 | 5.8 ± 0.6c | |
| Cho | Ant | 1.5 ± 0.2 | 1.4 ± 0.3 | 1.3 ± 0.2 | 1.5 ± 0.1 | 1.5 ± 0.3 | 1.4 ± 0.2 |
| Post | 1.6 ± 0.3 | 1.5 ± 0.2 | 1.5 ± 0.3c | 1.5 ± 0.3 | 1.6 ± 0.2 | 1.6 ± 0.3c | |
| MI | Ant | 4.2 ± 1.1b | 4.8 ± 0.8 | 5.6 ± 1.0 | 5.2 ± 1.5 | 5.2 ± 0.5 | 5.1 ± 0.6 |
| Post | 5.0 ± 1.1c | 5.2 ± 1.0c | 5.0 ± 1.1 | 5.7 ± 0.9 | 5.2 ± 0.7 | 5.5 ± 0.8c | |
Only voxels fulfilling the quality criteria (see text) were included.
NAA, N-acetylasparate; Cr, creatine/phosphocreatine; Cho, choline compounds; MI, myoinositol; ant, anterior, i.e., voxels from position 1–4; post, posterior, i.e., voxels from position 5–7; lpsi, ipsilateral; contra, contralateral.
Concentrations are given in arbitrary units.
p < 0.05 compared with contralateral.
p < 0.05 compared with controls.
p < 0.05 compared with anterior voxels.
In TLE-MTS, NAA was decreased in the ipsilateral anterior hippocampus compared with the contralateral anterior hippocampus (p = 0.03; not significant after cmc) and with the anterior hippocampus of controls (p = 0.007). Furthermore, NAA was decreased in the ipsi- and contralateral posterior hippocampus compared with the posterior hippocampus of controls (ipsilateral, p = 0.005; contralateral, p = 0.008). MI was decreased in the ipsilateral anterior hippocampus compared with controls (p = 0.012). Cr and Cho did not show side differences nor were they different from the concentrations found in controls. In TLE-No, none of those metabolites showed side differences or was different from controls. The presence of an anterior–posterior gradient for NAA was seen in all three groups, as previously described (2). The other metabolites showed similar, although not always significant, anterior–posterior gradients in all three groups.
Lateralization of the epileptogenic focus in individual subjects was done in two ways (cf. Table 2): (a) by “forced lateralization” (i.e., by defining the hippocampus with the lower NAA or MI as epileptogenic); and (b) by pathological side (i.e., by considering a NAA or MI value >2 SDs below the mean of controls as abnormal). Three TLE-MTS had evidence for bilateral hippocampal damage: two had bilateral abnormal NAA, and one had bilateral abnormal MI.
TABLE 2.
Percentage of patients with lateralization of the epileptogenic hippocampus concordant with EEG
| Forced lateralization |
Pathologic side |
||||
|---|---|---|---|---|---|
| Group | Position | NAA: c/d | MI: c/d | NAA: c/d/n | MI: c/d/n |
| TLE-MTS | |||||
| Ant (11) | 82%/18% | 82%/18% | 18%/0/82% | 23%/22%/56% | |
| Post (15) | 73%/27% | 47%/53% | 9%/0/91% | 7%/0/93% | |
| All (16) | 75%/25% | 63%/17% | 19%/0/81% | 13%/13%/74% | |
| TLE-No | |||||
| Ant (5) | 80%/20% | 40%/60% | 20%/0/80% | 20%/20%/60 | |
| Post (8) | 50%/50% | 63%/37% | 13%/0/77% | 25%/0/75% | |
| All (8) | 63%/37% | 50%/50% | 13%/0/77% | 25%/0/75% | |
Forced lateralization, hippocampus with lower NAA or MI is defined as epileptogenic; Pathologic side, hippocampus with NAA or MI 2 SD below mean control NAA is defined as epileptogenic; ant, anterior, i.e., average of voxels from position 1–4; post, posterior, i.e., average of voxels from position 5–7; all, average of all voxels with good quality of a subject from one side; c, concordant to EEG lateralization; d, discordant to EEG; n, nonlateralizing NAA in both sides (no. of patients with voxels fulfilling the quality criteria on both sides).
DISCUSSION
The first major finding of this study was that short-TE MRSI using “forced lateralization by NAA” identified the epileptogenic hippocampus correctly in 82% of TLE-MTS and in 80% of TLE-No. This is in good agreement with previous studies using longer TE (2–4). However, contrary to those (3,4), the ipsilateral NAA in this study was in the control range in 75% of the patients. Because the most prominent metabolic abnormalities were previously found in the anterior hippocampus, this is most probably a consequence of the loss of a high percentage of voxels in this region because of susceptibility artifacts. The loss of information from the head of the hippocampus also explains the anterior–posterior gradients of Cr and Cho in this study, which contrast with the posterior–anterior gradients found in a previous study of our laboratory (2). Using a separate PRESS volume for each temporal lobe improves the B0 homogeneity and thus spectral quality in the anterior hippocampus (5). Consequently, a recent short-TE MRSI study using this technique had findings comparable to those of long-TE studies regarding lateralization and anterior–posterior metabolite gradients (6). However, using a similar bihemispheric PRESS protocol would have prolonged the acquisition time by at least 20 min. This was not an option for our study, because hippocampal spectroscopic measurements are only part of a 90-min MR protocol used in the epilepsy project of our laboratory.
The second major finding was that MI in TLE-MTS was decreased in the ipsilateral anterior hippocampus compared with controls but not compared with the contralateral hippocampus. In TLE-No, MI was not different from controls. Lateralization by decreased MI was less often concordant with the EEG lateralization than was lateralization by decreased NAA. The ipsilateral decreased MI contrasts with three previous studies that found MI in TLE-MTS to be normal (6,7) or elevated (8).
It has been proposed that MI is located predominantly in glial cells, where it may exist in at least two different intracellular compartments: (a) a large, slowly exchanging compartment that is membrane associated and has been proposed to participate in intracellular signaling via the phosphatidyl inositide second messenger system (9); and (b) a smaller, faster-exchanging compartment that probably serves osmoregulatory functions (9). Seizures and antiepileptic drugs (AEDs) might affect both compartments in several complex ways. Whereas, for example, seizures may induce an increase of MI in the osmoregulatory compartment by an upregulation of the Na+/MI−cotransporter (10), they also might in the short and long terms activate the phosphatidyl inositide second messenger system, leading to a depletion of MI in this compartment (11,12). The MI depletion may eventually be further enhanced by AEDs (13,14). Therefore, the divergent findings regarding hippocampal MI in the four studies might be explained by differences of type and frequency of seizures and AEDs between the populations studied. More information about how MI is influenced by these factors is needed to determine its value for focus lateralization.
In addition to MI, short-TE spectra have a broad component in the region of 2.1–2.5 ppm usually referred as “Glnx,” consisting of at 1.5-T unresolved resonances of glutamate, glutamine, and γ-aminobutyric acid (GABA). This broad component has been determined in other studies (6,7,15) and found to be altered in TLE. We did not attempt to quantify “Glnx” in our study because it also has contributions from a macromolecule resonance in this region of the spectrum, making quantification difficult and unreliable.
In conclusion, hippocampal short-TE MRSI has the same accuracy for the lateralization of the epileptogenic hippocampus as does hippocampal long TE. However, without a time-demanding acquisition technique, it is more affected by artifacts leading to loss of information from the most prominently affected region of the hippocampus in mTLE. MI might eventually be helpful for focus lateralization, but more information is needed about the factors influencing its concentration in mTLE.
Acknowledgments
The study was supported by NIH grant R01-NS31966 S.G.M. was supported by a grant from the Swiss National Science Foundation.
References
- 1.Tanabe JL, Amend D, Schuff N, et al. Tissue segmentation of the brain in Alzheimer disease. AJNR Am J Neuroradiol. 1997;18:115–23. [PMC free article] [PubMed] [Google Scholar]
- 2.Vermathen P, Laxer KD, Matson GB, et al. Hippocampal structures: anteroposterior N-acetylaspartate differences in patients with epilepsy and control subjects as shown with proton MR spectroscopic imaging. Radiology. 2000;214:403–10. doi: 10.1148/radiology.214.2.r00fe43403. [DOI] [PubMed] [Google Scholar]
- 3.Ende GR, Laxer KD, Knowlton RC, et al. Temporal lobe epilepsy: bilateral hippocampal metabolite changes revealed at proton MR spectroscopic imaging. Radiology. 1997;202:809–17. doi: 10.1148/radiology.202.3.9051038. [DOI] [PMC free article] [PubMed] [Google Scholar]
- 4.Kuzniecky R, Hugg JW, Hetherington H, et al. Relative utility of 1H spectroscopic imaging and hippocampal volumetry in the lateralization of mesial temporal lobe epilepsy. Neurology. 1998;51:66–71. doi: 10.1212/wnl.51.1.66. [DOI] [PubMed] [Google Scholar]
- 5.McLean MA, Woermann FG, Simister RJ, et al. In vivo short echo time 1H-magnetic resonance spectroscopic imaging (MRSI) of the temporal lobes. Neuroimage. 2001;14:501–9. doi: 10.1006/nimg.2001.0827. [DOI] [PubMed] [Google Scholar]
- 6.Simister RJ, Woermann FG, McLean MA, et al. A short-echo-time proton magnetic resonance spectroscopic imaging study of temporal lobe epilepsy. Epilepsia. 2002;43:1021–31. doi: 10.1046/j.1528-1157.2002.50701.x. [DOI] [PubMed] [Google Scholar]
- 7.Woermann FG, Mc Lean MA, Bartlett PA, et al. Short echo time single-voxel 1H-magnetic resonance spectroscopy in magnetic resonance imaging: negative temporal lobe epilepsy: different biochemical profile compared with hippocampal sclerosis. Ann Neurol. 1999;45:369–76. doi: 10.1002/1531-8249(199903)45:3<369::aid-ana13>3.0.co;2-q. [DOI] [PubMed] [Google Scholar]
- 8.Wellard RM, Briellmann RS, Syngeniotis A, et al. Frontal lobe my-oinositol abnormalities in temporal lobe epilepsy. Proc Int Soc Mag Reson Med. 2002;10:415. (abstract) [Google Scholar]
- 9.Wolfson M, Bersudsky Y, Hertz E, et al. A model of inositol compartmentation in astrocytes based upon efflux kinetics and slow inositol depletion after uptake inhibition. Neurochem Res. 2000;25:977–82. doi: 10.1023/a:1007556509371. [DOI] [PubMed] [Google Scholar]
- 10.Nonaka M, Komura E, Yamashita T, et al. Kainic acid induced seizure upregulates Na+/myo-inositol cotransporter mRNA in rat brain. Mol Brain Res. 1999;70:179–86. doi: 10.1016/s0169-328x(99)00127-8. [DOI] [PubMed] [Google Scholar]
- 11.Carmant L, Liu Z, Werner SJ, et al. Effect of kainic acid induced status epilepticus on inositol-triphosphate and seizure induced brain damage in mature and immature animals. Dev Brain Res. 1995;89:67–72. doi: 10.1016/0165-3806(95)00110-y. [DOI] [PubMed] [Google Scholar]
- 12.Hirvonen MR, Paljarvi L, Savolainen KM. Sustained effects of pilocarpine-induced convulsions on brain inositol and inositol monophosphate levels and brain morphology in young and old male rats. Toxicol Appl Pharmacol. 1993;122:290–9. doi: 10.1006/taap.1993.1198. [DOI] [PubMed] [Google Scholar]
- 13.Van Calker D, Belmaker RH. The affinity inositol transport system: implication for the pathophysiology and treatment of bipolar disorders. Bipolar Disord. 2000;2:102–7. doi: 10.1034/j.1399-5618.2000.020203.x. [DOI] [PubMed] [Google Scholar]
- 14.Vadnal R, Parthasarathy R. Myo-inositol monophosphatase: diverse effects of lithium, carbamazepine and valproate. Neuropsychopharmacology. 1995;12:277–85. doi: 10.1016/0893-133X(94)00088-H. [DOI] [PubMed] [Google Scholar]
- 15.Savic I, Thomas AE, Ke Y, et al. In vivo measurements of glutamine + glutamate (Glnx) and N-acetyl aspartate (NAA) levels in human partial epilepsy. Acta Neurol Scand. 2000;102:179–88. doi: 10.1034/j.1600-0404.2000.102003179.x. [DOI] [PubMed] [Google Scholar]