

Abstract
Objective
To test the hypothesis that an abnormality in glycogen synthase kinase-3 (GSK3) is a pathogenic factor in PCOS.
Design
Prospective experimental study (adipocytes).
Setting
Tertiary care academic medical center and teaching hospital
Patients
Patients with PCOS and healthy controls.
Interventions
Blood sampling, physical exam, biopsy of subcutaneous lower abdominal fat.
Main Outcome Measure(s)
Glucose transport and protein levels and phosphorylation state of GSK3α and GSK3β in adipocytes, assessment of GSK3β activity.
Results
Basal protein levels of glycogen synthase kinase (GSK3α and GSK3β) did not differ between controls and women with PCOS, nor did basal or insulin-stimulated levels of serine phosphorylated GSK3α. However, in adipocytes of PCOS women insulin stimulation was not associated with increased serine phosphorylation of GSK3β, in contrast to controls. Tyrosine phosphorylation of GSK3β was also higher in PCOS compared to controls. Consistent with the phosphorylation data, GSK3β activity was elevated in PCOS adipocytes.
Conclusions
These data suggest GSK3β is hyperactivated and resistant to downregulation by insulin in PCOS. Using physiologic approaches, we demonstrated that abnormal GSK3β regulation is a potential mechanism for the insulin resistance seen in some women with PCOS, which may contribute to their development of the syndrome.
Keywords: glycogen synthase kinase, polycystic ovary syndrome, phosphorylation, insulin resistance
INTRODUCTION
Polycystic ovary syndrome (PCOS) affects ~6.5% of reproductive-aged women (1-3). Because most affected women have impaired insulin action and hyperinsulinism (4-7), and treatment with insulin sensitizers ameliorates features of the syndrome (8), it is possible that insulin resistance is an inciting event leading to PCOS (9).
Utilizing adipocytes, we have examined components of the insulin-signaling pathway in PCOS. Insulin receptor activation leads to phosphorylation of insulin receptor substrates 1 and 2 (IRS-1 and IRS-2) (10). Phosphorylated IRS proteins activate the phosphatidylinositol-3 kinase (PI3-kinase) cascade, the main pathway involved in glucose transport and glycogen synthesis (11). PI3-kinase generates phosphatidylinositol-(3,4,5)-trisphosphate (PIP3). PIP3 activates 3-phosphoinositide-dependent protein kinase 1 (PDK1), which then activates protein kinase B (PKB/Akt). Glycogen synthase (GS) activity is constitutively inhibited by phosphorylation by glycogen synthase kinase-3 (GSK3). When activated by the insulin-signaling cascade, PKB serine phosphorylates GSK3, inactivating GSK3 and allowing GS activity to increase. Insulin-stimulated glycogen synthesis may be impaired in PCOS (12, 13). In addition to its role in glycogen synthesis, GSK3 may inhibit insulin signaling in general by inducing serine phosphorylation of insulin receptor substrate-1 (IRS-1) (14).
This study sought to determine whether physiologic abnormalities of GSK3 play a role in PCOS. We demonstrated reduced insulin-stimulated glucose uptake in PCOS adipocytes compared to controls. PCOS adipocytes displayed higher tyrosine phosphorylation and lower insulin-stimulated serine phosphorylation of GSK3β, suggesting GSK3β overactivity. We then confirmed this by demonstrating elevated GSK3 activity in PCOS adipocytes. These data implicate GSK3 hyperactivity in the pathogenesis of PCOS.
MATERIALS AND METHODS
Subjects
Twenty PCOS patients were recruited from the Centers for Reproductive Medicine and for Androgen-Related Disorders at CSMC. Twenty-one healthy women were recruited as controls. All of these women had normal glucose tolerance according to World Health Organization criteria (15). Due to variation in amount of adipose tissue isolated from each subject, not all subjects contributed to each of the three experiments (glucose transport, GSK3 phosphorylation, GSK3 activity) outlined below.
Subjects underwent a history and physical examination, and basal blood sampling for the purpose of diagnosing PCOS. None had used hormonal preparations, including oral contraceptives, for at least three months preceding the study, and none were pregnant. Subjects gave written informed consent, according to the guidelines of the Institutional Review Board of Cedars-Sinai Medical Center (CSMC).
The presence of PCOS was defined by the 1990 NIH consensus criteria (16), specifically: (i) clinical evidence of hyperandrogenism and/or hyperandrogenemia, (ii) oligo-ovulation, and (iii) the exclusion of related disorders, including androgen-producing tumors, nonclassic 21-hydroxylase-deficient adrenal hyperplasia, hyperprolactinemia, active thyroid disease, or Cushing’s syndrome. Criteria for defining hirsutism, hyperandrogenemia, ovulatory dysfunction, and exclusion of related disorders were previously reported (1). Of the PCOS women, 30% were of normal weight [BMI < 25 kg/m2], 45% were overweight [BMI 25-29 kg/m2], and 25% were obese [BMI > 30 kg/m2]
Controls were healthy women (26% normal weight, 32% overweight, 42% obese; weight distribution not significantly different from PCOS women), with regular menstrual cycles or a history of regular menstrual cycles before menopause, and no evidence of hirsutism, acne, alopecia, endocrine dysfunction, or family history of hirsutism. History and physical exam (including hirsutism scoring) were used to determine control status; endocrinological studies were generally not performed. Controls responded to posted advertisements, and primarily did not include women affiliated with the clinic.
Adipocyte Studies
Obtaining subcutaneous suprapubic fat
Adipose tissue was obtained from the suprapubic lower abdominal area either during scheduled surgery (for infertility or pelvic pain evaluation/treatment) or as a separate procedure for research. When performed separately, ~3 g of adipose tissue was obtained via a 1/2-inch suprapubic incision. Alternatively, the subcutaneous suprapubic adipose tissue specimen was obtained through an incision during scheduled surgery. Specimens were immediately transported to the laboratory in Hepes/Salts, 4% BSA, 2mM pyruvate, pH 7.4 Hepes/Salts buffer and finely minced. Collagenase was then added at a ratio of 3.5 mg/g of tissue, and this mixture was then incubated for 60 min at 37°C in a rotary shaking bath at 100 rpm for 1 hr. Subsequently, the cell suspension was filtered through pre-moistened 400-micron nylon mesh (Small Parts, Inc., Miami Lakes, FL), and the cells washed twice for 2 min at 50xg at room temperature (RT). After the second wash the cells were re-filtered through nylon mesh. The cells were then ready for experimentation.
Insulin stimulated 3-O-methyl glucose uptake
The isolated cells were diluted 1:2 in buffer (Hepes/Salts, 4% BSA, 2mM pyruvate, pH 7.4), and stimulated with insulin for 60 minutes at various concentrations (0-100 mcg/ml) to obtain a concentration-response curve. The 60 minute duration for glucose uptake has been utilized by others (17). Twenty μl labeled substrate (3-O-methyl[3H]-D-glucose) was placed in 3 ml polypropylene tubes in a 37°C water bath; 100 μl of the cell suspensions was then added directly to each tube, and the reaction stopped after 30 sec by adding 200 μl phloretin working solution (137 mg phloretin, 500 μl DMSO, 1160 μl absolute EtOH diluted 1:500 with PBS). Four hundred μl of stopped reaction was placed on top of a 100 μl layer of silicon oil in 440 μl polypropylene tubes, and spun at max rpm for 30 sec. The top layer of the tubes containing the cells was cut off, and the remaining portion containing the oil and buffer placed in scintillation vials with 5 ml of universal LSC cocktail (Sigma-Aldrich Corp., St. Louis, MO) for counting. The results were normalized for cell counts by taking 50 μl of cell suspension from each tube, fixing the adipocyte cells in a 2% osmium/collidine solution, and counting them with a hemacytometer to obtain specific cell counts for normalization of results from each tube.
Adipocyte protein isolation, handling and storage
Cells were resuspended in buffer (Hepes/Salts, 4% BSA, pH 7.4), and divided into aliquots. Cells to be stimulated for Western blot analysis were incubated with insulin (300 mcg/ml) for 15 min at 37°C. Untreated cells were placed in buffer without insulin. Cell suspensions were transferred to 15 ml conical centrifuge tubes, washed twice with 4% BSA, Hepes/Salts solution, and then concentrated to a volume of 0.5 ml. Equal volumes of 2X lysis buffer (20mM Tris-HCl, 145 mM NaCl, 10% Glycerol, 5 mM EDTA, 1% Triton X-100, 0.5% NP-40) plus fresh protease inhibitors (200 μM PMSF, 200 μM NaVO4, 1 μM leupeptin, 10 mg/ml aprotinin) were added to each tube. This cell/buffer mixture was solubilized for 30 min at -20°C and vortexed every 10 min during a 30 min period at RT. The tubes were then spun at 3000 rpm for 5 min at 4°C, and the protein extract was removed and transferred to new 15 ml conical tubes for centrifugation at 2000 rpm for 5 min at 4°C. The extract was collected, placed in microfuge tubes, and protein concentrations determined by the Bradford assay (BioRad, Hercules, CA). The extracts were then stored at –70°C until analysis.
Western blotting
Twenty-five μg of denatured protein was run on 4% stacking and 10% separating acrylamide gels in 1X running buffer (24.8 mM Tris base, 19.18 mM Glycine, 3.5 mM SDS). The protein in the gels was transferred to nitrocellulose membranes at 100 V for 45 min at 4°C in 1X transfer buffer (25mM Tris base, 192 mM Glycine, 20% MeOH, 0.01% SDS). Once transfer was completed the membranes were stained with Ponceau_S (Sigma) to confirm protein equivalency and completeness of transfer. Membranes containing the transferred protein were blocked for 1 hr at RT or overnight at 4°C with 5% non-fat dry milk diluted with 1X TBST (25mM Tris-Cl, 125mM NaCl, 0.1% Tween 20). GSK3 and phospho-GSK3 antibodies (diluted 1:100) and the β-actin antibody (diluted 1:400) were purchased from Santa Cruz Biotechnology, Inc., Santa Cruz, CA. The three phospho-GSK3 antibodies were isoform- and residue-specific (to GSK3α phospho-Ser 21, GSK3β phospho-Ser 9, GSK3β phospho-Tyr 216; catalog numbers sc-16308, sc-11757, sc-11758, respectively). Triplicate parallel blots were used for quantitation of the three phospho-isoforms. A single GSK3 antibody (sc-7291) was used to quantify total GSK3α and GSK3β, after first resolving them by electrophoresis. Membranes were incubated with the primary antibody in 3% non-fat dry milk for 1 hour at room temperature followed by a horseradish peroxidase secondary antibody (Santa Cruz Biotechnology) at a dilution factor of 1:2000 in 5% non-fat dry milk for 1 hour at room temperature. Membranes were visualized using ECL detection reagents (Amersham Biosciences, Piscataway, NJ) followed by exposure to BioMax LIGHT film (Kodak, New Haven, CT). For total proteins; band intensities were quantified using IMAGE J (NIH) software and normalized to the band intensity of β-actin on the same blot. For phosphorylated proteins band intensities were again quantitated using the IMAGEJ software and normalized to the band intensity of their corresponding total protein on the same blot.
GSK3β kinase activity assay
GSK3α and GSKβ perform the same enzymatic activity: the transfer of the γ-phosphate from ATP to either a serine or threonine residue on GS. Phospho-glycogen synthase peptide-2 (PGS-2) is a synthetic peptide substrate for GSK3 that was synthesized and patterned after GS phosphorylation sites (18). 250 μg of protein extract was pre-cleared by incubating at 4°C with 20μl of protein with A-agarose beads for 30 minutes. After centrifugation, the supernatant was incubated at 4°C with 1μg of GSK3β antibody (BD Biosciences) for 1.5 hours, then 40 μl of protein A-agarose beads was added and the mixture was incubated for an additional hour. The beads were washed three times with lysis buffer, then twice with 1X GSK3β kinase assay buffer (50 mM Tri-HCl pH 7.5, 1mM EGTA, 1mM EDTA, 150mM NaCl, 10 mM Na-pyrophosphate, 5mM β-glycerophosphate, 50mM NaF, 1% Triton X100). After removal of the final wash, 8 μl of 312.5 μM phospho-glucogen synthase peptide-2 (Upstate Biotech) was added to each tube. 8μl of a [γ-32P] ATP/MgCl2 (500 μM non-radioactive ATP, 50 mM MgCl2, 25μl hot ATP) solution was added to the tubes. This mixture was incubated for 12 minutes @ 32°C. After incubation, the supernatant from each tube was pipetted to phosphocellulose paper disks (Whatman P81, 2.5 cm disks) in 15 μl aliquots. The Whatman disks were allowed to dry for 5 min. The dried disks were transferred to a corresponding scintillation vial with 5 ml of universal LSC cocktail (Sigma) for counting. A 1μl aliquot of the hot ATP mix previously mentioned was added to a scintillation vial to be used as the total count for the experiment.
Statistical Analysis
ANOVA followed by post hoc pairwise comparisons using the SAS program (SAS Institute, Inc., Cary, NC) were used to compare the glucose transport levels; the Mann-Whitney U test and ANCOVA were used to compare the basal protein levels of GSK3α and GSK3β, and the pre- and post-insulin levels and percent change of phosphorylated GSK3α and GSK3β between subjects with and without PCOS. The Wilcoxon signed rank test was used to compare pre- and post-insulin levels within each subject group. The Mann-Whitney U test was also used to compare GSK3β activity levels between PCOS and controls. ANCOVA was used to adjust analyses for age and/or BMI by including these covariates as independent variables. Data are presented as median [interquartile range].
To achieve age-matching between subject groups, a few subjects at the extremes of age were not analyzed. In the glucose uptake experiment, the youngest control and the oldest control were dropped from analysis. In the GSK3 phosphorylation experiment, the two oldest controls were dropped from analyses; in the GSK3β activity experiment, the oldest control and the youngest PCOS subject were dropped.
RESULTS
Glucose transport, measured by 3-O-methyl glucose uptake, was determined in freshly prepared adipocytes of 6 PCOS and 4 control women, who were similar in BMI (27.9 [4.6] kg/m2 vs. 25.7 [5.5] kg/m2, P=0.52, resp.) and age (29.5 [15.0] yr vs. 37.5 [3.0] yr, P=0.29, resp.). Insulin-stimulated glucose transport was lower in PCOS adipocytes compared to controls (Figure 1).
Figure 1.
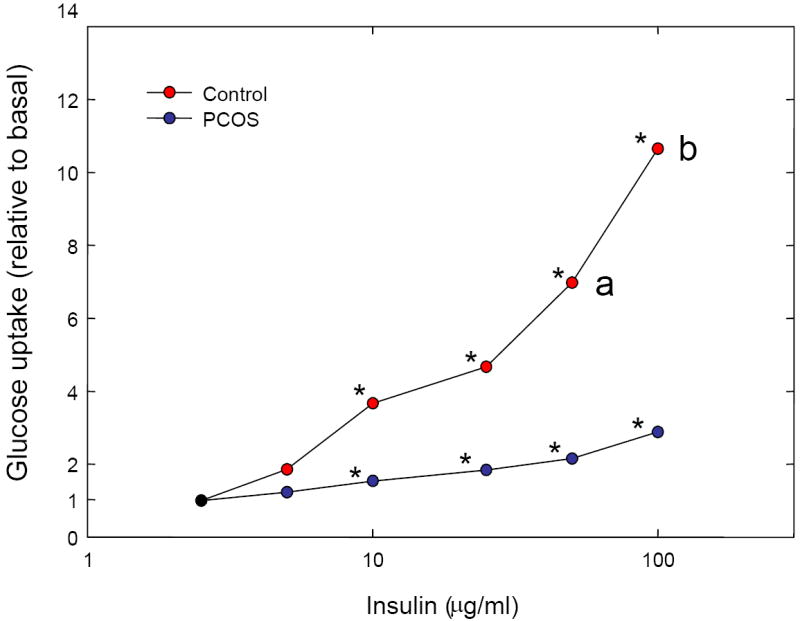
Glucose uptake in adipocytes from control women (black circles) and women with PCOS (white circles). 3-O-methyl glucose uptake was measured in freshly prepared adipocytes from 6 PCOS and 4 control subjects. Data are presented as the ratio of stimulated glucose uptake to the basal glucose uptake to control for individual subject variation in basal uptake. Asterisks denote significant increases within groups. a = P<0.05 vs. PCOS; b = P<0.01 vs. PCOS.
We analyzed the adipocyte protein extracts of a separate group of 9 PCOS and 6 control women. The women were similar in BMI (35.3 [8.2] kg/m2 vs. 27.3 [2.4] kg/m2, P=0.10, resp.); whereas these PCOS women were younger (29.0 [8.0] yr vs. 41.5 [4.0] yr, P=0.0022, resp.). Basal protein levels of GSK3α, GSK3β, phospho(Ser21)GSK3α, and phospho(Ser9)GSK3β were similar between PCOS and controls, as were insulin-stimulated levels and percent change of phospho(Ser21)GSK3α (Table 1, Figure 2A, Figure 2B). Basal and insulin-stimulated levels of tyrosine phosphorylated GSK3β were higher in PCOS than controls (Figure 2C), consistent with a more active GSK3β in the former. These differences remained significant in analyses adjusting for age and BMI. The percent change in GSK3β tyrosine phosphorylation was low (<10%) and similar in cases and controls. Alternatively, and in contrast to the controls, GSK3β serine phosphorylation in response to insulin did not change in PCOS (Figure 2B), suggestive of resistance to the effect of insulin to serine phosphorylate, and thus downregulate, GSK3β activity. The difference in the absolute levels of insulin-stimulated phospho(Ser9)GSK3β between control and PCOS did not reach statistical significance (P=0.077); however, the percent change was clearly different (2.4% increase in PCOS vs. 14% increase in controls, P=0.0015). In comparing insulin-stimulated phosphorylation within PCOS and controls separately, levels of all three phosphoproteins increased in controls, while in PCOS, only the small increase in tyrosine phosphorylation in response to insulin reached statistical significance.
Table 1.
Content and phosphorylation of selected insulin signaling components in PCOS and control women, at baseline and after insulin-stimulation
| PCOS (n=9) | Control (n=6) | P value: PCOS vs Control | P value: Baseline vs Ins-Stim: PCOS | P value: Baseline vs Ins-Stim: Control | |
|---|---|---|---|---|---|
| Baseline | |||||
| Total GSK3α | 1.33 [0.34] | 1.58 [0.48] | 0.91 | - | - |
| Total GSK3β | 1.33 [0.34] | 1.58 [0.48] | 0.91 | - | - |
| P-GSK3α (Ser21) | 1.57 [0.36] | 1.60 [0.91] | 0.81 | - | - |
| P-GSK3β (Ser9) | 1.07 [0.063] | 1.02 [0.059] | 0.26 | - | - |
| P-GSK3β (Tyr216) | 1.08 [0.14] | 0.59 [0.22] | 0.0015 | - | - |
| Insulin-Stimulated | |||||
| P-GSK3α (Ser21) | 1.64 [0.46] | 1.64 [0.79] | 0.86 | 0.058 | 0.028 |
| P-GSK3β (Ser9) | 1.09 [0.045] | 1.16 [0.060] | 0.077 | 0.51 | 0.028 |
| P-GSK3β (Tyr216) | 1.26 [0.23] | 0.70 [0.17] | 0.0015 | 0.0077 | 0.028 |
| % change P-GSK3α (Ser21) | 7.9 [15.0] | 3.0 [10.0] | 0.91 | - | - |
| % change P-GSK3β (Ser9) | 2.4 [5.3] | 14.0 [6.3] | 0.0015 | - | - |
| % change P-GSK3β (Tyr216) | 7.5 [13.0] | 8.4 [12.0] | 0.72 | - | - |
Data (normalized band intensity) are given as median [interquartile range]. Units are a dimensionless ratio of one band intensity to another band intensity. Comparisons were made with the Mann-Whitney U test (comparing PCOS versus controls) and Wilcoxon signed rank test (comparison of baseline to insulin stimulated values within groups).
Abbreviations: P- is phospho, Ser is serine, Tyr is tyrosine
Figure 2.

Assessment of GSK3 phosphorylation. A: Serine phosphorylation of GSK3α in response to insulin was significant in controls (blue bars) (P=0.028) but not in women with PCOS (red bars) (P=0.058). B: Serine phosphorylation of GSK3β in PCOS did not respond to insulin stimulation (P=0.51), whereas within controls insulin led to increased phosphorylation (P=0.028). C: Levels of tyrosine phosphorylated GSK3β were increased in PCOS, both at baseline and with insulin stimulation, compared to controls (P=0.0015). Levels of phosphoproteins are presented normalized to the expression levels of the corresponding total protein. Error bars indicate SE.
We assessed total GSK3β activity in adipocyte extracts from 9 women with PCOS and 9 controls. These women were comparable in age (30.0 [2.8] yr vs. 37.0 [7.3] yr, P=0.10, resp.) and BMI (35.3 [9.9] kg/m2 vs. 28.7 [7.8] kg/m2, P=0.35, resp.). Tissue from five of these women with PCOS and three of the controls had contributed to the GSK3 phosphorylation experiments above. GSK3β activity was higher in the adipocyte extracts from women with PCOS than the controls (0.89 [1.07] pmol/min vs. 0.22 [0.19] pmol/min, P=0.038, resp.). Although the groups were similar in BMI, we performed analysis with adjustment for BMI, given the importance of adiposity in metabolic signaling; the difference in GSK3β activity between women with PCOS and controls remained significant (P=0.037).
DISCUSSION
Our adipocyte data suggest intrinsic defects in GSK3β phosphorylation are present in PCOS. Specifically, in PCOS tyrosine phosphorylation of GSK3β (Tyr216) was enhanced, both at baseline and with insulin stimulation, and insulin-stimulated serine phosphorylation of GSK3α (Ser21) and especially GSK3β (Ser9) was defective (an example of insulin resistance at the molecular level). These phosphorylation data are consistent with a constitutively hyperactivated GSK3β that is resistant to suppression by insulin, a possible intrinsic (and likely genetic) defect in PCOS adipocytes. As predicted by the phosphorylation data, we demonstrated that GSK3β activity was elevated in PCOS adipocytes. Given that GSK3 inhibits GS, this data is consistent with other evidence demonstrating decreased glycogen synthesis in response to insulin in PCOS cultured ovarian granulosa cells (13) and skin fibroblasts (12).
The two isoforms of the serine/threonine kinase GSK3, GSK3α and GSK3β, are encoded by different genes. GSK3 is inhibited by phosphorylation of specific serine residues (Ser21 in GSK3α, Ser9 in GSK3β) by PKB/Akt. GSK3 activity is increased by tyrosine phosphorylation (Tyr279 in GSK3α, Tyr216 in GSK3β) by unknown kinases. We found no alterations in basal protein levels of either form of GSK3, and possible impairment of GSK3α serine phosphorylation in response to insulin in PCOS because the response to insulin was not significant (P=0.058), in contrast to the response in controls (P=0.028). More dramatically, in PCOS adipocytes insulin was not able to induce significant changes in Ser9 phosphorylation of GSK3β, suggesting resistance to the ability of insulin to downregulate this kinase. In addition, levels of tyrosine phosphorylation of GSK3β, basally and after insulin stimulation, were greater in PCOS compared to controls (but with no difference in percent change). These results are consistent with a hyperactivated, insulin-resistant GSK3β in PCOS. Our GSK3β activity assay confirmed what was predicted based on the phosphorylation data, that GSK3β enzymatic activity is increased in PCOS adipocytes compared to controls.
Elevated GSK3β activity may predispose to PCOS by promoting insulin resistance. GSK3 protein levels and activity are increased in muscle from subjects with type 2 diabetes and are inversely correlated with both GS activity and insulin-stimulated glucose uptake (19, 20). Treatment of both insulin-resistant rat and human muscle cells with specific GSK3 inhibitors can increase insulin-stimulated glycogen synthesis and glucose transport (21, 22). Transgenic mice with muscle-specific over-expression of human GSK3β developed glucose intolerance and hyperlipidemia, consistent with increased insulin resistance (23). One mechanism whereby GSK3β increases insulin resistance is by phosphorylating IRS-1 on Ser332, resulting in reduced tyrosine phosphorylation of IRS-1 by the insulin receptor and reduced signaling to downstream components (14). Our observation of elevated stimulatory tyrosine phosphorylation of GSK3β and unresponsiveness to insulin-stimulated serine phosphorylation is consistent with GSK3’s antagonism of insulin signaling and suggests a novel mechanism of insulin resistance in PCOS.
GSK3 may also influence PCOS by affecting androgen action. GSK3 influences diverse functions; over 40 proteins are phosphorylated by GSK3 (24). Given GSK3’s varied roles, the possibility that GSK3 also influences androgen secretion or action in PCOS would provide a unifying molecular mechanism behind insulin resistance and hyperandrogenism. In prostate cancer cell lines, GSK3 activity modulates androgen receptor function (25, 26). That the androgen receptor may be a substrate of GSK3 (27) raises the possibility that abnormal GSK3 activity in PCOS may promote hyperandrogenism. GSK3 may also promote androgen hypersecretion. In human ovarian theca cells, over-expression of GSK3β enhanced the 17-hydroxylase activity of P450c17; basal GSK3β activity was found to be increased in theca cells from PCOS women (28).
We have recently reported that haplotypes in the GSK3B gene are associated with altered frequency of PCOS. Specifically, within Black and White women, a particular common GSK3B haplotype was associated with increased frequency of PCOS (29). This suggests that the GSK3β hyperactivity demonstrated by the present physiologic studies may be genetically determined.
We are confident that the differences in GSK3 phosphorylation and activity observed between women with PCOS and controls were not a result of differences in adiposity, given that the groups were comparable in BMI for each analysis and that statistical adjustment for BMI did not affect the significance of the results. However, given the small sample sizes utilized in these experiments, we cannot definitively state that there was no age or BMI difference between the two groups in each case. An undetected difference in these parameters could influence the results we observed.
GSK3β may not be the only factor that is important in the insulin resistance of PCOS, given that many factors that are involved in the insulin-signaling cascade. One important lesson from this study is that the insulin-signaling cascade is a promising source of molecular candidates for PCOS. Only when all such factors are evaluated can their relative importance be judged.
In conclusion, our phosphorylation data was consistent with a constitutively hyperactivated GSK3β that is resistant to suppression by insulin signaling, and our GSK3β activity assays confirmed increased GSK3β activity in PCOS adipocytes. This GSK3β hyperactivity is a possible intrinsic (genetic) defect in PCOS adipocytes. The abnormality in GSK3β action has the potential of influencing both insulin resistance and androgen action, two important factors in PCOS, and would be exciting evidence of a single molecular defect underlying these two prevalent abnormalities. Further physiologic, molecular, and genetic studies of GSK3 in PCOS are warranted to confirm these findings.
Acknowledgments
We thank Drs. Joseph Messina and Robert Hardy for advice early in the project.
Support: Supported in part by NIH grants R03-HD42077, R01-HD29364, K24-HD01346-01, and M01-RR00425, and the Helping Hand of Los Angeles.
Footnotes
Conflict of interest: none
Presented at the 88th Annual Meeting of the Endocrine Society, Boston MA, June 24-27, 2006.
Publisher's Disclaimer: This is a PDF file of an unedited manuscript that has been accepted for publication. As a service to our customers we are providing this early version of the manuscript. The manuscript will undergo copyediting, typesetting, and review of the resulting proof before it is published in its final citable form. Please note that during the production process errors may be discovered which could affect the content, and all legal disclaimers that apply to the journal pertain.
References
- 1.Azziz R, Woods KS, Reyna R, Key TJ, Knochenhauer ES, Yildiz BO. The prevalence and features of the polycystic ovary syndrome in an unselected population. J Clin Endocrinol Metab. 2004;89:2745–9. doi: 10.1210/jc.2003-032046. [DOI] [PubMed] [Google Scholar]
- 2.Asuncion M, Calvo RM, San Millan JL, Sancho J, Avila S, Escobar-Morreale HF. A prospective study of the prevalence of the polycystic ovary syndrome in unselected Caucasian women from Spain. J Clin Endocrinol Metab. 2000;85:2434–8. doi: 10.1210/jcem.85.7.6682. [DOI] [PubMed] [Google Scholar]
- 3.Diamanti-Kandarakis E, Kouli CR, Bergiele AT, Filandra FA, Tsianateli TC, Spina GG, et al. A survey of the polycystic ovary syndrome in the Greek island of Lesbos: hormonal and metabolic profile. J Clin Endocrinol Metab. 1999;84:4006–11. doi: 10.1210/jcem.84.11.6148. [DOI] [PubMed] [Google Scholar]
- 4.Dunaif A, Segal KR, Futterweit W, Dobrjansky A. Profound peripheral insulin resistance, independent of obesity, in polycystic ovary syndrome. Diabetes. 1989;38:1165–74. doi: 10.2337/diab.38.9.1165. [DOI] [PubMed] [Google Scholar]
- 5.Legro RS, Kunselman AR, Dodson WC, Dunaif A. Prevalence and predictors of risk for type 2 diabetes mellitus and impaired glucose tolerance in polycystic ovary syndrome: a prospective, controlled study in 254 affected women. J Clin Endocrinol Metab. 1999;84:165–9. doi: 10.1210/jcem.84.1.5393. [DOI] [PubMed] [Google Scholar]
- 6.DeUgarte CM, Bartolucci AA, Azziz R. Prevalence of insulin resistance in the polycystic ovary syndrome using the homeostasis model assessment. Fertil Steril. 2005;83:1454–60. doi: 10.1016/j.fertnstert.2004.11.070. [DOI] [PubMed] [Google Scholar]
- 7.Carmina E, Lobo RA. Use of fasting blood to assess the prevalence of insulin resistance in women with polycystic ovary syndrome. Fertil Steril. 2004;82:661–5. doi: 10.1016/j.fertnstert.2004.01.041. [DOI] [PubMed] [Google Scholar]
- 8.Lord J, Wilkin T. Metformin in polycystic ovary syndrome. Curr Opin Obstet Gynecol. 2004;16:481–6. doi: 10.1097/00001703-200412000-00008. [DOI] [PubMed] [Google Scholar]
- 9.Goodarzi MO, Korenman SG. The importance of insulin resistance in polycystic ovary syndrome. Fertil Steril. 2003;80:255–8. doi: 10.1016/s0015-0282(03)00734-9. [DOI] [PubMed] [Google Scholar]
- 10.White MF. IRS proteins and the common path to diabetes. Am J Physiol Endocrinol Metab. 2002;283:E413–22. doi: 10.1152/ajpendo.00514.2001. [DOI] [PubMed] [Google Scholar]
- 11.Myers MG, Jr, Backer JM, Sun XJ, Shoelson S, Hu P, Schlessinger J, et al. IRS-1 activates phosphatidylinositol 3’-kinase by associating with src homology 2 domains of p85. Proc Natl Acad Sci U S A. 1992;89:10350–4. doi: 10.1073/pnas.89.21.10350. [DOI] [PMC free article] [PubMed] [Google Scholar]
- 12.Book CB, Dunaif A. Selective insulin resistance in the polycystic ovary syndrome. J Clin Endocrinol Metab. 1999;84:3110–6. doi: 10.1210/jcem.84.9.6010. [DOI] [PubMed] [Google Scholar]
- 13.Wu XK, Zhou SY, Liu JX, Pollanen P, Sallinen K, Makinen M, et al. Selective ovary resistance to insulin signaling in women with polycystic ovary syndrome. Fertil Steril. 2003;80:954–65. doi: 10.1016/s0015-0282(03)01007-0. [DOI] [PubMed] [Google Scholar]
- 14.Liberman Z, Eldar-Finkelman H. Serine 332 phosphorylation of insulin receptor substrate-1 by glycogen synthase kinase-3 attenuates insulin signaling. J Biol Chem. 2005;280:4422–8. doi: 10.1074/jbc.M410610200. [DOI] [PubMed] [Google Scholar]
- 15.Alberti KG, Zimmet PZ. Definition, diagnosis and classification of diabetes mellitus and its complications. Part 1: diagnosis and classification of diabetes mellitus provisional report of a WHO consultation. Diabet Med. 1998;15:539–53. doi: 10.1002/(SICI)1096-9136(199807)15:7<539::AID-DIA668>3.0.CO;2-S. [DOI] [PubMed] [Google Scholar]
- 16.Zawadzki JK, Dunaif A. Diagnostic criteria for polycystic ovary syndrome: towards a rational approach. In: Dunaif A, Givens JR, Haseltine F, Merriam GR, editors. Polycystic ovary syndrome. Cambridge: Blackwell Scientific Publications; 1992. pp. 377–84. [Google Scholar]
- 17.Ciaraldi TP, Morales AJ, Hickman MG, Odom-Ford R, Olefsky JM, Yen SS. Cellular insulin resistance in adipocytes from obese polycystic ovary syndrome subjects involves adenosine modulation of insulin sensitivity. J Clin Endocrinol Metab. 1997;82:1421–5. doi: 10.1210/jcem.82.5.3961. [DOI] [PubMed] [Google Scholar]
- 18.Woodgett JR. Use of peptide substrates for affinity purification of protein-serine kinases. Anal Biochem. 1989;180:237–41. doi: 10.1016/0003-2697(89)90423-5. [DOI] [PubMed] [Google Scholar]
- 19.Nikoulina SE, Ciaraldi TP, Mudaliar S, Mohideen P, Carter L, Henry RR. Potential role of glycogen synthase kinase-3 in skeletal muscle insulin resistance of type 2 diabetes. Diabetes. 2000;49:263–71. doi: 10.2337/diabetes.49.2.263. [DOI] [PubMed] [Google Scholar]
- 20.Eldar-Finkelman H. Glycogen synthase kinase 3: an emerging therapeutic target. Trends Mol Med. 2002;8:126–32. doi: 10.1016/s1471-4914(01)02266-3. [DOI] [PubMed] [Google Scholar]
- 21.Nikoulina SE, Ciaraldi TP, Mudaliar S, Carter L, Johnson K, Henry RR. Inhibition of glycogen synthase kinase 3 improves insulin action and glucose metabolism in human skeletal muscle. Diabetes. 2002;51:2190–8. doi: 10.2337/diabetes.51.7.2190. [DOI] [PubMed] [Google Scholar]
- 22.Henriksen EJ, Kinnick TR, Teachey MK, O’Keefe MP, Ring D, Johnson KW, et al. Modulation of muscle insulin resistance by selective inhibition of GSK-3 in Zucker diabetic fatty rats. Am J Physiol Endocrinol Metab. 2003;284:E892–900. doi: 10.1152/ajpendo.00346.2002. [DOI] [PubMed] [Google Scholar]
- 23.Pearce NJ, Arch JR, Clapham JC, Coghlan MP, Corcoran SL, Lister CA, et al. Development of glucose intolerance in male transgenic mice overexpressing human glycogen synthase kinase-3beta on a muscle-specific promoter. Metabolism. 2004;53:1322–30. doi: 10.1016/j.metabol.2004.05.008. [DOI] [PubMed] [Google Scholar]
- 24.Jope RS, Johnson GV. The glamour and gloom of glycogen synthase kinase-3. Trends Biochem Sci. 2004;29:95–102. doi: 10.1016/j.tibs.2003.12.004. [DOI] [PubMed] [Google Scholar]
- 25.Mazor M, Kawano Y, Zhu H, Waxman J, Kypta RM. Inhibition of glycogen synthase kinase-3 represses androgen receptor activity and prostate cancer cell growth. Oncogene. 2004;23:7882–92. doi: 10.1038/sj.onc.1208068. [DOI] [PubMed] [Google Scholar]
- 26.Liao X, Thrasher JB, Holzbeierlein J, Stanley S, Li B. Glycogen synthase kinase-3beta activity is required for androgen-stimulated gene expression in prostate cancer. Endocrinology. 2004;145:2941–9. doi: 10.1210/en.2003-1519. [DOI] [PubMed] [Google Scholar]
- 27.Wang L, Lin HK, Hu YC, Xie S, Yang L, Chang C. Suppression of androgen receptor-mediated transactivation and cell growth by the glycogen synthase kinase 3 beta in prostate cells. J Biol Chem. 2004;279:32444–52. doi: 10.1074/jbc.M313963200. [DOI] [PubMed] [Google Scholar]
- 28.Munir I, Geller DH, deBruin CE, Magoffin DA. Dysregulation of GSK3beta activity in polycystic ovarian syndrome (PCOS) theca: a mechanism to promote excessive androgen biosynthesis in PCOS. 88th Annual Meeting of the Endocrine Society; 2006; Boston, Massachusetts. 2006. [Google Scholar]
- 29.Goodarzi MO, Antoine HJ, Pall M, Cui J, Guo X, Azziz R. Preliminary evidence of glycogen synthase kinase 3 beta as a genetic determinant of polycystic ovary syndrome. Fertil Steril. 2007;87:1473–6. doi: 10.1016/j.fertnstert.2006.11.041. [DOI] [PMC free article] [PubMed] [Google Scholar]