Abstract
One of the cardinal pathologic features of Alzheimer’s disease (AD) is formation of senile, or amyloid, plaques. Transgenic mice have been developed that express one or more of the genes responsible for familial AD in humans. Doubly transgenic mice develop “human-like” plaques, providing a mechanism to study amyloid plaque biology in a controlled manner. Imaging of labeled plaques has been accomplished with other modalities, but only MRI has sufficient spatial and contrast resolution to visualize individual plaques non-invasively. Methods to optimize visualization of plaques in vivo in transgenic mice at 9.4 T using a spin echo sequence based on adiabatic pulses are described. Preliminary results indicate that a spin echo acquisition more accurately reflects plaque size, while a T2* weighted gradient echo sequence reflects plaque iron content not plaque size. In vivo MRI – ex vivo MRI – in vitro histological correlations are provided. Histologically verified plaques as small as 50 μm in diameter were visualized in the living animal. To our knowledge this work represents the first demonstration of non-invasive in vivo visualization of individual AD plaques without the use of a contrast agent.
Keywords: MR microscopy, Alzheimer’s Disease, Magnetic Resonance Imaging, Transgenic mice
Introduction
Alzheimer’s disease (AD) is a slowly progressive neurodegenerative disorder with an insidious clinical onset. Above 65 years of age, AD increases in incidence exponentially with age and is therefore poised to become a leading public health problem as the population ages (1). At this time, no diagnostic biomarker exists. The antemortem diagnosis as well as longitudinal assessment of disease progression are based on clinical and neuropsychometric measures (2). Due to the anticipated arrival of useful therapeutic interventions for AD, improved methods of diagnosis and measures of disease progression are needed (3).
Recent evidence in genetics and cell biology have led to general acceptance that the initiating event ultimately leading to clinical AD is disordered metabolism of amyloid in the brain (4). Amyloid precursor protein (APP) is a normal transmembrane protein found in cells throughout the body. Amyloid β peptide (Aβ) is one of the products of normal metabolic turnover of APP in the brain. Aβ is a major component of extracellular senile (or amyloid) plaques, and, aggregation of extracellular Aβ fragments are thought to be the initiating event in plaque formation. Soluble Aβ polymers are neurotoxic. While plaques themselves may or may not be directly neurotoxic, plaque burden is a measure of the antecedent biochemical events ultimately leading to clinical AD.
The three known types of mutations associated with early onset, familial AD all directly effect amyloid metabolism (4). Murine models of AD have been created by inserting one or more of these human mutations into the mouse genome (5, 6). These transgenic mice display extensive plaque formation, whereas plaques are not found in wild type mice. Amyloid reduction in humans has recently been identified as a major therapeutic objective (7). Alzheimer’s transgenic mice allow controlled study of this phenomenon and enable testing of anti-amyloid interventions that might be useful in humans.
Direct imaging of amyloid in the brain is feasible. Plaque binding scintigraphic probes label plaques in animal and human specimens in vitro, and in vivo in mice (8–11). Klunk et al (12) have successfully visualized plaque burden with positron emission tomography (PET) in living human Alzheimer’s patients using the “Pittsburgh-B” compound. Optical imaging of individual probe labeled plaques has also been demonstrated (13). Despite this success with other modalities, several groups have pursued imaging of amyloid plaques with MRI (14–19). A major motivation for this effort is that, unlike other modalities, MRI theoretically can resolve individual plaques noninvasively. Typical plaques in human AD subjects range from 2 μm to 200 μm in diameter which is beyond the spatial resolution of PET.
Beneviste et al (14) demonstrated individual plaques on in vitro human tissue slices using MR microscopy. This was accomplished at 7 T at a spatial resolution in the range of 40 μm × 40 μm × 40 μm (~ 6 × 10 −5 mm3). Plaques appeared dark on T2*-weighted images and this was attributed to the known presence of metals, particularly iron, in plaques. This finding was not replicated by Dhenian at 11.7 T (16). However, our group (15) and later Zhang et al (19) and Helpern et al (18), did demonstrate imaging of plaques in ex vivo transgenic mouse brain specimens at 7 T without administration of an exogenous contrast agent on T2 or T2*-weighted images, thus replicating the findings of Beneviste et al (14). We also demonstrated enhancement of plaques ex vivo both on T2 and T1-weighted images following intra-venous (IV) administration of a specifically designed molecular contrast agent (15). However, imaging times in these experiments ranged from 13–15 hours which is clearly unsuitable for in vivo imaging.
In this report, we discuss optimization of methods to visualize individual plaques in transgenic mice in vivo on T2-weighted images without the aid of an exogenous plaque specific contrast agent. Documentation is provided via three-way in vivo MRI - ex vivo MRI in vitro histological correlation.
Methods
Imaging Methods
Experiments were performed with a Unity Inova spectometer (Varian, Palo Alto, CA) which was interfaced to a 9.4 T/31 cm horizontal bore magnet equipped with actively-shielded gradients capable of 300 mT/m in a rise-time of 500 μs (Magnex Scientific, Abingdon, UK). RF transmission and reception was performed with a quadrature surface coil consisting of 1 cm diameter loops (Fig 1).
Figure 1. Coil and mouse holder apparatus.
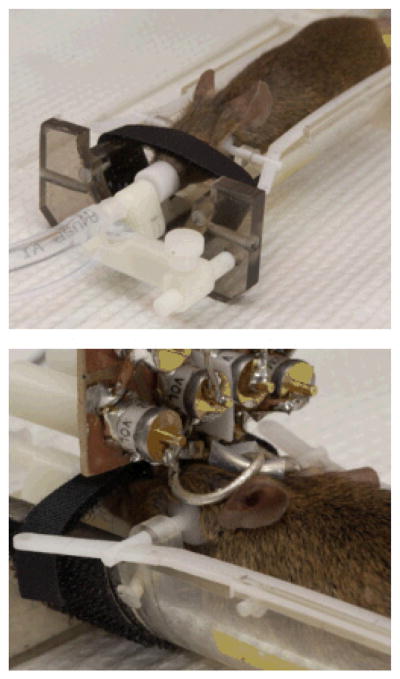
The top panel shows a mouse lying in the cradle from above. Its head is held in place with adjustable plastic side clamps and an adjustable incisor bar. The incisors are placed into a hole in the bar and the mouse is held in place with a Velcro strap positioned over the nose. The nose is inserted into a cone which supplies anesthesia gas and O2/N2O and also scavenges residual gas. The bottom panel is a view from behind the mouse’s head illustrating the surface coil in position.
We took a two stage approach to in vivo imaging of individual amyloid plaques. First, several decisions about basic imaging approaches were driven by a priori specifications. Remaining methodological decisions were then made empirically. The transgenic mice employed in our experiments were doubly transgenic for human APP and presenilin mutations (APP-PS1 mice) (6). As in affected humans, plaque number and mean plaque size increase with age in transgenic mice. In these mice, mean plaque sizes are 19 μm (4 μm min, 83 μm max) at age 12 months, and 26 μm (4 μm min, 109 μm max) by age 24 months (20). Given this constraint, we predetermined an in-plane resolution of 60 μm × 60 μm for our experiments. Through-plane resolution was determined empirically. We found older APP-PS1 transgenic mice to be somewhat physiologically fragile, and thus not able to withstand excessively long anesthesia sessions. We therefore targeted an image acquisition time of 1–2 hours maximum. This approach allowed us to perform several experiments per imaging session in a single animal, with an upper limit of roughly six hours of imaging/anesthesia time per session. Given competing constraints of high spatial resolution but limited imaging time, we adopted the strategy of limited-field-of-view (FOV) imaging. As will be discussed later, we pursued long TE spin echo rather than gradient echo sequences. A single echo sequence was used in order to avoid spatial resolution blurring arising from T2 decay during a multi-echo acquisition. We performed imaging in the coronal plane for two reasons. First, this orientation lends itself well to imaging with a surface coil which improves local signal-to-noise ratio (SNR) over volume coil acquisitions. Second, images are acquired in the same orientation in which typical histological sectioning is performed. In vivo and ex vivo MR images were reconstructed with zero padding in x and y, doubling the apparent resolution in plane.
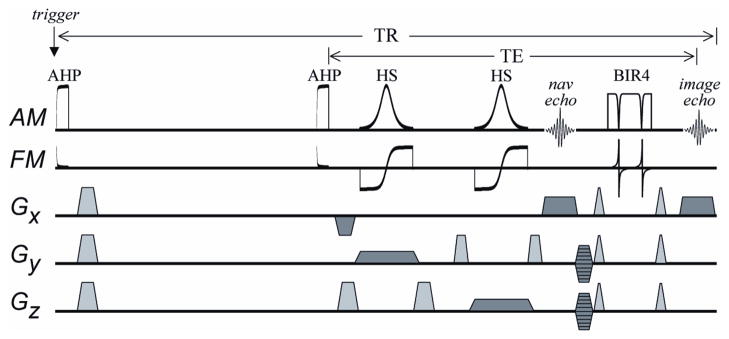
Remaining MRI acquisition parameters were determined empirically using in vivo transgenic and wild type mice, as well as ex vivo fixed brain specimens of transgenic mice. To reduce the FOV in the two phase-encoded directions, “zoom imaging” was performed using two frequency-selective 180° pulses (21). Flip-angle imperfections were minimized by employing only adiabatic pulses in the 3D imaging sequence (Fig. 2). Excitation was performed with an adiabatic half-passage (AHP), and non-selective refocusing was performed with a BIR4 pulse (22). The spatially-selective 180° pulses were based on the hyperbolic secant (HS) pulse (23). Acquisition bandwidth and TE were empirically adjusted to optimize SNR and contrast for plaque visualization using ex vivo fixed brain specimens from transgenic mice. Initial pulse sequence parameters were: TR= 2000 ms; TE=52 ms; bandwidth (BW) = 44 kHz; x, y, and z matrices of 256 × 64 × 32 with FOV of 15.36 mm in x and 3.84 mm in y. Accordingly, in-plane voxel dimensions were 60 μm × 60 μm. Through-plane resolution was optimized by assessing plaque conspicuity at varying z FOV corresponding to slice thicknesses ranging from 60 to 270 μm. We also compared the spin echo sequence outline above to a 3D gradient recalled T2* weighted sequence. The T2* weighted sequence parameters were, TR = 150 ms, TE = 16.4 ms, nominal flip angle = 15 degrees, BW = 60 kHz; x, y, and z matrices of 256 × 256 × 128 with FOV of 15.4 mm in all three dimensions. Accordingly, voxel dimensions were 60 μm × 60 μm in plane and 120 μm through-plane (identical to those of the spin echo sequence we ultimately employed). Whole brain coverage was achieved with the 3D gradient recalled T2* weighted sequence. Imaging time was 1 hr 7 minutes for the spin echo sequence and 1 hr 27 minutes for the T2* weighted gradient echo sequence.
Figure 2. Spin-echo 3D Imaging Sequence.
To confer insensitivity to view-to-view variations in Mz that result from inconsistent timing of the acquisition triggering, “trigger desensitizing” is performed. Trigger desensitizing is accomplished using an initial adiabatic half-passage (AHP) to prepare the magnetization in a consistent way (i.e., by nulling magnetization) immediately after the trigger. After a subsequent recovery period that remains constant, a second AHP is used to excite magnetization as the double spin-echo sequence begins. The FOV in the phase-encoded directions (y and z) is reduced using slice-selective 180° pulses of the hyperbolic secant (HS) type. The first echo, at 35 ms, is a non-phase encoded navigator echo. A BIR4 pulse is then used to generate a second echo at 52 ms which is phase encoded and used to reconstruct images. The lengths of the AHP, HS, and BIR4 pulses are 3, 2, and 2 ms, respectively. The bandwidth of the HS pulse is 10 kHz. The traces labeled AM and FM show the amplitude- and frequency-modulated functions of the adiabatic RF pulses, respectively. Gradient pulses used to spoil transverse magnetization are shown in gray. Gradient pulses used for 3D imaging are shown in dark gray.
Initial attempts at in vivo imaging using the spin echo sequence with parameters from the optimization experiments above revealed that a method of cardio-respiratory triggering of the sequence was necessary (24). Although it is possible to artificially ventilate mice and acquire data during fixed expiration, we elected not to pursue this approach. In addition to being technically challenging, the physiologic fragility of older AD transgenic mice was problematic. We therefore elected to perform imaging during free breathing. We employed an MR compatible physiologic monitoring device for these experiments (SA Instruments, Inc.). Electrocardiographic (ECG) monitoring was derived from disposable surface electrode pads placed on the shaved left fore limb and right hind limb (Nicolet Biomedical). Respiration was monitored using a pressure transducer placed under the mouse’s abdomen. Triggering signals were derived from the ECG and respiratory sensors. An MRI acquisition was triggered by the first QRS complex detected after expiration.
A custom made device was used to immobilize the head during imaging (Figure 1). Despite immobilization it is possible that heart and diaphragmatic motion do cause some subtle motion of the head during imaging. Perhaps more importantly, it is well established that movement outside the FOV may produce subtle changes in the B0 field. We considered the possibility that abdominal movement during respiration and perhaps cardiac movement as well may produce view to view phase jitter. Therefore, in addition to physiologic triggering, we evaluated two additional strategies to minimize view-to-view variation in signal amplitude and phase. The first strategy employed a “trigger desensitizing” spin echo pulse sequence (Figure 2) (25). Time varying inaccuracy in detection of respiratory and cardiac events occasionally led to significant view-to-view variation in effective TR. The resulting view-to-view variation in steady state magnetization leads to amplitude variation in k-space producing ghosting and blurring in the resultant images. Data acquisition can be made insensitive to this phenomenon by playing out a 90° “trigger desensitizing” pulse at the beginning of each sequence. The excitation pulse subsequently follows after an interval equal to the desired TR. With this approach, view-to-view longitudinal magnetization is held constant, despite view-to-view variation in the timing of the actual sequence triggering. In addition to this approach, we also evaluated the efficacy of navigator echoes to detect and correct for view-to-view phase variation in the spin echo sequence (Figure 2) (26). Navigator data were processed by applying a 1D Fourier transform along the read direction of the navigator echo. Both a pixel shift (δ) due to bulk motion and a DC phase term (θ) due to physiologic motion were determined. The pixel shift was determined by minimizing the squared difference of the magnitude signal relative to a reference frame. A magnitude weighted least squares fit of the phase term was used to determine the DC phase term. The correction to the sampled data becomes:
, where kx is the xth point in k-space.
Animal and Brain Tissue Handling
Experiments were performed using both APP-PS1 transgenic and B6SLJ wild type mice. Mice were anesthetized using 1.0% – 1.5% isoflurane and O2/N2O and positioned in a custom built cradle for imaging (Figure 1). The mouse was positioned in the holder with its abdomen/thorax on top of the respiration pressure transducer of the physiologic triggering device. Body temperature was monitored by a rectal probe and maintained with a hot water circulating system. Experimental protocols were approved by the Institutional Animal Care and Use Committees of both the University of Minnesota and Mayo Clinic in accordance with the NIH Guide for the Care and Use of Laboratory Animals.
Some animals were sacrificed to perform correlations with ex vivo MRI and in vitro histology. These animals were perfused with phosphate buffered saline and fixed with neutral buffered, 10% formalin following an overdose with sodium pentobarbital (200 mg/kg, IP). The brain was removed and fixed further in formalin over night and equilibrated in 0.1 M sodium phosphate, pH 7.4 for 24 hours. The brain was embedded vertically in 2% agar in a 15 mm outer diameter. glass tube for ex vivo MRI. For histological staining, the bottom of the glass MRI tube was cut off and the fixed mouse brain embedded in agar was extruded. The agar was cut away from the mouse brain. A 5 mm thick block of agar was left attached to the posterior portion of the brain as a base for mounting to the microtome platform in order to maintain the same orientation histologically as in the MRI scan. After cryoprotecting in 10% followed by 30% sucrose in 0.1 M phosphate, pH 7.4, frozen coronal sections (30 μm) were cut with a sliding microtome throughout the whole extent of the cerebral cortex. The sections were mounted on slides, dried, and then stained with fresh, filtered, aqueous 1% thioflavin S. The thioflavin S-positive beta-amyloid plaques were visualized with a florescence microscope using filters for fluorescein isothiocyanate (FITC). In order to visualize tissue iron, the Prussian Blue reaction was performed (27). Mounted 30 μm sections were reacted with equal parts of freshly made, aqueous 10% potassium ferrocyanide and 20% hydrochloric acid for 30 min. The sections were rinsed for five minutes in three changes of distilled water, cover-slipped, and then imaged without counterstaining.
Ex Vivo MRI and In Vitro Histological Correlation to In Vivo MRI
Correlating anatomic features between in vivo and ex vivo MR images of the same mouse was accomplished using an image analysis software package with a linked cursor system (28). The ex vivo MRI volume was spatially matched to the in vivo volume using common anatomic landmarks, for example the ventricles, corpus callosum, hippocampal fissure, etc. The ex vivo MRI volume was re-sampled in the space of the in vivo volume using a windowed sinc interpolation algorithm.
In order to correlate histological sections with MR images, images of the individual histological sections were combined to create a digitized 3D volume of the specimen. In order to match the through-plane resolution of the histological and MR images, appropriate multiples of the 30 μm histological sections were used. The digitized histological volume was then spatially matched to the ex vivo MRI volume using common anatomic landmarks as described above. A linked cursor system in the image analysis software program was then used to identify amyloid plaques common to the three spatially registered digitized datasets; in vivo MRI, ex vivo MRI, and in vitro histology.
Results
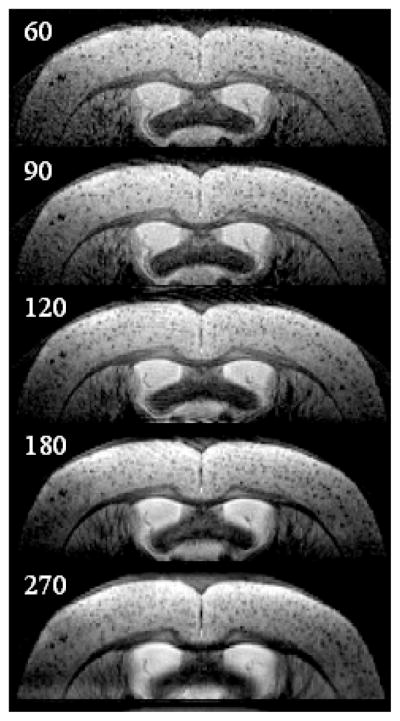
Variable slice thickness was evaluated with ex vivo MRI using a fixed transgenic mouse brain. In-plane resolution was held constant at 60 μm × 60 μm, through-plane resolutions were varied as follows; 60, 90, 120, 180, and 270 μm (Figure 3). Plaque sharpness seemed to fall off at through-plane resolutions greater than 120 μm. While plaques were best resolved with a through plane resolution of 60 μm, SNR was problematic in vivo at this resolution. We selected a through-plane resolution of 120 μm for further imaging because that seemed to offer the best compromise between optimizing both spatial resolution and SNR for plaque visualization.
Figure 3. Effect of Variable Slice Thickness.
Ex vivo coronal T2-weighted MR images of a 26 month old transgenic mouse with slice thicknesses of 60, 90, 120, 180, and 270 μm. All other parameters were held constant: in plane resolution 60 μm × 60 μm, TR = 2 s, TE = 52 ms, BW = 44 kHz. Plaque sharpness begins to fall off at slice thickness >120 μm.
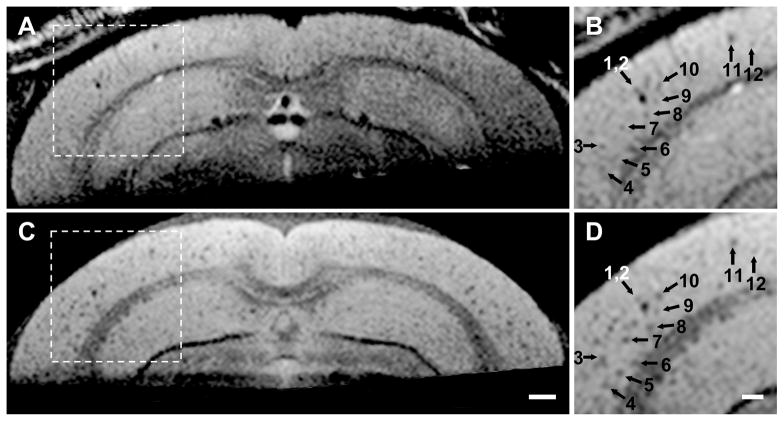
We were not able to resolve individual plaques on in vivo T2 weighted images without cardio-respiratory triggering. Although cardio-respiratory triggering improved in vivo image quality, unpredictable fluctuations in respiratory depth and in the amplitude of the detected ECG signal over time led to occasional significant variation in TR from view-to-view. This, in turn, produced view-to-view variation in steady state magnetization and resulting image artifacts. The trigger desensitizing modification of the sequence proved to be an effective solution to this problem. This is illustrated with in vivo MRI - ex vivo MRI correlation in a 24 month old transgenic mouse (Figure 4). This figure documents that the dark areas seen in vivo on MRI precisely correspond to similar dark areas on ex vivo MRI (which in turn correspond to individual amyloid plaques) (15). Despite physiologic triggering and the trigger desensitizing modification of the sequence mentioned above, minor view-to-view phase inconsistency was still present. Correction of view-to-view phase jitter using navigator signals, however, resulted in no apparent improvement in image quality.
Figure 4. Trigger Desensitizing Sequence Modification.
(A) and (B) are in vivo, (C) and (D) are spatially matched ex vivo images from a 24 month AD transgenic mouse. (A) and (C) are full FOV and (B) and (D) illustrate a magnified sub-sampled area of the parent image to its left. The arrows (1–12) point to spatial coordinate positions in the common space of the spatially registered in vivo and ex vivo image volumes using a linked cursor system. (C) Scale bar = 500 μm. (D) Scale bar = 200 μm. Plaques are not resolved as clearly in vivo as ex vivo. However, images obtained with the trigger desensitizing sequence modification, illustrated in Fig 2, are consistently adequate for resolving individual plaques.
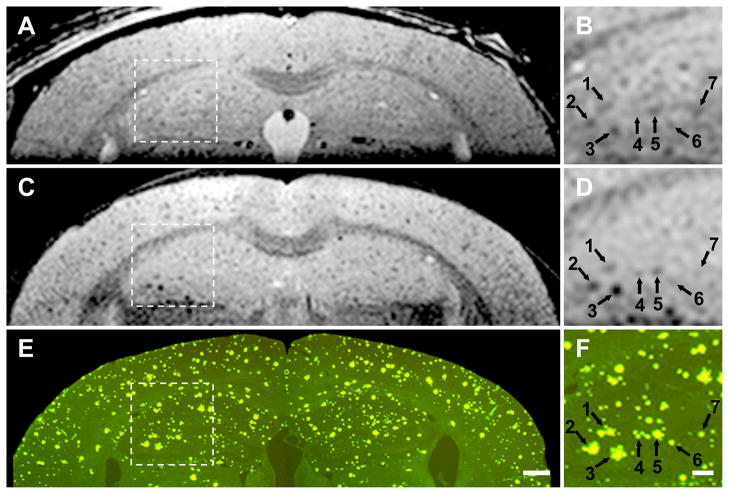
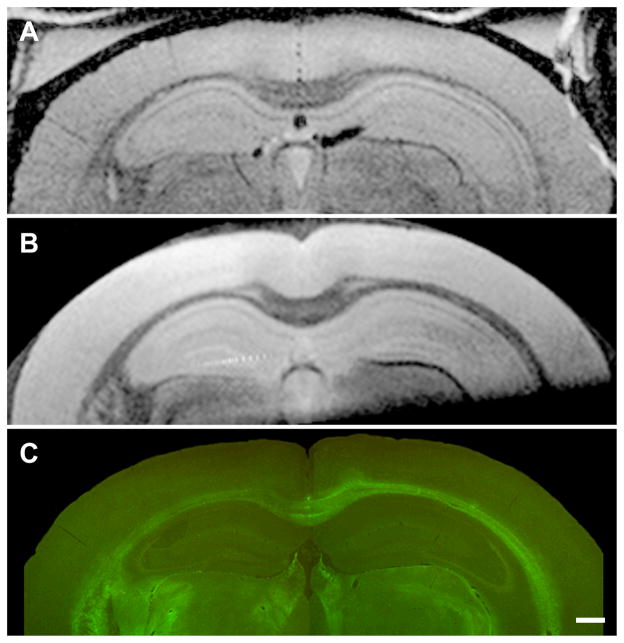
Three-way in vivo MRI - ex vivo MRI in vitro histological correlation in a 26 month old transgenic mouse reveals excellent correlation between individual plaques visualized on MRI and the thioflavin S stained plaques in the spatially registered histological sections (Figure 5). The in vivo MRI images demonstrate conclusively that visualization of individual plaques on T2-weighted images without a contrast agent is possible in the living animal. However, resolution of individual plaques in vivo is noticeably more blurry compared to ex vivo MR images. The appearance of the in vivo MR images in Fig 4 and Fig 5 are quite similar, indicating that consistent in vivo plaque visualization is possible (i.e. in vivo plaque visualization is not limited to the occasional “lucky” experiment). Plaques labeled numbers 6 and 7 in Fig 5 are clearly resolved on in vivo MRI. These plaques are 50 μm in diameter on the Thio-S stained sections. Spatially matched in vivo, ex vivo, and in vitro histological images of a wild type mouse demonstrate the absence of dark areas on MRI and likewise the absence of plaques on histological staining (Figure 6). This wild type mouse and the transgenic AD mouse in Fig 5 were nearly identical in age. Comparison of Figs 4 and 5 with Fig 6 confirms that dark areas seen on in vivo MRI in the transgenic mouse represent plaques and not simply mottling due to image noise.
Figure 5. Three- way correlation in a 26 month AD mouse.
Panels A, C, and E are full FOV and panels B, D, and F illustrate a magnified sub-sampled area centered on the hippocampus, of the parent image to its left. The numbered arrows point to identical spatial coordinate positions in the common space of the three spatially registered volumes (in vivo, ex vivo, histological) using a linked cursor system. Spatially matched in vivo (A,B), ex vivo (C,D), and histological sections (E,F) conclusively demonstrate that the dark areas seen in vivo do indeed represent plaques. (E) Scale bar = 500 μm. (F) Scale bar = 200 μm. Plaque sharpness in vivo approaches, but is clearly inferior to that obtained on ex vivo MRI.
Figure 6. Three- way correlation in a 24 month wild type mouse.
Spatially matched in vivo (A), ex vivo (B), and histological sections (C) in a 24 month wild type mouse demonstrate no dark spots on MRI and no plaques on histology. Comparison of these images with those of AD transgenic mice of approximately the same age in Figs 4 and 5 confirm that dark areas seen on in vivo MRI in AD transgenic mice represent plaques and not simply mottling due to image noise. (C) Scale bar = 500 μm.
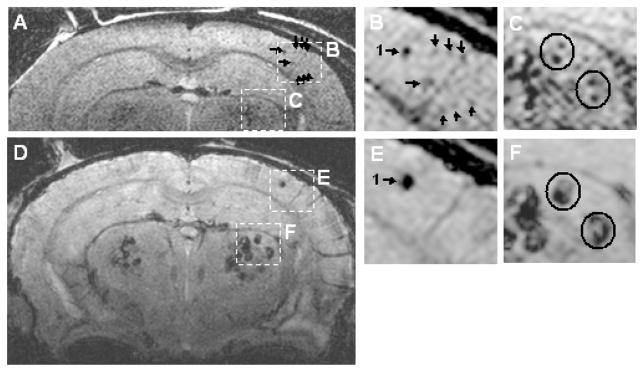
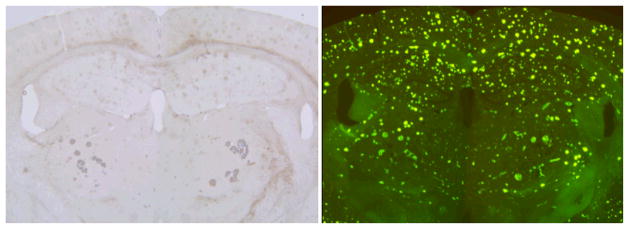
We evaluated a T2* sequence for in vivo MRI, and in the process identified several undesirable properties of this type of sequence. We noticed that the T2* weighted sequence did not resolve smaller plaques that were clearly resolved with the spin echo sequence (Fig 7). In addition, the size of some plaques (particularly in the striatum) was overestimated with the T2* sequence. We postulated that this might be due to a regional discrepancy in iron content of plaques with highest concentrations in plaques located in the striatum. This was confirmed by iron staining (Fig 8).
Figure 7. Spin Echo Vs T2* Gradient Echo Plaque Contrast.
In vivo MRI of a 20 month AD mouse, (A – C) a spin echo and (D– F) a T2* gradient echo image at the same anatomic position. Spatial resolution was identical between the two acquisitions (60 μm × 60 μm in plane and 120 μm through plane). Panels (B) and (E), centered on the cortex, are magnified from the corresponding parent image in (A) and (D) respectively. The size of the largest plaque in the cortex (arrow 1) is considerably larger on the T2* (E) than the spin echo image (B). However the smaller plaques indicated by arrows in (B), are clearly visible on the spin echo and are barely perceptible on the corresponding T2* gradient echo scan (E).
Panels (C) and (F), centered on the striatum, are magnified from the corresponding parent image in (A) and (D) respectively. Note that plaques (circled) in the striatum that are distinctly resolved on the spin echo image (C), are blurred into a “single” dark spot on the T2* image (F).
Figure 8. Thio-S and Iron stained sections in AD mouse.
The same section was sequentially stained with Prussian Blue for iron (left) and Thio-S (right.) in a 24 month old transgenic mouse. Mean plaque size on Thio-S is fairly uniform through the brain, in particular no obvious difference in size is seen between plaques in the striatum vs. those in the cortex and hippocampus. In contrast, the iron content of striatal plaques is far greater than plaques in the cortex and hippocampus where Prussian blue staining is imperceptible.
Discussion
To our knowledge these results represent the first in vivo images of individual amyloid plaques without the aid of an exogenously administered contrast agent. We have shown that plaques with diameters as small as 50 μm can be successfully visualized in the living animal without a contrast agent (Fig 5). Based on this value, we would expect to be able to resolve individual plaques constituting the upper 10 % – 15% of the overall plaque distribution of a two year old double transgenic mouse (unpublished data, T Wengenack) (20). A number of useful applications of this approach can be envisioned in AD transgenic mice. Because individual plaques can be studied longitudinally over time in the same animal non-invasively, in theory MRI could be used to study plaque biology over very long periods — i.e. the entire lifetime of an animal. Natural history studies can be envisioned in which the temporal and regional characteristics of plaque development are characterized. Perhaps of greater interest is employing this approach to assess the effect of experimental amyloid reduction therapeutic interventions at the level of the individual plaque. Interesting biologic questions could be addressed, for example does a particular therapeutic approach arrest plaque growth, shrink plaques, or prevent development of new plaques? Is therapeutic modification of plaque morphology consistent across all plaques, or is there a high degree of plaque to plaque variation in response?
Plaque sizes in human AD tissue range up to 200 μm, which is roughly twice the maximum size observed in transgenic mice. There is no reason in principle that this approach could not be extended to humans. It would, however, require improvements in instrumentation that would permit imaging with similar contrast-to-noise, at slightly lower spatial resolution, in roughly 1/6 the imaging time used in these mouse experiments. With the growing awareness of the feasibility of human imaging at ultrahigh fields (≥ 7T) and improvements in RF coil technology, human applications of this approach may be possible in the future.
We acknowledge the nonspecificity of dark areas on T2-weighted images for plaques. For example, areas of microhemorrhage, or heavily myelinated fiber tracts may also appear dark on T2-weighted images (15). We do not believe that this necessarily diminishes the utility of plaque imaging with MRI. In the context of imaging transgenic AD mice, one can be reasonably sure that most dark areas visualized do indeed represent plaques. And, imaging of transgenic mice is not performed for purposes of clinical diagnosis. In humans, however, subtle signs are often critical for early diagnosis. In this setting, diagnostic misinterpretation of microhemmorhages for plaques or vice versa may not be acceptable. The non-specificity of dark areas on T2-weighted images does motivate pursuit of plaque specific MRI contrast probes as a way to impart imaging specificity at the tissue level (15, 17, 29, 30). In addition, molecular specific probes increase the sensitivity for plaque detection. Our own data has demonstrated that while plaques are visible ex vivo without contrast, plaque to background contrast-to-noise increases roughly two times on T2-weighted images following contrast injection (15). And, plaque to background contrast-to-noise increases to nine times following contrast injection on T1-weigthed images (15). Wadghiri et al. (17) recently demonstrated MRI visualization of plaques in vivo and ex vivo at 7 T in transgenic mice after disruption of the blood-brain-barrier by mannitol and injection of a plaque specific contrast agent. They were unable to visualize plaques without a contrast agent. Plaque visualization is an application that presses the limit of the resolving capability of in vivo MRI. We believe the most likely explanation for the discrepancy between results of Wadghiri et al. (17) and our own lies with the imaging strategy employed. Wadghiri et al. (17) employed through-plane resolutions of 270 μm or greater. In vivo imaging was also done without physiologic monitoring or triggering. It may be that other aspects of the strategy we adopted - e.g., restricted FOV imaging and trigger desensitizing to minimize view-to-view B0 variation - are also helpful.
We have focused efforts on T2 imaging of individual plaques without a contrast agent. The same imaging principles however can be ported directly to T1-weighted sequences. While enhancement of individual plaques on MRI with the aid of targeted contrast probes shows a promising future in this field, the ability to visualize plaques pre-contrast will be an important aspect of contrast enhanced plaque studies. Because of the demanding spatial resolution requirements, extremely accurate spatial registration between pre and post contrast images is necessary in order to accurately measure the imaging features of contrast agent behavior — for example time course, dose response, etc. Individual plaques serve as intrinsic fiducial markers which can facilitate precise registration (with the caveats outlined below) between pre and post contrast enhanced exams. The same principle holds true for spatial registration of serial MRI studies.
Although many plaques in each section could be unequivocally matched between the histological and MR images (in vivo and ex vivo), some plaques visible in the histological section were not visible on MRI and visa versa. In reality perfect one-to-one correspondence between every plaque in the MRI and histological images was not possible. The histological sections were 30 μm and the MRI slices were 120 μm. Differences in partial volume averaging between MRI and histology were inevitable. In addition, the histological specimens were sliced manually. Even for a highly skilled individual, it is impossible to create sections with perfect 30-μm uniformity throughout each section. With MRI however, tissue was sectioned in a perfectly rectilinear grid, and therefore, some mismatch of within-section thickness between the MRI and histological preparation was unavoidable.
Current evidence points to a T2 effect due to static microscopic field gradients from iron deposition in plaque as the primary source of MRI contrast between plaques and background tissue (14, 31). Use of a gradient recalled echo sequence to impart T2* weighting would therefore seem to be an obvious approach. In addition, a 3D gradient echo sequence would be more time efficient than a spin echo sequence. There are several reasons we decided to pursue the long TE spin echo sequence outlined in this work. First, as illustrated in Figure 7, susceptibility artifacts distort the morphology of the cortical surface on a T2* weighted gradient echo sequence. This interferes to some extent with identification of peripherally located cortical plaques. Second, preliminary comparisons of T2* weighted gradient echo vs. long TE spin echo images indicated that the ability to resolve small plaques on the spin echo sequence was superior to the T2* weighted gradient echo sequence (Fig 7). The ability to identify the smallest possible plaques in vivo is clearly a major thrust of this imaging application. Third and perhaps most important, preliminary evidence indicates that the “blooming” effect produced by tissue iron deposition on T2* weighted gradient echo images results in an overestimation of the size of some plaques, presumably those with dense iron deposition. Conversely, long TE spin echo sequences seem to more accurately represent plaque size across a wide range of sizes, when compared to spatially matched thioflavin S stained sections. Related to the above concern is a mismatch in apparent plaque size on T2* weighted gradient echo images between plaques located in the cortex and hippocampus vs those located in the striatum. As illustrated in Figure 7, plaques in the striatum appear much larger than those in the cortex and hippocampus on T2* weighted gradient echo images. However, in thioflavin S stained sections there is no evidence of a mismatch in average plaque size in the cortex and hippocampus vs. the striatum. One possible explanation for this apparent regional discrepancy between histologically determined plaque size vs that on T2* weighted gradient echo images, is that the density of iron deposition in plaques located in the striatum may be greater than iron density in cortical and hippocampal plaques in this particular animal model. Iron staining (Fig 8) preliminarily supports this notion, thus accounting for the regional variability in the appearance of plaques on T2* weighted images (compare the appearance of the iron stained histological section in Fig 8 with panel (D) in Fig 7). A detailed analysis of the relationship between plaque size on various MRI sequences, iron load in individual plaques, true plaque size as determined by thioflavin S stains, and the possibility of systematic regional variation in iron deposition in this particular transgenic animal model is beyond the scope of the present investigation. An ideal in vivo MRI measure of plaques would reflect true plaque size rather than the amount of iron. Our pursuit of T2 weighted spin echo imaging was motivated by the possibility that T2* sequences primarily measured plaque iron content, which is not consistently related to plaque size, while the long TE spin echo sequence more accurately reflected true plaque size. It remains to be determined, however, if spin echo sequences do faithfully reproduce histologically ascertained plaque size. The lower limit of plaque size that is consistently resolvable by in vivo MRI also remains to be determined.
Acknowledgments
The authors wish to thank Dawn M. Gregor, B.S., for mouse breeding and genotyping, and Robert Schlentz, Ph.D. for technical assistance
Grant Support: NIH AG022034, NIH RR08079, and the W.M. Keck Foundation
References
- 1.Evans DA, Funkenstein HH, Albert MS. Prevalence of Alzheimer’s disease in a community population of older persons. JAMA. 1989;262:2551–2556. [PubMed] [Google Scholar]
- 2.McKhann G, Drachman D, Folstein M, Katzman R, Price D, Stadlan EM. Clinical diagnosis of Alzheimer’s disease: report of the NINCDS-ADRDA work group under the auspices of Department of Health and Human Services Task Force on Alzheimer’s disease. Neurology. 1984;34:939–944. doi: 10.1212/wnl.34.7.939. [DOI] [PubMed] [Google Scholar]
- 3.Growdon JH. Biomarkers of Alzheimer disease. Arch Neurol. 1999;56:281–283. doi: 10.1001/archneur.56.3.281. [DOI] [PubMed] [Google Scholar]
- 4.Hardy J, Selkoe DJ. The amyloid hypothesis of Alzheimer’s disease: progress and problems on the road to therapeutics. Science. 2002;297:353–356. doi: 10.1126/science.1072994. [DOI] [PubMed] [Google Scholar]
- 5.Hsiao K, Chapman P, Nilsen S, Eckman C, Harigaya Y, Younkin D, Yang F, Cole GM. Correlative memory deficits, Aβ elevation, and amyloid plaques in transgenic mice. Science. 1996;274:99–102. doi: 10.1126/science.274.5284.99. [DOI] [PubMed] [Google Scholar]
- 6.Holcomb L, Gordon M, McGowan E, Yu X, Benkovic S, Jantzen P, Wright K, Saad I, Mueller R, Morgan D, Sanders S, Zehr C, O’Campo K, Hardy J, Prada CM, Eckman C, Younkin SG, Hsiao K, Duff K. Accelerated Alzheimer-type phenotype in transgenic mice carrying both mutant amyloid precursor protein and presenilin 1 transgenes. Nat Med. 1998;4:97–100. doi: 10.1038/nm0198-097. [DOI] [PubMed] [Google Scholar]
- 7.Schenk D, Barbour R, Dunn W, Gordon G, Grajeda H, Guido T, Hu K, Huang J, Johnson-Wood K, Khan K, Kholodenko D, Lee M, Liao Z, Liebergurg I, Motter R, Mutter L, Soriano F, Shopp G, Vasquez N, Vandevert C, Walker S, Wogulis M, Yednock T, Games D, Seubert P. Immunization with amyloid-beta attenuates Alzheimer-disease-like pathology in the PDAPP mouse. Nature. 1999;400:173–177. doi: 10.1038/22124. [DOI] [PubMed] [Google Scholar]
- 8.Klunk WE, Debnath ML, Pettegrew JW. Chrysamine-G binding to Alzheimer and control brain: autopsy study of a new amyloid probe. Neurobiol Aging. 1998;16:541–548. doi: 10.1016/0197-4580(95)00058-m. [DOI] [PubMed] [Google Scholar]
- 9.Klunk WE, Wang Y, Huang GF, Debnath ML, Holt DP, Shao L, Hamilton RL, Ikonomovic MD, DeKosky ST, Mathis CA. The binding of 2-(4′-methylaminophenyl)benzothiazole to postmortem brain homogenates is dominated by the amyloid component. Journal of Neuroscience. 2003;23(6):2086–92. doi: 10.1523/JNEUROSCI.23-06-02086.2003. [DOI] [PMC free article] [PubMed] [Google Scholar]
- 10.Skovronsky DM, Zhang B, Kung M-P, Kung HF, Trojanowski JQ, Lee VM. In vivo detection of amyloid plaques in a mouse model of Alzheimer’s disease. Proc Natl Acad Sci USA. 2000;97(13):7609–7614. doi: 10.1073/pnas.97.13.7609. [DOI] [PMC free article] [PubMed] [Google Scholar]
- 11.Shoghi-Jadid K, Small GW, Agdeppa ED, Kepe V, Ercoli LM, PS, Read S, Satyamurthy N, A P, Huang SC, Barrio JR. Localization of neurofibrillary tangles and beta-amyloid plaques in the brains of living patients with Alzheimer disease. Am J Psychiatry. 2002;10:24–35. [PubMed] [Google Scholar]
- 12.Klunk WE, Engler H, Nordberg A, Wang Y, GB, PHD, Bergstrom M, IS, Huang GF, Estrada S, Ausen B, Debnath ML, Barletta J, Price JC, Sandell J, Lopresti BJ, Wall A, Koivisto P, Antoni G, Mathis CA, Langstrom B. Imaging brain amyloid in Alzheimer’s disease with Pittsburgh Compound-B. Ann Neurol. 2004;55:306–319. doi: 10.1002/ana.20009. [DOI] [PubMed] [Google Scholar]
- 13.Bacskai BJ, Hickey GA, Skoch J, Kajdasz ST, Wang Y, Huang GF, Mathis CA, Klunk WE, Hyman BT. Four-dimensional multiphoton imaging of brain entry, amyloid binding, and clearance of an amyloid-beta ligand in transgenic mice. Proc Natl Acad Sci USA. 2003;100(21):12462–7. doi: 10.1073/pnas.2034101100. [DOI] [PMC free article] [PubMed] [Google Scholar]
- 14.Beneviste H, Einstein G, Kim KR, Hulette C, Johnson GA. Detection of neuritic plaques in Alzheimer’s disease by magnetic resonance microscopy. Proc Natl Acad Sci USA. 1999;96(24):14079–14084. doi: 10.1073/pnas.96.24.14079. [DOI] [PMC free article] [PubMed] [Google Scholar]
- 15.Poduslo JF, Wengenack TM, Curran GL, Wisniewski T, Sigurdsson EM, SI M, Borowski BJ, Jack CR., Jr Molecular targeting of Alzheimer’s amyloid plaques for contrast-enhanced magnetic resonance imaging. Neurobiol Dis. 2002;11:315–329. doi: 10.1006/nbdi.2002.0550. [DOI] [PubMed] [Google Scholar]
- 16.Dhenain M, Privat N, Duyckaerts C, Jacobs RE. Senile plaques do not induce susceptibility effects in T2*-weighted MR microscopic images. NMR in Biomed. 2002;15:197–203. doi: 10.1002/nbm.760. [DOI] [PubMed] [Google Scholar]
- 17.Wadghiri YZ, Sigurdsson EM, Sadowski M, Elliott JI, Li Y, Scholtzova H, Tang CY, Aguinaldo G, Pappolla M, Duff K, Wisniewski T, Turnbull DH. Detection of Alzheimer’s amyloid in transgenic mice using magnetic resonance microimaging. Magn Reson Med. 2003;50:293–302. doi: 10.1002/mrm.10529. [DOI] [PubMed] [Google Scholar]
- 18.Helpern JA, Lee S-P, Falangola MF, Dyakin V, Bogart A, Ardekani B, Duff K, Branch C, Wisniewski T, de Leon MJ, Wolf O, O’Shea J, Nixon RA. MRI assessment of neuropathology in a transgenic mouse model of Alzheimer’s disease. Magn Reson Med. 2004;51:794–798. doi: 10.1002/mrm.20038. [DOI] [PubMed] [Google Scholar]
- 19.Zhang J, Yarowsky P, Gordon MN, DiCarlo G, Munireddy S, van Zijl PCM, Mori S. Detection of amyloid plaques in mouse models of Alzheimer’s disease by magnetic resonance imaging. Magn Reson Med. 2004;51:452–457. doi: 10.1002/mrm.10730. [DOI] [PubMed] [Google Scholar]
- 20.Wengenack TM, Whelan S, Curran GL, Duff KE, Poduslo JF. Quantitative histological analysis of amyloid deposition in Alzheimer’s double transgenic mouse brain. Neuroscience. 2000;101:939–944. doi: 10.1016/s0306-4522(00)00388-2. [DOI] [PubMed] [Google Scholar]
- 21.Grohn O, Poduslo JF, Jack CR, Jr, Lin J, Garwood M. Adiabatic inner volume selection (IVS) method for high resolution 3D MRI. Proc Intern Soc Magn Reson Med. 2003;11:960. [Google Scholar]
- 22.Garwood M, Ke Y. Symmetric Pulses to Induce Arbitrary Flip Angles with Compensation for RF Inhomogeneity and Resonance Offsets. J Magn Reson. 1991;94:511–525. [Google Scholar]
- 23.Silver MS, Jospeh RI, Hoult DI. Highly selective π/2 and π pulse generation. J Magn Reson. 1984;59:347–351. [Google Scholar]
- 24.Cassidy PJ, Schneider JE, Grieve SM, Lygate C, Neubauer S, Clarke K. Assessment of motion gating strategies for mouse magnetic resonance at high magnetic fields. J Magn Reson Imaging. 2004;19:229–237. doi: 10.1002/jmri.10454. [DOI] [PubMed] [Google Scholar]
- 25.Ugurbil K, Tseko NV, Garwood M. Fast MRI for assessment of myocardial perfusion with arrhythmia insensitive magnetization preparation. 1999 doi: 10.1002/mrm.1910340408. US Patent No. 5,908,386. [DOI] [PubMed] [Google Scholar]
- 26.Ehman RL, Felmlee JP. Adaptive technique for high-definition MR imaging of moving structures. Radiology. 1989;173:255–263. doi: 10.1148/radiology.173.1.2781017. [DOI] [PubMed] [Google Scholar]
- 27.Sheehan DC, Hrapchak BB. Theory and practice of histotechnology. Battelle Press; 1980. pp. 217–218. [Google Scholar]
- 28.Robb RA. A software sytem for interactive and quantitative analysis of biomedical images. In: Hohne KH, Fuchs H, Pizer SM, editors. 3D Imaging in Medicine. Springer Verlag; Berlin-Heidelberg: 1990. pp. 333–361. [Google Scholar]
- 29.Wengenack TM, Curran GL, Poduslo JF. Targeting Alzheimer amyloid plaques in vivo. Nat Biotechnol. 2000;18:868–872. doi: 10.1038/78482. [DOI] [PubMed] [Google Scholar]
- 30.Poduslo JF, Curran GL, Peterson JA, McCormick DJ, Fauq AH, Khan MA, Wengenack TM. Design and chemical synthesis of a magnetic resonance contrast agent with enhanced in vitro binding, high blood--brain barrier permeability, and in vivo targeting to Alzheimer’s disease amyloid plaques. Biochemistry. 2004;43:6064–6075. doi: 10.1021/bi0359574. [DOI] [PMC free article] [PubMed] [Google Scholar]
- 31.Lovell MA, Robertson JD, Teesdale WJ, Campbell JL, Markesbery WR. Copper, iron, and zinc in Alzheimer’s disease senile plaques. J Neurol Sci. 1998;158:47–52. doi: 10.1016/s0022-510x(98)00092-6. [DOI] [PubMed] [Google Scholar]


