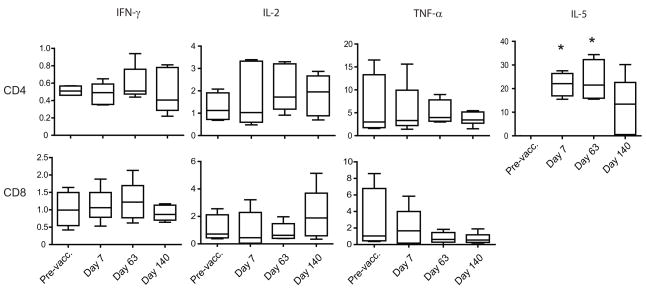
Figure 3.
Absolute frequencies of CD4 and CD8 cytokine-producing T cells. PBMC of vaccinated volunteers (n=10) were collected pre-vaccination and on days 7, 63 and 140 of the study. Cells were stimulated with AMA1 for 72h, and intracellular staining for IFN-γ, IL-2, TNF-α and IL-5 allowed determination of the frequencies of cytokine-producing populations. The horizontal lines within the boxes indicate median values; the boxes indicate 95% confidence interval, and the error bars indicate SEM. Pre-vacc: Pre-vaccination. Data are corrected for background frequencies. * Significantly different from pre-vaccination frequency, Dunnett’s test, p<0.01

