

Abstract
Administration of IL-2 to HIV-infected patients leads to significant increases in CD4 T cell counts. Previously we have shown that IL-2 induces increased proliferation and survival of CD4 T cells. Deuterium labeling studies were undertaken to study the relationship between IL-2 induced increases in CD4 T cell numbers and IL-2 effects on cell proliferation and survival. A strong inverse correlation was seen between the decay rate of label in CD4 cells and increases in CD4 cell numbers (R= -0.67; p<0.001). This correlation was not seen with the level of proliferating cells. Although the baseline CD4 cell count and number of CD4 cells expressing CD25 were also predictive of CD4 cell increases, the decay rate remained the most statistically significant predictor in multivariate regression models. Thus, increase in survival of CD4 T cells appears to be the critical mechanism leading to sustained CD4 cell increases in HIV-infected patients receiving intermittent IL-2 therapy.
Keywords: IL-2, deuterium, T cell survival
Introduction
Treatment of HIV-1 infected patients with intermittent cycles of interleukin-2 (IL-2) leads to significant and sustained increases in CD4 T cell numbers. This effect has been demonstrated in a number of randomized trials and is a result of a selective increase in CD4 T cell but not CD8 T cell numbers1-4. The increased numbers are primarily due to peripheral expansion of a subset of CD4 T cells that express the IL-2 receptor alpha chain (CD25) 5. Flow cytometric studies have shown that there is preferential expansion of naïve (CD27+CD45RO-) and central memory (CD27+CD45RO+) populations of these CD4 T cells 6, 7. Although they express high levels of forkhead transcription factor P3 (foxP3), they exert only weak suppressive effects8.
Until recently the mechanisms leading to these increases remained unknown. By using deuterium (2H) and bromodeoxyuridine (BrdU) to label proliferating cells, T cell turnover was studied by our group in HIV-infected patients receiving IL-2 therapy7. A semi-empirical model characterized by a limited number of parameters was developed to describe the labeled cell decay kinetics. Analyses employing this model showed that the effect of intermittent IL-2 therapy on T cell turnover can be characterized by an increase in proliferation of CD4 and CD8 T cells during therapy, as well as a profound increase in survival of CD4 (but not CD8) T cells following therapy; the latter was seen primarily during later cycles of IL-2 therapy, and was more prominent in long-term (> 1 year) responders to IL-2 therapy.
To better understand the association between the CD4 T cell increases seen following intermittent IL-2 therapy and the lymphocyte proliferation and survival induced by such therapy, we extended the deuterium labeling studies to recruit additional patients receiving IL-2. The goal of the current study was to determine whether there was an association between any of the modeling parameters and the magnitude of change in CD4 T cell numbers following a cycle of IL-2.
Methods
Patients
HIV-infected patients who were receiving intermittent IL-2 therapy as part of other ongoing protocols were invited to participate in this IRB-approved study. Patients were excluded due to major clinical or laboratory abnormalities, if they were pregnant or breast-feeding, or if they had diabetes mellitus requiring drug therapy. All patients provided informed consent. IL-2 therapy was administered at doses ranging from 3.0 to 7.5 IU twice daily for 5 days by subcutaneous injection, and all patients received combination antiretroviral therapy while receiving IL-2 therapy. Modeling results for 15 of the 31 patients included in the current study have been reported previously7, but the correlations being examined in the current study have not been previously reported.
Deuterium infusion
2H2-glucose (Sigma-Aldrich or Cambridge Isotope Laboratories, Inc.) was administered by continuous intravenous infusion over 5 days at a dose of 60g per day. The infusion began on the third day of IL-2 therapy and continued for 2 days after completion of the IL-2 cycle. Patients underwent a 1- to 2- pass leukapheresis to obtain cells for laboratory studies.
Laboratory studies
Determination of lymphocyte subsets was performed on cells from frozen samples using immunofluorescence staining by lysed whole blood method (BD Biosciences, Immunocytometry Systems) as previously described7. The samples were analyzed on a 2-color or 3-color multiparameter flow cytometer (Coulter XL or BD FacsCanto.) For determination of deuterium incorporation, CD4 and CD8 T cells from frozen samples were isolated by fluorescence-activated cell sorting, using an EPICS ALTRA flow cytometer (Beckman Coulter Inc.) or BD FACSVantage SE FACSDiVa (BD Biosciences), to greater than 99.0% purity.
To quantitate 2H2-glucose enrichment in serum, glucose was extracted from serum with methanol and converted to the aldonitrile penta-acetate derivatives of glucose and 2H2-glucose for gas chromatography/mass spectrometry analysis using an HP 5890 gas chromatograph (Hewlett-Packard Co.) interfaced to an HP 5971 mass selective detector (Hewlett-Packard Co.) 7.
Quantitation of 2H2-deoxyadenosine enrichment in cells was performed as previously described7. Briefly, DNA was hydrolyzed to mono-deoxyribonucleosides and either converted to the permethylated derivatives of deoxyadenosine and 2H2-deoxyadenosine for gas chromatography/mass spectrometry analysis or analyzed directly by liquid chromatography/mass spectrometry. Sample enrichments were calculated by comparison with standard curves prepared from 2H-deoxyadenosine.
To determine the amount of new DNA that was synthesized, the experimentally determined percentage of 2H2-deoxyadenosine enrichment was corrected as described elsewhere9 to account for the following factors: a) the maximum labeling of freshly obtained lymphocytes cultured in vitro in the presence of 100% 2H2-glucose, which was approximately 60%, and b) the level of enrichment of 2H2-glucose in the serum, typically about 20% to 30%, using the following formula: fraction of 2H2-deoxyadenosine enrichment in DNA (relative to total deoxyadenosine) /[0.6 × the fraction of 2H2-glucose enrichment in serum].
Modeling and statistical analysis
The changes in CD4 and CD8 T cell counts following an IL-2 cycle were determined by subtracting the baseline count from the post-IL-2 count. The baseline count was the mean of the count obtained immediately before starting an IL-2 cycle and the count obtained at the prior visit. The post IL-2 T cell count was the mean of the counts obtained at the three visits closest to 2 months following the start of the IL-2 cycle.
A previously developed semi-empirical model was used to describe label decay kinetics7. The model takes into account that CD4+ T cells or CD8+ T cells consist of subpopulations of lymphocytes characterized by slightly different disappearance rates, d. Each patient has a different distribution of disappearance rates for the fraction of labeled cells, assumed to follow a log-normal distribution with patient-specific mean log disappearance rate, md, and standard deviation sd (indicative of the level of heterogeneity in disappearance rate of the subpopulations of T cells). In addition the model estimates the source of labeled cells, S, which correlates with the fraction of proliferating cells and is a function of the proliferative capacity at the time of labeling as well as of effects related to trafficking from lymph nodes into the blood pool. The half-life, t1/2, is defined as ln2/(10md).
Two group comparisons for continuous outcomes were made using the signed rank sum test. The associations between kinetics parameters were explored using Spearman correlation coefficient (R) and simple and multiple linear regression. To examine whether these associations hold when analyzing all available data from patients with multiple labeling cycles, we applied the generalized estimating equations (GEE) method10 to account for correlation among different IL-2 cycles for the same subject. In all analyses HIV-1 viral load was used as a categorical variable with three categories: <50, 50 – 10,000, and >10,000 copies/mL. P values of <0.05 were considered statistically significant. Statistical analyses were performed using STATA 8.0 (Stata Corp., College Station, TX).
Results
31 HIV-infected patients who received IL-2 therapy were included in this study. Patients had received an average of 9 IL-2 cycles prior to study enrollment (range = 0-27 cycles). During the study period, 5 patients received two deuterium labeling infusions, and an additional 5 patients received 3 infusions. In total, 46 deuterium infusions were administered to this cohort during the course of this study. For those who underwent more than one infusion, data from the last infusion from each patient were used for the primary analyses.
A previously developed semi-empirical model was used to describe the decay kinetics for the CD4 and CD8 T lymphocytes labeled during the deuterium infusion7. There was a marked increase in proliferation during the IL-2 cycle, followed by a slower decay in CD4 relative to CD8 cell labeling in most patients7. The mean baseline T cell counts, change in T cell counts post IL-2, and calculated kinetic parameters (mean log disappearance rate (md), source of labeled cells (S), and half-life (t½)) for CD4 and CD8 T cells for the 31 study subjects are shown in Table 1. The mean baseline CD4 T cell count was 638 cells/mm3, and the mean viral load was 5560 copies/mL. The mean change in cell count was +249 cells/mm3 for CD4 T cells and +98 cells/mm3 for CD8 T cells, the mean value for md was -1.41 for CD4 T cells and -0.93 for CD8 T cells, and the mean t½ was 18.5 weeks for CD4 T cells and 3.8 weeks for CD8 T cells.
Table 1. Summary of baseline T cell counts, change in T cell counts, and kinetic parameters.
Mean values (standard error, S.E.) are shown, except where otherwise indicated. “Early cycle” patients are those who had received zero or one cycle of IL-2 prior to entering the study. “Late cycle” patients are those who had received two or more cycles of IL-2 prior to entering the study.
| CD4 Cells | CD8 Cells | ||||||||||
|---|---|---|---|---|---|---|---|---|---|---|---|
| Patient Groups | n | CD40a | ΔCD4b | mdc | Sd | t1/2e | CD80a | ΔCD8b | mdc | Sd | t1/2e |
| All | 31 | 638 (48) | 249 (49) | -1.41 (0.15) | 0.62 (0.06) | 18.53 (78.04) | 1004 (72) | 98 (50) | -0.93 (0.13) | 0.57 (0.06) | 3.82 (6.60) |
| Early-cycle | 5 | 588 (123) | 115 (77) | -0.59 (0.16) | 0.88 (0.31) | 2.45 (1.67) | 994 (246) | -27 (88) | -0.9 (0.32) | 0.63 (0.27) | 2.46 (12.72) |
| Late-cycle | 26 | 647 (52) | 275 (56) | -1.56 (0.16) | 0.57 (0.04) | 24.91 (92.27) | 1005 (75) | 121 (57) | -0.93 (0.14) | 0.55 (0.06) | 4.23 (7.56) |
| P, early vs. late cycles | 0.67 | 0.16 | 0.01 | 0.36 | 0.01 | 1 | 0.30 | 0.79 | 0.59 | 0.79 | |
CD40, baseline CD4 T cell count (cells/μL); CD80, baseline CD8 T cell count (cells/μL)
ΔCD4, change in CD4 T cell count (cells/μL); ΔCD8, change in CD8 T cell count (cells/μL)
md, mean log10 (d, wk-1)
S, source (wk-1)
t1/2, ln2/10md (wk); median values are shown.
When patients who had previously received 0 or 1 IL-2 cycles (early-cycle patients) were compared to patients who had previously received 2 or more IL-2 cycles (late-cycle patients), a statistically significantly slower decay was seen in the CD4 T cells of late-cycle patients as indicated by a lower mean log decay rate constant, md, (early: -0.59 vs. late: -1.56; P = 0.01) but no difference was found for CD8 T cells (early: -0.9 vs late :-0.93; P = 0.79) (Table 1), as previously reported7.
A primary goal of the current study was to determine if the kinetic effects of IL-2 accounted for the CD4 count increases. We thus calculated the Spearman’s correlation coefficient (R) to examine the relationship between the magnitude of the CD4 count increases following a given IL-2 cycle and S, md, and sd of md for CD4 cells for that cycle. Of these three kinetic parameters, only md was significantly correlated with the change in CD4 T cell number (R = -0.67; P<0.001) (Figure 1A). No significant correlation was found between CD8 md and the change in CD8 T cell count (Figure 1B), or between CD4 or CD8 S or sd and either CD4 or CD8 T cell increases (Table 2). In addition, no significant correlation was seen between the change in CD4 cell number or md and the percent of naïve or memory CD4 cells (data not shown).
Figure 1.
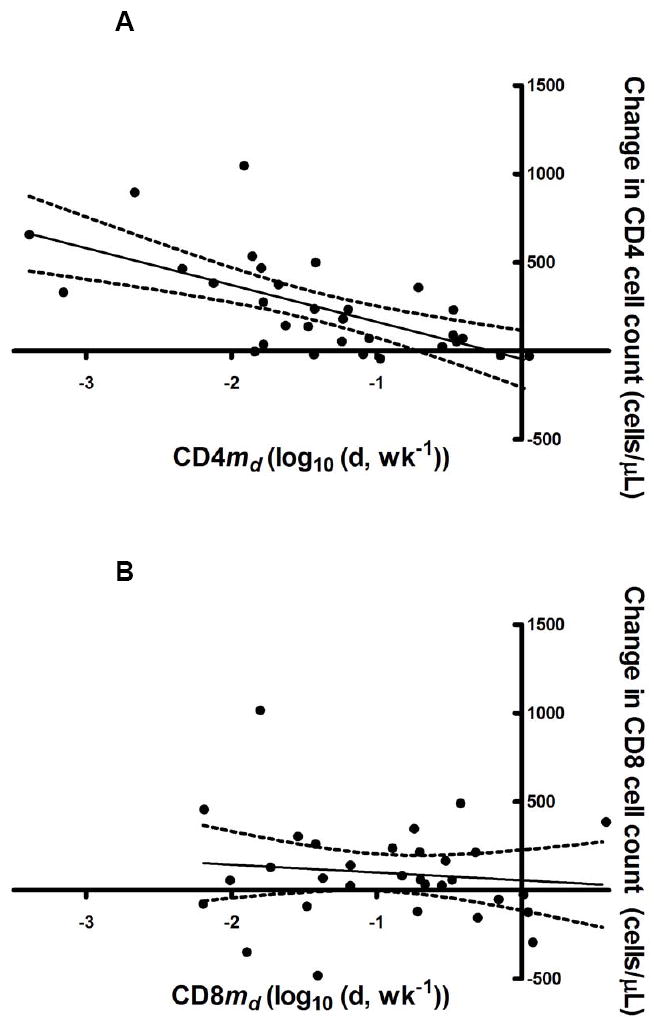
Correlations between md and change in T cell counts for (A) CD4 (R=-0.67; P<0.001) and (B) CD8 (R=-0.13; P=0.49).
Table 2. Correlations between kinetic parameters and changes in T cell counts two months following an IL-2 cycle.
The Spearman rank correlation coefficient (p value) is shown for each parameter.
| ΔCD4 (cells/μl)a | |
|---|---|
| CD4md(log(d,wk-1)) | -0.67 (<0.001) |
| CD4sd | 0.25 (0.17) |
| CD4S(wk-1) | 0.18 (0.33) |
| ΔCD8 (cells/μl)b | |
| CD8md(log(d,wk-1)) | -0.13 (0.49) |
| CD8sd | 0.22 (0.24) |
| CD8S(wk-1) | 0.18 (0.34) |
ΔCD4, change in CD4 T cell count.
ΔCD8, change in CD8 T cell count.
Figure 2A shows the changes in CD4 and CD8 T cell counts two months post-IL-2 cycle for four representative patients. Figure 2B illustrates the fitting of the data to the model for CD4 and CD8 T cells for these same patients, and Figure 2C illustrates the probability density function of the normal distribution of log d for the same patients. The location on the x axis of the peak of the curve represents the md for the population of labeled cells; a shift of the peak to the left represents a slower decay. The splay of the curve represents the homogeneity of the decay constants for the population (less splay correlates with more homogeneity). As illustrated by Figure 2, a greater increase in CD4 counts is associated with a smaller decay constant (peak has shifted to the left) and consequently longer half-life for these cells.
Figure 2.
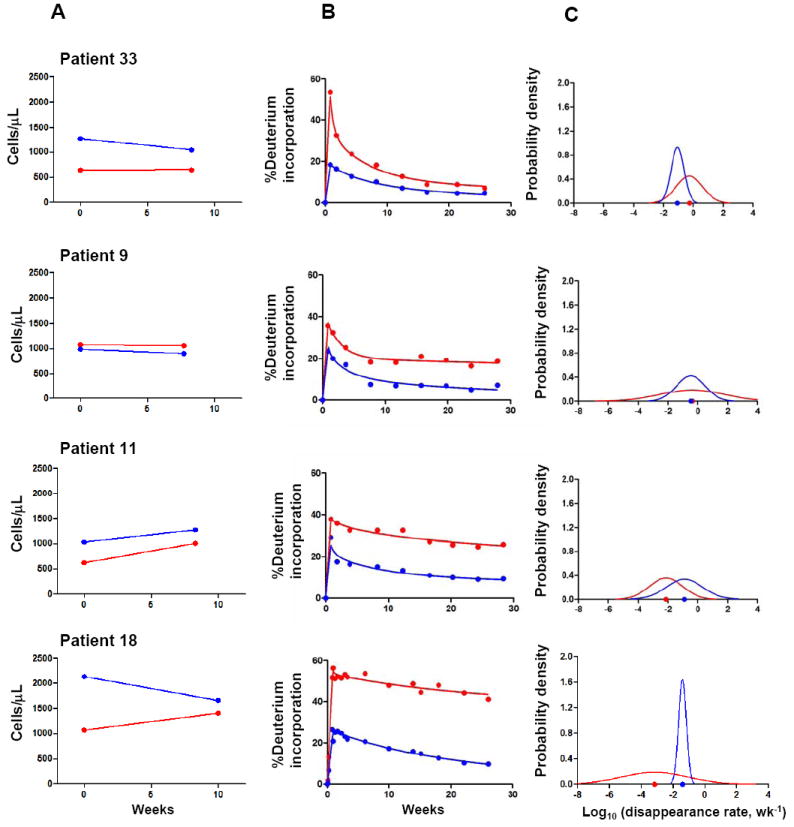
A, changes in CD4 (red) and CD8 (blue) T cell counts two months following an IL-2 cycle for 4 representative patients. Patients 33 and 9 represent patients with little or no change in CD4 count while patients 11 and 18 represent patients with robust increases in CD4 count; B, CD4 and CD8 labeling kinetics for the same representative patients (observed for up to 30 weeks post deuterium infusion). Dots represent measured fraction of labeled DNA. Solid line represents theoretical curves to match the data; C, probability density function of normal distribution of log d for CD4 and CD8. Dots on the x axis represent md.
Statistical analysis with simple linear regression showed that a one unit decrease in md was associated with an average increase in CD4 T cell count of 209 cells/μl (S.E. = 48) (Table 3). Separate simple linear regression analyses were performed to examine whether baseline CD4 T cell count and, more specifically, the baseline number of CD4 T cells expressing CD25 (CD4+/CD25+ T cells), the alpha subunit of the IL-2 receptor, were associated with change in CD4 T cell count. A significant positive association was found between change in CD4 T cell count and baseline CD4 T cell count (P<0.05) as well as baseline CD4+/CD25+ T cell count (P<0.01) (Table 3). These findings suggest that a patient’s ability to increase CD4 cells following an IL-2 cycle is related, at least in part, to the immune status at the time of therapy. These relationships were not seen with CD8 T cells (data not shown). Other factors examined by simple linear regression models included number of IL-2 cycles, baseline naïve CD4 T cell count, and viral load; none were significant. Because of recent findings that baseline (pre-IL-2) levels of activation influence response to IL-2 treatment11, baseline expression of CD38 and HLA-DR on both CD4 and CD8 T cells were also examined and were not associated with changes in CD4 T cell count.
Table 3.
Estimated effects of kinetic parameters, baseline T cell counts, change in T cell counts, and baseline viral load on the change in CD4 count using simple linear regression.
| Parameter tested | Change in CD4 count (cells/uL (S.E.)) |
|---|---|
| CD4md (wk-1)a | -209** (48) |
| Baseline CD4 T cells count (cells/μl)b | 0.55* (0.16) |
| IL-2 cycle # (early cycle compared to late cycle) | -160 (133) |
| Baseline naïve CD4 T cell count (cells/μl) b | 0.62 (0.32) |
| Baseline % naïve CD4 T cellsc | 2.94 (3.54) |
| Baseline CD4+/CD25+ T cell count (cells/μl) b | 2.37** (0.52) |
| Change in CD4+/CD25+ T cell count (cells/μl) b | 1.95** (0.15) |
| Baseline %CD4+HLA-DR+ T cellsc | 41.21 (26.19) |
| Baseline %CD4+CD38+ T cellsc | 10.32 (7.55) |
| Baseline % CD8+HLA-DR+ T cellsc | -3.76 (4.68) |
| Baseline %CD8+CD38+ T cellsc | -6.31 (4.17) |
| Viral load (50-10,000 copies/mL compared to ≤ 50 copies/mL) | -82 (107) |
| Viral load (≥ 10,000 copies/mL compared to ≤ 50 (copies/mL) | -216 (142) |
Each one unit increase in CD4md is associated with the shown change in CD4 count.
An increase of 1 cells/μL is associated with the shown change in CD4 count.
An increase of 1% is associated with the shown change in CD4 count.
indicates p-value <0.05
indicates p-value <0.01
To examine the effect of md on the change in CD4 T cell count adjusted for baseline CD4 count, a multiple linear regression analysis was performed (Table 4). In this model, md remained predictive of the change in CD4 cell count (P<0.01), while baseline CD4 T cell count was no longer significant. In addition, given what is known about the effect of the number of IL-2 cycles on responsiveness to IL-2, a model that included the number of IL-2 cycles previously received by a patient as well as baseline CD4 count as covariates was also considered. In this model, again only md remained predictive of change (P=0.02). Additional sets of regression analyses were performed to include other factors such as baseline viral load, baseline naïve T cell count, baseline CD4+/CD25+ T cell count (Table 4) and baseline expression of activation markers (data not shown). The only coefficients that maintained statistical significance in these regression models were md and baseline CD4+/CD25+ T cell count. These results demonstrate that the disappearance rate of label in CD4 cells is significantly associated with change in CD4 T cell count even after adjusting for baseline immune status.
Table 4.
Estimated effects of kinetics, baseline and change in T cell counts, and viral load on the change in CD4 count using multiple linear regression.
| Parameter | Change in CD4 count (cells/uL (S.E.))a | ||||||
|---|---|---|---|---|---|---|---|
| CD4md (wk-1) b | -209** (48) | -159** (55) | -163* (64) | -196** (56) | -216** (54) | -133* (62) | -205** (55) |
| Baseline CD4 T cell count (cells/μl) c | 0.29 (0.17) | 0.28 (0.18) | |||||
| IL-2 cycle # (early cycle compared to late cycle) | 15 (119) | 13 (122) | 17 (122) | 75 (111) | 15 (124) | ||
| Baseline naïve CD4 T cell count (cells/μl) c | 0.38 (0.28) | ||||||
| Baseline % naïve CD4 T cellsd | 3.55 (2.89) | ||||||
| Baseline CD4+/CD25+ T cell countc | 1.57* (0.65) | ||||||
| Viral load (50-10,000 copies/mL compared to ≤ 50 copies/mL) | -34 (88) | ||||||
| Viral load (≥ 10,000 copies/mL compared to ≤ 50 (copies/mL) | -169 (118) | ||||||
Each column represents results from a regression model
Each one unit increase in CD4md is associated with the shown change in CD4 count.
An increase of 1 cells/μL is associated with the shown change in CD4 count.
An increase of 1% is associated with the shown change in CD4 count.
indicates statistically significance at level 0.05
indicates p-value <0.01
The initial regression analyses used data from the last cycle for those patients who had labeling during more than one IL-2 cycle. Similar results were seen when data from the first cycle rather than the last cycle were used (data not shown). In order to utilize all the data from patients with multiple labeling cycles, the generalized estimating equations (GEE) method was applied to account for correlation among different cycles of the same subject10. By this analysis, the relationship between change in CD4 and md remained highly significant (p<0.001). The GEE method also identified a significant association between change in CD4 and baseline naïve CD4 T cell counts, in addition to baseline CD4+/CD25+ cell count. No significant association was found between CD8 kinetic parameters and CD8 cell count changes by any of these analyses.
Because CD4+/CD25+ cells are preferentially expanded during intermittent IL-2 therapy, we conducted similar analyses to examine the relationship between kinetic parameters and change in CD4+/CD25+ cell number. The results showed that md was again highly correlated with the change in this population (p < 0.01), with baseline CD4 and CD4+/CD25+ T cell counts also significantly associated in multiple linear regression analysis (p < 0.01 for both parameters)(data not shown).
Finally, we examined the relationship between CD4 and CD8 kinetic parameters. There was a significant correlation between the change in cell numbers for CD4 and CD8 T cells (R=0.68, p<0.001) as well as between the md of CD4 and CD8 cells (R=0.63, p<0.001; Figure 3) but a less significant correlation for S (R=0.39, p=0.03) and no significant association for sd. These data suggest that IL-2 is inducing increases in cell number as well as cell survival for both CD4 and CD8 T-cell populations, though the effect on CD8 cells is less profound and more variable, and does not lead to long-term or consistent changes in CD8 cell numbers.
Figure 3.
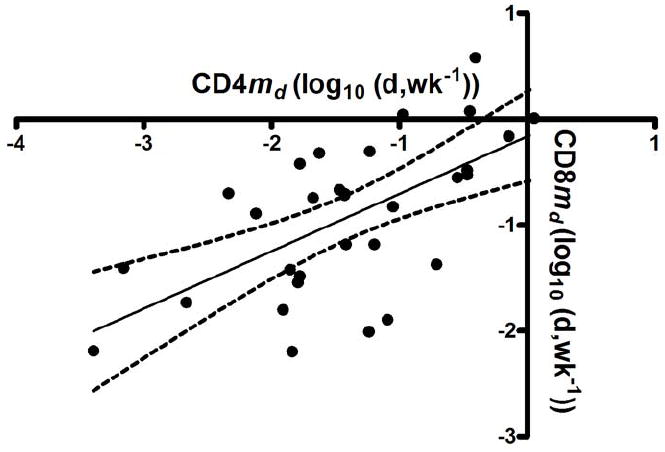
Correlation between md for CD4 T cells and md for CD8 T cells (R=0.63, P<0.001).
Discussion
Intermittent IL-2 therapy leads to an increase in proliferation of both CD4 and CD8 cells during IL-2 therapy, followed by a dramatically prolonged survival of those CD4 T cells that proliferated7. In the current study, we have demonstrated that the magnitude of the CD4 count increase following an IL-2 cycle is highly correlated with md, the average log decay constant, while no significant correlation was found with S, which is proportional to the level of proliferating cells. These data strongly suggest that the IL-2-induced prolongation in cell survival is the critical response leading to increases in CD4 cell number. Increased proliferation is likely necessary to increase CD4 T cell counts, since it is the survival of the deuterium-labeled (proliferating) cells that is prolonged. However proliferation alone is not sufficient to account for the CD4 cell increases, since increased proliferation can be seen even in patients without such count increases, and CD8 cells proliferate but do not increase in number following IL-2 therapy.
Multiple treatment cycles enhance effect of IL-2 on survival. We found slower decay of label in CD4 cells in later cycles of IL-2 when patients were studied as a group as well as individually. The mechanisms for this are not clear but others have shown that IL-2 decreases immune activation of T cells, which perhaps sets the stage for later cycles to effectively increase cell survival11,12. Although the CD4 count increases were greater following the later IL-2 cycles, the differences were not statistically significant, possibly due to the small number of patients being compared.
Previous studies have shown some measures of baseline immune status to be predictors of CD4 count change12-14. In this study, we found some to be predictive, such as baseline CD4 and CD4+/CD25+ T cell counts which were positively associated, while others such as viral load and baseline naïve T cell counts had no significant association with change in CD4 count. Overall the rate of disappearance remained the most significant predictor. This suggests that the effect of IL-2 on CD4 survival is a more important factor in CD4 count increase than is baseline immune status.
Other studies have shown increased baseline immune activation to impede CD4 T cell expansions induced by IL-211. However, we found that baseline levels of immune activation were not associated with change in CD4 count. This may have been because many patients who participated in this study had previously received one or more cycles of IL-2, which likely altered the characteristics of their T cell populations compared to when they had been naïve to IL-2. It is possible that the earlier IL-2 treatment altered memory and naïve populations and decreased activation levels so that their baseline level for this study (which was determined immediately before the IL-2 cycle during which deuterium was administered) was no longer associated with CD4 count changes.
IL-2 leads to increased proliferation of CD8 T cells but does not result in sustained increased numbers of these cells15. Likewise, in this study no correlation was seen between decay rate of CD8 cells and CD8 cell count changes. Although IL-2 causes an increase in proliferation of CD8 T cells, it is less profound and more variable than the effect on CD4 T cells and does not lead to long-term increases in CD8 counts. The profound effect on survival seen in CD4 cells may be due to higher expression of CD25 and foxP3 by these cells than is seen for CD8 cells. Alternatively the more modest effect seen on CD8 cells may be due to higher levels of activation and turnover at baseline16.
In summary, the correlation seen between CD4 cell survival and CD4 cell increases following intermittent IL-2 therapy, even after correcting for other potential contributing factors, strongly suggests that this effect on survival is one of the most important determining factors accounting for the increases in CD4 cell number. Further studies are needed to better understand the biological mechanisms leading to this increased survival.
Acknowledgments
The authors would like to thank John Roman for his work on the serum deuterated-glucose enrichment determination.
This project has been funded in whole or in part with federal funds from the National Cancer Institute, National Institutes of Health, under contract N01-CO-12400. The content of this publication does not necessarily reflect the views or policies of the Department of Health and Human Services, nor does mention of trade names, commercial products, or organizations imply endorsement by the U.S. Government.
This research was supported in part by the National Institute of Allergy and Infectious Diseases. This research was also supported by the NIH Clinical Center.
Footnotes
Potential conflicts of interest: The US government has been granted a use patent for intermittent IL-2 therapy, including J. A. Kovacs and H. Clifford Lane as inventors. All other authors declare no competing financial interests.
This study has been presented in part at the 15th Conference on Retroviruses and Opportunistic Infections in Boston, February 2008.
This manuscript contains results that were derived from data obtained from a clinical trial, NCT00001651, which is listed on www.clinicaltrials.gov.
References
- 1.Kovacs JA, Vogel S, Albert JM, et al. Controlled trial of interleukin-2 infusions in patients infected with the human immunodeficiency virus. N Engl J Med. 1996;335:1350–1356. doi: 10.1056/NEJM199610313351803. [DOI] [PubMed] [Google Scholar]
- 2.Davey RT, Jr, Chaitt DG, Albert JM, et al. A randomized trial of high- versus low-dose subcutaneous interleukin-2 outpatient therapy for early human immunodeficiency virus type 1 infection. J Infect Dis. 1999;179:849–858. doi: 10.1086/314678. [DOI] [PubMed] [Google Scholar]
- 3.Levy Y, Capitant C, Houhou S, et al. Comparison of subcutaneous and intravenous interleukin-2 in asymptomatic HIV-1 infection: a randomised controlled trial. ANRS 048 study group. Lancet. 1999;353:1923–1929. doi: 10.1016/s0140-6736(98)07345-0. [DOI] [PubMed] [Google Scholar]
- 4.Davey RT, Jr, Murphy RL, Graziano FM, et al. Immunologic and virologic effects of subcutaneous interleukin 2 in combination with antiretroviral therapy: A randomized controlled trial. Jama. 2000;284:183–189. doi: 10.1001/jama.284.2.183. [DOI] [PubMed] [Google Scholar]
- 5.Sereti I, Martinez-Wilson H, Metcalf JA, et al. Long-term effects of intermittent interleukin 2 therapy in patients with HIV infection: characterization of a novel subset of CD4(+)/CD25(+) T cells. Blood. 2002;100:2159–2167. [PubMed] [Google Scholar]
- 6.Sereti I, Anthony KB, Martinez-Wilson H, et al. IL-2-induced CD4+ T-cell expansion in HIV-infected patients is associated with long-term decreases in T-cell proliferation. Blood. 2004;104:775–780. doi: 10.1182/blood-2003-12-4355. [DOI] [PubMed] [Google Scholar]
- 7.Kovacs JA, Lempicki RA, Sidorov IA, et al. Induction of prolonged survival of CD4+ T lymphocytes by intermittent IL-2 therapy in HIV-infected patients. J Clin Invest. 2005;115:2139–2148. doi: 10.1172/JCI23196. [DOI] [PMC free article] [PubMed] [Google Scholar]
- 8.Sereti I, Imamichi H, Natarajan V, et al. In vivo expansion of CD4CD45RO-CD25 T cells expressing foxP3 in IL-2-treated HIV-infected patients. J Clin Invest. 2005;115:1839–1847. doi: 10.1172/JCI24307. [DOI] [PMC free article] [PubMed] [Google Scholar]
- 9.Hellerstein MK. Measurement of T-cell kinetics: recent methodologic advances. Immunol Today. 1999;20:438–441. doi: 10.1016/s0167-5699(99)01529-7. [DOI] [PubMed] [Google Scholar]
- 10.Liang KY, Zeger SL. Longitudinal data analysis using generalized linear models. Biometrika. 1986;73:13–22. [Google Scholar]
- 11.Sereti I, Sklar P, Ramchandani MS, et al. CD4+ T Cell Responses to Interleukin-2 Administration in HIV-Infected Patients Are Directly Related to the Baseline Level of Immune Activation. J Infect Dis. 2007;196:677–683. doi: 10.1086/520087. [DOI] [PubMed] [Google Scholar]
- 12.de Boer AW, Markowitz N, Lane HC, et al. A randomized controlled trial evaluating the efficacy and safety of intermittent 3-, 4-, and 5-day cycles of intravenous recombinant human interleukin-2 combined with antiretroviral therapy (ART) versus ART alone in HIV-seropositive patients with 100-300 CD4+ T cells. Clin Immunol. 2003;106:188–196. doi: 10.1016/s1521-6616(02)00038-4. [DOI] [PubMed] [Google Scholar]
- 13.Markowitz N, Bebchuk JD, Abrams DI. Nadir CD4+ T cell count predicts response to subcutaneous recombinant interleukin-2. Clin Infect Dis. 2003;37:e115–120. doi: 10.1086/378293. [DOI] [PubMed] [Google Scholar]
- 14.Fox Z, Antunes F, Davey R, et al. Predictors of CD4 count change over 8 months of follow up in HIV-1-infected patients with a CD4 count>or=300 cells/microL who were assigned to 7.5 MIU interleukin-2. HIV Med. 2007;8:112–123. doi: 10.1111/j.1468-1293.2007.00440.x. [DOI] [PubMed] [Google Scholar]
- 15.Kovacs JA, Lempicki RA, Sidorov IA, et al. Identification of dynamically distinct subpopulations of T lymphocytes that are differentially affected by HIV. J Exp Med. 2001;194:1731–1741. doi: 10.1084/jem.194.12.1731. [DOI] [PMC free article] [PubMed] [Google Scholar]
- 16.Ribeiro RM, Mohri H, Ho DD, Perelson AS. Modeling deuterated glucose labeling of T-lymphocytes. Bull Math Biol. 2002;64:385–405. doi: 10.1006/bulm.2001.0282. [DOI] [PubMed] [Google Scholar]