

Abstract
Inflammatory bowel disease (IBD) results from a breakdown of tolerance towards the indigenous flora in genetically susceptible hosts. Failure of dendritic cells (DC) to interpret molecular microbial patterns appropriately when directing innate and adaptive immune responses is conceivable. Primary (conventional, non-monocyte generated) CD1c+CD11c+CD14-CD16-CD19- myeloid blood or mucosal dendritic cells (mDC) from 76 patients with Crohn's disease (CD) or ulcerative colitis (UC) in remission, during flare-ups (FU) and 76 healthy or non-IBD controls were analysed by fluorescence activated cell sorter (FACS) flow cytometry and real-time polymerase chain reaction. Cytokine secretion of freshly isolated, cultured and lipopolysaccharide (LPS)-stimulated highly purified mDC (purity >95%) was assessed using cytometric bead arrays (CBA). More cultured and stimulated circulating mDC express CD40 in IBD patients. Stimulated circulating mDC from IBD patients secrete significantly more tumour necrosis factor (TNF)-α and interleukin (IL)-8. Toll-like receptor (TLR)-4 expression by mDC was higher in remission and increased significantly in flaring UC and CD patients compared with remission (P < 0·05) and controls (P < 0·001). Fluorochrome-labelled LPS uptake by mDC was evaluated at different time-points over 24 h by measuring mean fluorescence intensity (MFI). Circulating mDC from IBD patients take up more LPS and the uptake begins earlier compared with controls (P < 0·05 in CD-FU and UC-FU at 24 h). The frequency of mucosal mDC (P < 0·05) and the number of CD40 expressing mucosal mDC is significantly greater in UC and CD compared with non-IBD controls (P < 0·001 versus P < 0·01, respectively). Our data suggest an aberrant LPS response of mDC in IBD patients, resulting in an inflammatory phenotype and possibly intestinal homing in acute flares.
Keywords: antigen presentation, dendritic cells, inflammation, lipopolysaccharide, Toll-like receptor (TLR)
Introduction
Breakdown of immunological tolerance towards the commensal microflora in genetically susceptible individuals is believed to be the major event in the pathogenesis of inflammatory bowel disease (IBD) [1,2].
The expression of a broad spectrum of molecular pattern recognition receptors (PRR) such as Toll-like receptors (TLR) on dendritic cells (DC) suggests their close interaction with microbes and microbial products, which in turn determines their influence on the resulting immune response, i.e. immunity versus tolerance [3,4]. Thus, DC are considered to be key for the initiation, perpetuation and control of inflammation in IBD [5].
Animal and in vitro studies suggest that DC falsely recognize commensal bacteria and may induce a T helper type 1 (Th1) or Th17 proinflammatory immune response directed normally at pathogens [6–8]. This could be due to exaggerated or dysregulated pathogen-associated molecular pattern (PAMP) recognition receptor responses [9]. Activated DC have been demonstrated in IBD animal models which may prolong the survival of activated T cells, thereby maintaining inflammation [10–13]. Human DC populations in IBD are characterized insufficiently. We have reported recently a correlation of peripheral DC subsets in IBD patients that correlates strikingly with the degree of inflammation and disease activity [14].
In this study, we demonstrate an aberrant response to lipopolysaccharide, a major component of bacterial cell walls, potent TLR-4 ligand and therefore prototypical microbial surrogate stimulus, by myeloid DC (mDC) from IBD patients, resulting in an inflammatory phenotype, preferred secretion of inflammatory cytokines and expression of co-stimulatory molecules required for T cell activation. This response may be due to an increased antigen uptake by activated DC, as we show in additional experiments. We provide preliminary evidence for the migratory capacity of activated human mDC.
Materials and methods
Patients and controls
Peripheral blood and mucosal tissue was obtained from patients (n = 76) with Crohn's disease (CD) (n = 29) or ulcerative colitis (UC) (n = 47) seen at our Inflammatory Bowel Disease Center and healthy controls (HC) (healthy volunteers, leucocyte filters from healthy blood donors or patients undergoing surgery for non-inflammatory conditions) (HC = 76). CD patients were characterized according to the Montreal Classification [15] (Table 1). Samples were analysed exclusively from carefully selected patients who had either never received steroids, biologics, immunomodulators and immunosuppressants or were off medication for at least 12 months. The study protocol was approved by Charité's institutional review board. All patients gave informed consent to the study.
Table 1.
Demographic data of patients and controls.
| (n) | % | Mean | Min | Max | |
|---|---|---|---|---|---|
| Number | 76 | ||||
| Ethnicity | |||||
| Caucasian | 76 | 100 | |||
| Crohn's disease | 29 | 37·7 | |||
| Male | 10 | 15·2 | |||
| Female | 19 | 28·8 | |||
| Age (years) | 39 | 19 | 75 | ||
| Disease duration (years) | 14 | 0 | 47 | ||
| Harvey Bradshaw Severity Index remission | 2 | 0 | 6 | ||
| Harvey Bradshaw Severity Index flare-up | 12 | 7 | 26 | ||
| Montreal classification | |||||
| A1 ≤16 years | 17·4 | ||||
| A2 17–40 years | 73·9 | ||||
| A3 >40 years | 8·7 | ||||
| L1 (terminal ileum) | 39·3 | ||||
| L2 (colon) | 3·6 | ||||
| L3 (ileocolon) | 50·0 | ||||
| L4 (upper GI only) | 0·0 | ||||
| L4+ (upper GI and distal disease) | 7·1 | ||||
| B1 (non-stricturing, non-penetrating) | 56·7 | ||||
| B2 (stricturing) | 30·0 | ||||
| B3 (internal penetrating) | 8·7 | ||||
| B3p (perianal penetrating) | 6·7 | ||||
| Extraintestinal disease manifestations | 25·0 | ||||
| Family history of IBD | 3·7 | ||||
| Active smoker | 25·0 | ||||
| Ex-smoker | 0·0 | ||||
| History of IBD-related surgeries | 34·5 | ||||
| Ulcerative colitis | 47 | 61·0 | |||
| Male | 18 | 27·3 | |||
| Female | 19 | 28·8 | |||
| Age (years) | 47 | 18 | 75 | ||
| Disease duration (years) | 12 | 0 | 43 | ||
| Modified Truelove Witts Index remission | 4 | 0 | 9 | ||
| Modified Truelove Witts Index flare-up | 12 | 10 | 16 | ||
| Disease extent | |||||
| Proctitis | 19·5 | ||||
| Proctosigmoiditis | 17·1 | ||||
| Left-sided colitis | 17·1 | ||||
| Pancolitis | 43·9 | ||||
| Pouchitis | 2·4 | ||||
| Extraintestinal disease manifestations | 16·7 | ||||
| Family history of IBD | 5·4 | ||||
| Active smoker | 16·7 | ||||
| Ex-smoker | 16·7 | ||||
| History of IBD-related surgeries | 5·3 | ||||
| Healthy controls | 76 |
IBD, inflammatory bowel disease; GI, gastrointestinal tract.
Scoring of disease activity
Two validated scores, the modified Truelove Witts Severity Index (MTWSI) for UC and the Harvey Bradshaw Severity Index (HBSI) for CD were used to assess disease activity [16,17]. UC patients who scored =10 on the MTWSI and CD patients who scored =7 on the HBSI were classified to have active disease (flare-up).
Isolation of peripheral blood mononuclear cells
Peripheral blood mononuclear cells (PBMC) were isolated using a protocol published previously [14]. Briefly, 40 ml of freshly drawn blood treated with NH4-heparin was diluted in phosphate-buffered saline (PBS) (PAA Laboratories, Pasching, Austria) + 2 mM ethylenediamine tetraacetic acid (EDTA) (Sigma, Steinheim, Germany) + 0·5% human serum (HS) type antibody (Cambrex, Charles City, IA, USA) and mixed well. Eighty ml of diluted blood were then layered carefully over 4 × 18 ml of Ficoll Paque (Pharmacia, Freiburg, Germany). The tubes were centrifuged without brakes at 1000 g for 20 min at 20°C. The interphase containing mononuclear cells was transferred into a new Falcon tube. Cells were washed twice in 10× of their volume magnetic affinity cell sorting (MACS) buffer, spun for 6 min at 575 g at 4°C and resuspended in MACS buffer containing PBS free of magnesium (Mg) and calcium (Ca) + 0·5% HS + 2 mM EDTA (Sigma).
Isolation of mucosal mononuclear cells
Lamina propria mononuclear cells (LPMC) were isolated using a modification of a previously described method [18]. CD45 positive cells were isolated using magnetic cell separation (MACS) following a protocol supplied by the manufacturer (Miltenyi Biotec, Bergisch Gladbach, Germany). The purity of the isolated cell population as assessed by fluorescence activated cell sorter (FACS) was routinely >95%.
Purification of blood mDC
mDC were isolated using magnetic cell separation from PBMC using CD1c (BDCA-1) antibodies and microbeads (Miltenyi Biotec) [14,19]. In blood the CD1c (BDCA-1) antigen is expressed specifically on DC, which are CD11c+ CD123-. Additionally, a subset of B cells also expresses this antigen. Thus, a depletion of B cells with CD19 microbeads is required prior to the enrichment of CD1c (BDCA-1) mDC. The purity of the isolated DC population was checked with FACS and samples with fewer than 95% mDC were discarded. The purified mDC population always tested negative for CD14+ cells.
Characterization of mucosal mDC
Following enrichment of mucosal CD45+ cells (see above) mDC were identified with CD1c (BDCA-1) antibodies and CD11c. Because there is some potential cross-reactivity with monocytes, granulocytes and B cells, when using the CD1c and CD11c antibodies to identify mDC, these populations were removed from the analysis by using exclusion gates on anti-CD14 and anti-CD19 positive cells prior to double staining with CD11c and CD1c.
Antibodies
Monoclonal antibodies against CD11c, CD14, CD19, CD40 and CD45 were obtained from BD Biosciences (Heidelberg, Germany) and against CD1c (BDCA-1) (Miltenyi Biotec) as fluorochrome conjugates. Streptavidin–fluorescein isothiocyanate (FITC), streptavidin–phycoerythrin (PE), and streptavidin–allophycocyanin (APC) were purchased from Caltag (San Diego, CA, USA) and used to detect reactivity of biotinylated primary antibodies. Fluorochrome-conjugated isotype-matched control antibodies against mouse immunoglobulin (Ig)G1 and IgG2b (BD Biosciences) as well as mouse IgG2a (Caltag) were used to control for non-specific reactivity.
Culture and stimulation of mDC
Highly purified (>95%) mDC were cultured for 21 h in RPMI-1640 with 0·2 % L-glutamine (Gibco, New York, NY, USA) + 10% fetal calf serum (FCS) (Invitrogen, Karlsruhe, Germany), + 1% penicillin–streptomycin + 1% pyruvate (Gibco). For stimulation experiments lipopolysaccharide (LPS) from Escherichia coli 055:5 (Calbiochem, Darmstadt, Germany) was added at a concentration of 100 ng/ml. Supernatants were collected for detection of secreted cytokines. mDC were harvested and phenotyped by FACS.
FACS analysis of mDC
Three- or four-colour flow cytometric analysis (FACS) was used to identify and enumerate myeloid blood DC as described previously [14,20]. In some experiments mean fluorescence intensity (MFI) of fluorochrome-labelled cells was quantified using FACS. Cells were resuspended in 50 µl FACS buffer and placed on ice. The appropriate amount of antibody was added and the cells were incubated for 15 min on ice in the dark. After three washes in FACS buffer they were analysed immediately on a FACSCalibur (BD Biosciences) flow cytometer. Prior to running the samples on the flow cytometer, propidium iodide (PI) 1:1000 of a 1 mg/ml stock (Sigma, St Louis, MO, USA) was added to label dead cells. Data were analysed using CellQuest™ (BD Biosciences) software. Advanced gating strategies were used to exclude dead, i.e. PI positive, cells and debris.
Analysis of cytokine secretion by mDC
Cytokine secretion in culture supernatants was measured by cytometric bead array (CBA) analysis (BD Biosciences), according to the manufacturer's guidelines. Briefly, bead populations with distinct fluorescence intensities coated with capture antibody proteins were first mixed with PE-conjugated detection antibodies and recombinant standards or test samples, and then incubated to form sandwich complexes. After acquisition of sample data using FACS, the cytokine concentrations were calculated using the proprietary FCAP™ (Softflow, New Brighton, MN, USA) analysis software [21,22].
RNA isolation, cDNA synthesis and real-time polymerase chain reaction (PCR) of TLR-4 and TLR-2
RNA was prepared from freshly isolated mDC by using the RNeasy Mini Kit (Qiagen, Hilden, Germany), following the manufacturer's instructions. In brief, freshly isolated cells were lysed in 350 µl RLT-buffer + 3·5 µl β-mercaptoethanol and total RNA was extracted to a total volume of 30 µl. cDNA was synthesized using the Advantage™ reverse transcription–PCR Kit (Clontech, Mountain View, CA, USA); 12·5 µl of the isolated RNA were used for cDNA synthesis. Expression of TLR-4 and TLR-2 was analysed by quantitative real-time PCR using specific commercially available primers (TLR-4: PPH01795E-200; TLR-2: PPH01808A-200; hypoxanthine-guanine phosphoribosyltransferase (HPRT): PPH01018B-200) and the SYBR Green dye (Super Array, Frederick, MD, USA) as the fluorescent reporter. PCR reactions were performed with 1 µg of cDNA using an ABI PRISM 7500 Fast Lightcycler (Applied Biosystems, Foster City, CA, USA). Relative quantification was assessed by using the formula 2–ΔCT and by normalizing the amount of the target gene to the housekeeping gene HPRT. The real-time PCR program consisted of one cycle of 95°C for 15 min, following 40 cycles of 95°C for 15 s, 60°C for 1 min. The dissociation was carried out at 95°C for 15 s, 60°C for 1 min and 95°C for 15 s.
Quantification of antigen uptake by mDC
Fluorochrome-conjugated LPS was used to study antigen uptake by mDC using a protocol published previously [23,24]. Briefly, 2 × 10⁴ mDC were incubated for 3, 6, 12, 18 and 24 h in DC culture medium supplemented with Alexa Fluor 488-labelled LPS at a final concentration of 2 µg/ml. Unstimulated mDC served as negative controls. After incubation cells were harvested and each well was rinsed three times with 150 µl PBS. The cell suspension was centrifuged and the cell pellet was washed twice with PBS to remove unincorporated LPS. Cells were finally washed with FACS buffer [PBS + 0·05% bovine serum albumin (BSA) (Sigma) + 0·1% NaN3 (Sigma)]. Finally, MFI was measured by FACS at the respective time-points following culture. The final MFI was calculated by subtracting the MFI of the negative controls.
Statistical analysis
For all studies data are expressed as mean ± standard error of the mean. Comparisons are by a two-tailed Student's t-test with statistical significance accepted for P < 0·05. The analysis was performed with spss Science 16 (SPSS, Chicago, IL, USA) software.
Results
More mDC from IBD patients display an activated phenotype upon LPS stimulation than controls
As we hypothesize that mDC from IBD patients may induce and/or perpetuate inflammation, we investigated how they regulate their phenotype in response to LPS, a prototypical microbial antigen they may encounter in the gut [3]. Expression of CD40, a co-stimulatory molecule known to be up-regulated on mature, activated DC and critical for T cell activation was studied [25,26].
In UC, the fraction of CD40 expressing mDC was significantly higher in cultured mDC (RM 26·89 ± 7·82% versus FU 23·78 ± 4·8%) compared with controls (2·18 ± 0·67%). LPS stimulation increased further the number of CD40 expressing mDC (RM 82·88 ± 7·20% versus FU 83·12 ± 4·20%) compared with controls (22·34 ± 9·91%) (Figs 1a and 2a).
Fig. 1.

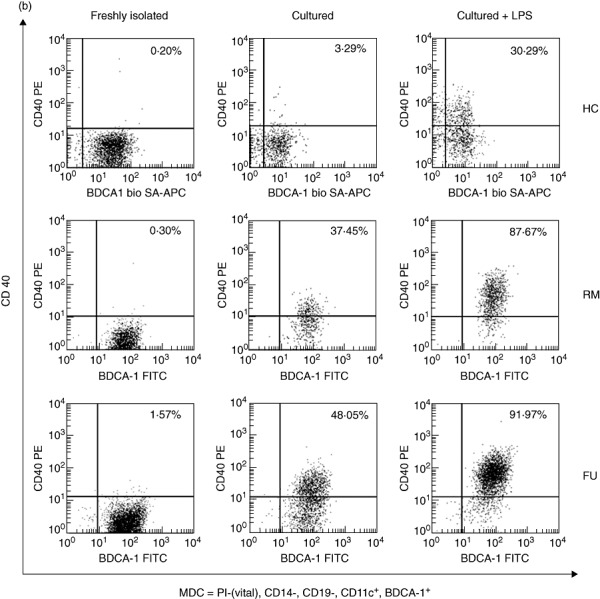
CD40 expression by myeloid dendritic cells (mDC). More cultured and lipopolysaccharide (LPS)-stimulated, but not freshly isolated (data not shown) mDC, express CD40 in inflammatory bowel disease (IBD) compared with healthy controls. Fluorescence activated cell sorter (FACS) plots from representative experiments. Quadrant thresholds were placed determined according to isotype controls. HC, healthy control; RM, remission; FU, flare-up. (a) Ulcerative colitis. (b) Crohn's disease.
Fig. 2.

CD40 expression by myeloid dendritic cells (mDC). More cultured and lipopolysaccharide (LPS)-stimulated, but not freshly isolated (data not shown) mDC, express CD40 in IBD compared with healthy controls. Bar graphs summarize data from 10 patients or controls in each category. HC, healthy control; RM, remission; FU, flare-up. Asterisks denote statistical significance *P < 0·05, **P < 0·01, ***P < 0·001. (a) Ulcerative colitis. Cultured (top) and cultured with LPS (bottom). (b) Crohn's disease. Cultured (top) and cultured with LPS (bottom).
A similar pattern was seen in CD. The fraction of CD40 expressing mDC was significantly higher in cultured mDC (RM 23·85 ± 4·25% versus FU 52·11 ± 5·47%) compared with controls (2·18 ± 0·67%). LPS stimulation increased this expression further (RM 74·56 ± 11·19% versus FU 90·69 ± 1·49%) compared with controls (22·34 ± 9·91%) (Figs 1b and 2b).
In contrast, there was no significant difference between CD40 expressing mDC between IBD patients (UC RM 0·51 ± 0·12% versus FU 1·6 ± 0·8%; CD RM 0·62 ± 0·17% versus FU 1·07 ± 0·29%) and healthy controls (0·29 ± 0·10%) in freshly isolated cells (data not shown).
Overall, CD40 regulation was comparable between CD and UC, except that in CD the expression during flare-ups was slightly higher than in remission in cultured and stimulated mDC.
mDC from IBD patients secrete more inflammatory cytokines upon LPS stimulation than controls
Because our analysis identified an activated, more mature phenotype of cultured and LPS-stimulated mDC in IBD patients, we went on to investigate the secretion of key IBD cytokines known to be produced by DC such as tumour necrosis factor (TNF)-α and interleukin (IL)-8.
Cultured mDC from IBD patients secreted up to 1·8 times more TNF-α compared with healthy controls, but overall small amounts with no significant differences between all groups and substantially less than stimulated cells (data not shown). LPS-stimulated mDC from UC patients (RM 603·90 ± 91·52 versus FU 384 ± 83·59 pg/ml) (Fig. 3a) and CD (RM 492·80 ± 110·30 versus FU 314·70 ± 85·25 pg/ml) (Fig. 3b) secreted significantly more TNF-α than controls (167·10 ± 17·90 pg/ml).
Fig. 3.

Tumour necrosis factor (TNF)-α secretion by myeloid dendritic cells (mDC). Lipopolysaccharide (LPS)-stimulated mDC from inflammatory bowel disease (IBD) patients secrete significantly more TNF-α than healthy controls. Bar graphs summarize data from 10 patients or controls in each category. HC, healthy control; RM, remission; FU, flare-up. Asterisks denote statistical significance *P < 0·05, **P < 0·01. (a) Ulcerative colitis. (b) Crohn's disease.
Cultured mDC from both UC and CD patients secreted approximately 1·5 times more IL-8 than healthy controls, but overall small amounts with no significant differences between all groups and substantially less compared with stimulated cells (data not shown). LPS-stimulated mDC from patients with UC (RM 73 783·00 ± 11 223·00 versus FU 72 145 ± 16 661 pg/ml) (Fig. 4a) and CD (RM 42 049·00 ± 19 919·00 versus FU 61 978·00 ± 13 075 pg/ml) (Fig. 4b) secreted significantly more IL-8 than controls (24 385·00 ± 7892·00 pg/ml).
Fig. 4.
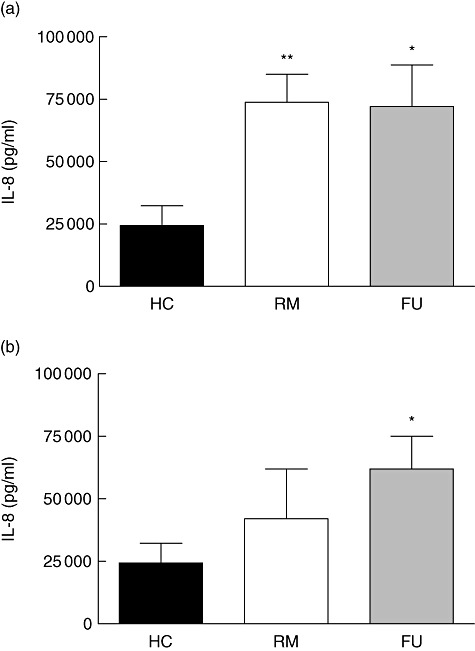
Interleukin (IL)-8 secretion by myeloid dendritic cells (mDC). Lipopolysaccharide (LPS)-stimulated mDC from inflammatory bowel disease (IBD) patients secrete significantly more IL-8 than healthy controls. Bar graphs summarize data from 10 patients or controls in each category. HC, healthy control; RM, remission; FU, flare-up. Asterisks denote statistical significance *P < 0·05, **P < 0·01. (a) Ulcerative colitis. (b) Crohn's disease.
mDC from IBD patients show increased TLR-4 and TLR-2 expression at mRNA level
Immune responses to LPS are mediated mainly by TLR-4 [27]. However, as even highly purified LPS may be contaminated with endotoxin we also looked at TLR-2 expression [28]. Both engagement of TLR-4 and TLR-2 can mediate the observed production of inflammatory cytokines. Thus, we compared its expression profiles by mDC by real-time PCR at mRNA level (Fig. 5) [29,30].
Fig. 5.
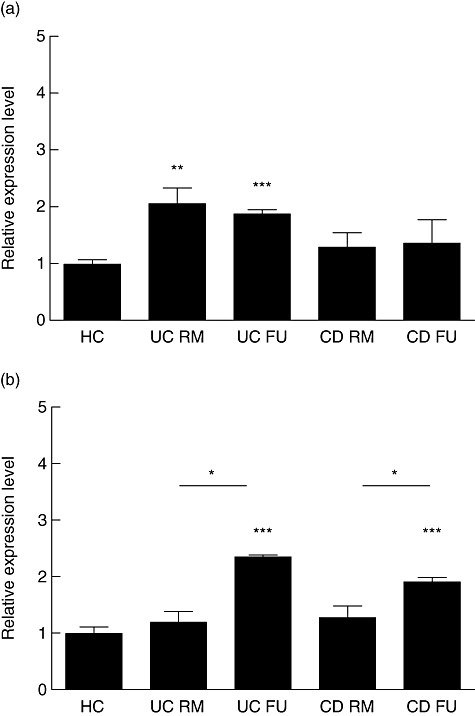
Toll-like receptor (TLR)-4 and TLR-2 expression. Human myeloid dendritic cells (mDC) from healthy controls, patients with ulcerative colitis and Crohn's disease were analysed for the mRNA expression levels of TLR-4 and TLR-2 using real-time reverse transcription–polymerase chain reaction. Bar graphs summarize data from eight patients or controls in each category. HC, healthy control; RM, remission; FU, flare-up; UC, ulcerative colitis; CD, Crohn's disease. Asterisks denote statistical significance *P < 0·05, **P < 0·01, ***P < 0·001. (a) TLR-4. (b) TLR-2.
While expression of TLR-4 appeared to be increased slightly in both UC (1·2 ± 0·18) and CD (1·3 ± 0·19) patients in remission compared with healthy controls, this difference did not reach statistical significance. However, TLR-4 expression was increased significantly in flaring UC (2·4 ± 0·03) and CD (1·9 ± 0·07) patients compared with both patients in remission (P < 0·05) and healthy controls (P < 0·001) (Fig. 5a).
In contrast, TLR-2 did not follow this expression pattern. In UC, both patients in remission (2·1 ± 0·27) and during flare-ups (1·9 ± 0·07) had a significantly (P < 0·001 versus P < 0·01, respectively) increased TLR-2 expression compared with controls. No significant differences were detected between healthy controls and CD patients in remission (1·3 ± 0·25) and flare-ups (1·4 ± 0·4) (Fig. 5b).
Increased LPS uptake by mDC in IBD patients
Because our previous experiments revealed an increased TLR-4 receptor expression, activated phenotype and inflammatory response of IBD mDC to LPS, we decided to investigate their LPS uptake, as this is the first step in antigen presentation that could contribute to their aberrant LPS response.
We found that mDC from UC patients in remission showed increased LPS uptake compared with healthy controls (MFI at 18 h UC 33·16 ± 3·07% versus HC 31·26 ± 3·17%; MFI at 24 h UC 51·04 ± 4·74% versus HC 38·09 ± 3·50%), beginning at approximately 18 h of culture which continues until 24 h (Fig. 6a, top). However, in mDC from flaring UC patients the increased LPS uptake compared with healthy controls is already apparent at 3 h, continues until 24 h and reaches statistical significance (P < 0·05 at 3, 6, 18 and 24 h) (Fig. 6a, bottom).
Fig. 6.

Increased lipopolysaccharide (LPS) uptake by myeloid dendritic cells (mDC) in active inflammatory bowel disease (IBD). mDC from patients with active IBD take up more Alexa 488-labelled LPS than healthy controls. Mean fluorescence intensity was assessed over 24 h by fluorescence activated cell sorter. Six ulcerative colitis (UC), six Crohn's disease (CD) patients and six healthy controls (HC) were studied and data from five time-points analysed. At linear regression analysis of analysed time-points all curves show an excellent quality of fit (r2 > 0·95). RM, remission; FU, flare-up. Asterisks denote statistical significance *P < 0·05. (a) Ulcerative colitis. Remission (top) and flare-up (bottom) versus healthy control. (b) Crohn's disease. Remission (top) and flare-up (bottom) versus healthy control.
The situation in CD is similar. Overall mDC from CD patients took up slightly more LPS than their counterparts in UC. We found that mDC from CD patients in remission showed a slightly higher LPS uptake compared with healthy controls over the entire 24-h culture period (Fig. 6b, top). In mDC from flaring CD patients the increased LPS uptake compared with healthy controls is already apparent at 3 h, continues until 24 h and reaches statistical significance (P < 0·05 at 3 and 24 h) (Fig. 6b, bottom).
Increased frequency of activated mDC among LPMC in IBD patients
It is conceivable that circulating blood DC in active IBD migrate to secondary lymphatic organs and sites of inflammation. Having demonstrated previously the expression of gut homing markers on circulating myeloid DC we evaluated mDC from colonic mucosal specimens from patients undergoing surgery for refractory IBD and from controls that underwent colonic resection for non-inflammatory conditions, such as diverticulosis [14]. mDC frequency in the inflamed mucosa and expression of the activation and maturation markers CD40 were enumerated and evaluated by FACS, respectively.
We found a significantly higher frequency of mDC in the inflamed mucosa of UC patients (0·93 ± 0·57% of LPMC) and CD patients (0·63 ± 0·17% of LPMC) compared with controls (0·24 ± 0·05% of LPMC) (Fig. 7). Furthermore, a significantly higher number of mDC expressed the activation markers CD40 compared with non-IBD controls (Fig. 7a).
Fig. 7.

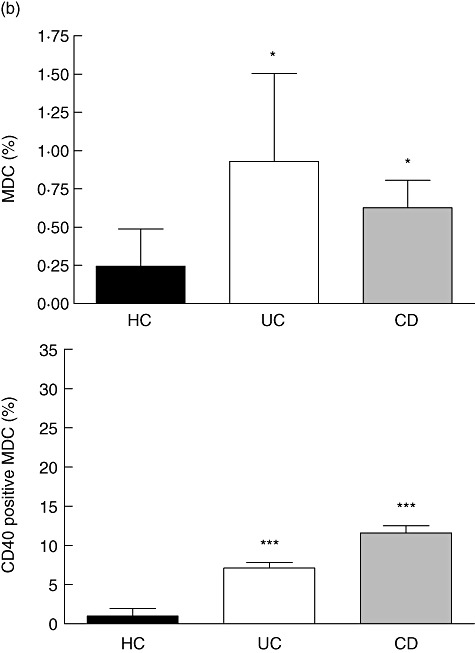
Increased frequency of activated mDC in the inflamed mucosa. We found an increased frequency of mDC in patients with active inflammatory bowel disease (IBD) but not in controls. More mucosal mDC from IBD patients display an activated phenotype with an increased fraction of CD40 expressing cells. Quadrant thresholds were placed according to isotype controls. UC, ulcerative colitis; CD, Crohn's disease; HC, non-IBD-control; RM, remission; LPMC, lamina propria mononuclear cells; FU, flare-up. Asterisks denote statistical significance *P < 0·05, **P < 0·01, ***P < 0·001. (a) Fluorescence activated cell sorter plots from representative experiments. (b) Bar graphs summarizing data from 10 patients or controls in each category.
In UC, the frequency of CD40 expressing mucosal mDC was 7·12 ± 0·72% versus 0·98 ± 0·34% in non-IBD controls. In CD, we found a frequency of CD40 expression of mucosal mDC of 11·60 ± 0·90% versus 0·98 ± 0·34% in non-IBD controls.
Discussion
Several animal studies suggest the active involvement of DC in the pathogenesis of IBD, but little is known about conventional, non-monocyte-generated human DC and their handling of microbial antigens in IBD [10–13,31–35].
We show that a significantly greater number of cultured mDC in both UC and CD express CD40 compared with healthy controls. In CD, but not UC, the frequency of CD40 expressing mDC is slightly higher in flaring patients than in remission. This correlates with a slightly higher number of CD40 expressing mucosal mDC in IBD patients (see below) and may reflect the intrinsic difference in the regulation of T cell activation in both conditions.
In contrast, the phenotype from freshly isolated cells does not differ from healthy controls. These data are in line with previous reports and biologically plausible, as one would not expect activated DC or the encounter of LPS in the peripheral circulation (except in sepsis), as this would cause Paul Ehrlich's ‘horror autotoxicus’[14,36,37]. While cell culture can prime DC, their suspected, hyperactive phenotype was only unmasked fully by the addition of LPS.
Our data cannot be compared directly with other studies, as the authors either did not distinguish between remission and flare-ups [38–40], worked with monocyte-generated DC (MoDC) [38,39], failed to identify DC unequivocally by using unspecific markers such as CD83 [38,39] or included patients currently on [38,39] immunomodulators and immunosuppressants, impacting potentially on DC function and phenotype. Monocyte-derived and conventional DC originate from different progenitors and are phenotypically and functionally distinct [41]. With these important limitations in mind, two studies reported increased expression of CD83 and CD86 in monocyte-generated DC in patients with UC [38,39] and one study an increased expression of CD40 and CD86 in both CD and UC patients [40].
We demonstrate that mDC from both UC and CD patients secrete significantly greater amounts of the two prototypic IBD inflammatory cytokines TNF-α and IL-8 upon contact with LPS. Another group recently studied the response of peripheral blood mononuclear cells (PMBC) stimulated with CpG A and B DNA motifs (two TLR-9 ligands) and muramyl dipeptide (MDP) (a TLR-4 ligand) in nucleotide binding oligomerization domain 2 (NOD2) homozygous CD patients [42]. The authors reported differences in TNF-α and IL-8 production between wild-type and NOD2 mutant cells to CpG compared only with CpG plus MDP-stimulated cells, which was absent in NOD2 mutant CD patients and concluded ‘lost synergy’ between TLR-9 and NOD2 responses. As the authors made no effort to identify the PBMC leucocyte subsets responsible for respective TLR-9 and TLR-4 ligand responses, these data are difficult to interpret. Many different immune cell subsets within PBMC and also their mutual interaction could explain the observed responses. It can only be assumed that plasmacytoid DC accounted for the TLR-9 response and monocytes and mDC for the TLR-4 response. Most plasmacytoid cells are thought generally to be tolerogenic, i.e. dampen inflammatory responses and make no TNF-α, unless stimulated very specifically [43–45]. Thus, the observation of this group is restricted to an absent TNF-α and IL-8 production in response to MDP in NOD2 mutant in mainly quiescent CD patients, some of whom were on azathioprine or prednisolone that may have contributed to this inertia.
We investigated a highly purified conventional, non-monocyte-generated mDC –not a cell mixture – in inflammatory bowel patients off immunomodulators, steroids or biologics, used a different TLR-4 ligand (LPS) as well as other culture conditions, and observed an exaggerated LPS response in both UC and CD. Therefore, we are not surprised to report a different experimental outcome.
An increased secretion of these cytokines upon contact with microbial antigens probably encountered in the gut, such as LPS, attracts other leucocytes, and may contribute thereby to the perpetuation of inflammation known to occur in IBD.
Having demonstrated these phenotypic differences, we aimed to investigate potential mechanisms further by looking at receptor expression and antigen uptake by mDC. Because immune responses to LPS are mediated mainly by TLR-4 we compared its expression profiles by mDC by real-time PCR at mRNA level and found an increased expression in IBD patients [29,30]. Sophisticated DC antigen sampling mechanisms have been described recently in in vitro and animal studies [46,47]. Because we observed a distinct response of IBD mDC to LPS, we decided to study their uptake of fluorochrome-labelled LPS and indeed found differences between IBD patients and healthy controls. While an increased LPS uptake can be already observed in mDC from IBD in remission when cultured for an extended period of time, mDC from flaring IBD patients take up substantially more LPS from the very beginning and increases continue over the entire culture period of 24 h.
Furthermore, we detected an increased frequency of mucosal mDC in inflamed mucosal segments of patients with UC and also CD. This confirms reports from studies in IBD animal models, where subepithelial DC clusters and an accumulation in the lamina propria of the inflamed colonic mucosa were described [11–13]. Several studies in human IBD attempted to enumerate DC by FACS or immunohistochemistry in the human colonic mucosa. Some of them reported an increased frequency and correlation with inflammatory activity mainly in UC [38,39,48–50]. Unfortunately, none of them identified DC unequivocally, as either only CD83 or CD209 antibodies were employed, which are known to be expressed by a number of other leucocytes such as monocytes, B cells and lymphoblasts or cross-react with monocytes, vascular and lymphoid endothelium, respectively. Moreover, we found an increased fraction of mucosal mDC to display an activated phenotype in IBD, as indicated by the expression of the co-stimulatory molecule CD40, critical for T cell activation [25,26,51]. The greater number of CD40-expressing mucosal mDC in CD and UC correlates with cultured circulating mDC from IBD patients and is in line with CD40 expression data on myeloid DC in CD in two other studies [40,52]. CD40–CD40L interactions have been identified for the development and control of inflammation in several IBD animal models [10,13,53,54]. Up-regulated CD40L expression has been reported in mucosal lesions of human IBD, and CD40 ligation is furthermore associated with increased nuclear factor (NF)-κB activation and secretion of inflammatory cytokines in human colonic fibroblasts [55–58].
The reported expression of α4β7, a decreased mDC frequency correlating with disease activity in human IBD in conjunction with the shown increased frequency of mucosal mDC suggests an egress from the blood pool and migration of immature DC to the inflamed gut. However, our data provide no formal proof for this hypothesis, as labelling cells as in animal studies is not ethically feasible in humans [14].
We are aware of potential limitations to the interpretation of our data. One problem lies with the inconsistent description and characterization of the many types of DC and their separation from other leucocytes [4,59]. Several other mDC subsets have been reported in humans, including MoDC [37]. We focused on mDC-1 [CD1c+ (BDCA-1)+, CD11c+, CD14-, CD19-] DC, as previous work from our group demonstrated that their frequencies in IBD patients correlate strikingly with disease activity and is sufficient for conducting functional studies, unlike mDC-2 [CD141 (BDCA-3)+] mDC [14].
The observed inflammatory response of mDC and postulated migration to the gut may also occur in other intestinal inflammatory conditions, such as infectious colitis or diverticulitis (not studied in this project). However, the fact that even mDC from IBD patients in remission show a more pronounced inflammatory response to LPS than control mDC argues strongly against this notion, and suggests an intrinsic mDC defect or regulatory problem. Preliminary evidence for this comes from our TLR-4 expression and labelled LPS uptake experiments that demonstrate differences for both IBD patients and remission and during acute flare-ups. This interpretation is also supported indirectly by genetic data that show mutations in the TLR-4 receptor in IBD patients and a generally higher expression of TLR-4 (and TLR-2) and by DC in IBD [9,52]. TLR-4 expression or TLR-4 receptor polymorphisms, however, do not explain fully the inflammatory LPS response by IBD mDC in remission. The correlation between LPS uptake and inflammatory cytokine secretion in remission suggests that mDC from IBD patients may also use non-TLR-4-mediated LPS signalling pathways, which have been described elsewhere [60].
In summary, we demonstrate an inflammatory phenotype, preferred secretion of inflammatory cytokines and expression of co-stimulatory molecules required for T cell activation by human mDC in patients with IBD. This response may be due to an increased TLR-4 expression and antigen uptake by activated mDC in IBD. The increased frequency of activated mDC in the inflamed mucosa of IBD patients could indicate migration of DC to the gut in acute flares.
Acknowledgments
This work was supported by research grants of the Eli & Edythe L. Broad Foundation, Los Angeles, CA, USA, in part by the Fritz Bender Foundation, Munich, Germany and a Charité Medical School, Humboldt-University Bonus Research Grant to D. C. B.
Disclosure
None.
References
- 1.Xavier RJ, Podolsky DK. Unravelling the pathogenesis of inflammatory bowel disease. Nature. 2007;448:427–34. doi: 10.1038/nature06005. [DOI] [PubMed] [Google Scholar]
- 2.Baumgart DC, Carding SR. Inflammatory bowel disease: cause and immunobiology. Lancet. 2007;369:1627–40. doi: 10.1016/S0140-6736(07)60750-8. [DOI] [PubMed] [Google Scholar]
- 3.Iwasaki A, Medzhitov R. Toll-like receptor control of the adaptive immune responses. Nat Immunol. 2004;5:987–95. doi: 10.1038/ni1112. [DOI] [PubMed] [Google Scholar]
- 4.Iwasaki A. Mucosal dendritic cells. Annu Rev Immunol. 2007;25:381–418. doi: 10.1146/annurev.immunol.25.022106.141634. [DOI] [PubMed] [Google Scholar]
- 5.Kelsall BL, Leon F. Involvement of intestinal dendritic cells in oral tolerance, immunity to pathogens, and inflammatory bowel disease. Immunol Rev. 2005;206:132–48. doi: 10.1111/j.0105-2896.2005.00292.x. [DOI] [PubMed] [Google Scholar]
- 6.Uhlig HH, Powrie F. Dendritic cells and the intestinal bacterial flora: a role for localized mucosal immune responses. J Clin Invest. 2003;112:648–51. doi: 10.1172/JCI19545. [DOI] [PMC free article] [PubMed] [Google Scholar]
- 7.Strober W, Fuss IJ, Blumberg RS. The immunology of mucosal models of inflammation. Annu Rev Immunol. 2002;20:495–549. doi: 10.1146/annurev.immunol.20.100301.064816. [DOI] [PubMed] [Google Scholar]
- 8.Steinman L. A brief history of T(H)17, the first major revision in the T(H)1/T(H)2 hypothesis of T cell-mediated tissue damage. Nat Med. 2007;13:139–45. doi: 10.1038/nm1551. [DOI] [PubMed] [Google Scholar]
- 9.Franchimont D, Vermeire S, El HH, et al. Deficient host–bacteria interactions in inflammatory bowel disease? The Toll-like receptor (TLR)-4 Asp299gly polymorphism is associated with Crohn's disease and ulcerative colitis. Gut. 2004;53:987–92. doi: 10.1136/gut.2003.030205. [DOI] [PMC free article] [PubMed] [Google Scholar]
- 10.Malmstrom V, Shipton D, Singh B, et al. CD134L expression on dendritic cells in the mesenteric lymph nodes drives colitis in T cell-restored SCID mice. J Immunol. 2001;166:6972–81. doi: 10.4049/jimmunol.166.11.6972. [DOI] [PubMed] [Google Scholar]
- 11.Leithauser F, Trobonjaca Z, Moller P, Reimann J. Clustering of colonic lamina propria CD4(+) T cells to subepithelial dendritic cell aggregates precedes the development of colitis in a murine adoptive transfer model. Lab Invest. 2001;81:1339–49. doi: 10.1038/labinvest.3780348. [DOI] [PubMed] [Google Scholar]
- 12.Krajina T, Leithauser F, Moller P, Trobonjaca Z, Reimann J. Colonic lamina propria dendritic cells in mice with CD4+ T cell-induced colitis. Eur J Immunol. 2003;33:1073–83. doi: 10.1002/eji.200323518. [DOI] [PubMed] [Google Scholar]
- 13.Cruickshank SM, English NR, Felsburg PJ, Carding SR. Characterization of colonic dendritic cells in normal and colitic mice. World J Gastroenterol. 2005;11:6338–47. doi: 10.3748/wjg.v11.i40.6338. [DOI] [PMC free article] [PubMed] [Google Scholar]
- 14.Baumgart DC, Metzke D, Schmitz J, et al. Patients with active inflammatory bowel disease lack immature peripheral blood plasmacytoid and myeloid dendritic cells. Gut. 2005;54:228–36. doi: 10.1136/gut.2004.040360. [DOI] [PMC free article] [PubMed] [Google Scholar]
- 15.Silverberg MS, Satsangi J, Ahmad T, et al. Toward an integrated clinical, molecular and serological classification of inflammatory bowel disease: report of a Working Party of the 2005 Montreal World Congress of Gastroenterology. Can J Gastroenterol. 2005;19(Suppl. A):5–36. doi: 10.1155/2005/269076. [DOI] [PubMed] [Google Scholar]
- 16.D'Haens G, Sandborn WJ, Feagan BG, et al. A review of activity indices and efficacy end points for clinical trials of medical therapy in adults with ulcerative colitis. Gastroenterology. 2007;132:763–86. doi: 10.1053/j.gastro.2006.12.038. [DOI] [PubMed] [Google Scholar]
- 17.Sandborn WJ, Feagan BG, Hanauer SB, et al. A review of activity indices and efficacy endpoints for clinical trials of medical therapy in adults with Crohn's disease. Gastroenterology. 2002;122:512–30. doi: 10.1053/gast.2002.31072. [DOI] [PubMed] [Google Scholar]
- 18.Baumgart DC, Olivier WA, Reya T, Peritt D, Rombeau JL, Carding SR. Mechanisms of intestinal epithelial cell injury and colitis in interleukin 2 (IL2)-deficient mice. Cell Immunol. 1998;187:52–66. doi: 10.1006/cimm.1998.1307. [DOI] [PubMed] [Google Scholar]
- 19.Dzionek A, Fuchs A, Schmidt P, et al. BDCA-2, BDCA-3, and BDCA-4: three markers for distinct subsets of dendritic cells in human peripheral blood. J Immunol. 2000;165:6037–46. doi: 10.4049/jimmunol.165.11.6037. [DOI] [PubMed] [Google Scholar]
- 20.Thomas S, Przesdzing I, Metzke D, Schmitz J, Radbruch A, Baumgart DC. Saccharomyces boulardii inhibits lipopolysaccharide-induced activation of human dendritic cells and T cell proliferation. Clin Exp Immunol. 2009;156:78–87. doi: 10.1111/j.1365-2249.2009.03878.x. [DOI] [PMC free article] [PubMed] [Google Scholar]
- 21.Carson RT, Vignali DA. Simultaneous quantitation of 15 cytokines using a multiplexed flow cytometric assay. J Immunol Methods. 1999;227:41–52. doi: 10.1016/s0022-1759(99)00069-1. [DOI] [PubMed] [Google Scholar]
- 22.Chen R, Lowe L, Wilson JD, et al. Simultaneous quantification of six human cytokines in a single sample using microparticle-based flow cytometric technology. Clin Chem. 1999;45:1693–4. [PubMed] [Google Scholar]
- 23.Suzuki M, Hisamatsu T, Podolsky DK. Gamma interferon augments the intracellular pathway for lipopolysaccharide (LPS) recognition in human intestinal epithelial cells through coordinated up-regulation of LPS uptake and expression of the intracellular Toll-like receptor 4-MD-2 complex. Infect Immun. 2003;71:3503–11. doi: 10.1128/IAI.71.6.3503-3511.2003. [DOI] [PMC free article] [PubMed] [Google Scholar]
- 24.Mueller T, Terada T, Rosenberg IM, Shibolet O, Podolsky DK. Th2 cytokines down-regulate TLR expression and function in human intestinal epithelial cells. J Immunol. 2006;176:5805–14. doi: 10.4049/jimmunol.176.10.5805. [DOI] [PubMed] [Google Scholar]
- 25.McLellan AD, Sorg RV, Williams LA, Hart DN. Human dendritic cells activate T lymphocytes via a CD40: CD40 ligand-dependent pathway. Eur J Immunol. 1996;26:1204–10. doi: 10.1002/eji.1830260603. [DOI] [PubMed] [Google Scholar]
- 26.Cella M, Scheidegger D, Palmer-Lehmann K, Lane P, Lanzavecchia A, Alber G. Ligation of CD40 on dendritic cells triggers production of high levels of interleukin-12 and enhances T cell stimulatory capacity: T-T help via APC activation. J Exp Med. 1996;184:747–52. doi: 10.1084/jem.184.2.747. [DOI] [PMC free article] [PubMed] [Google Scholar]
- 27.Hoshino K, Takeuchi O, Kawai T, et al. Cutting edge: Toll-like receptor 4 (TLR4)-deficient mice are hyporesponsive to lipopolysaccharide: evidence for TLR4 as the LPS gene product. J Immunol. 1999;162:3749–52. [PubMed] [Google Scholar]
- 28.Hirschfeld M, Ma Y, Weis JH, Vogel SN, Weis JJ. Cutting edge: repurification of lipopolysaccharide eliminates signaling through both human and murine Toll-like receptor 2. J Immunol. 2000;165:618–22. doi: 10.4049/jimmunol.165.2.618. [DOI] [PubMed] [Google Scholar]
- 29.Medzhitov R, Janeway C., Jr Innate immunity. N Engl J Med. 2000;343:338–44. doi: 10.1056/NEJM200008033430506. [DOI] [PubMed] [Google Scholar]
- 30.Medzhitov R, Preston-Hurlburt P, Janeway CA., Jr A human homologue of the Drosophila Toll protein signals activation of adaptive immunity. Nature. 1997;388:394–7. doi: 10.1038/41131. [DOI] [PubMed] [Google Scholar]
- 31.Ashcroft AJ, Cruickshank SM, Croucher PI, et al. Colonic dendritic cells, intestinal inflammation, and T cell-mediated bone destruction are modulated by recombinant osteoprotegerin. Immunity. 2003;19:849–61. doi: 10.1016/s1074-7613(03)00326-1. [DOI] [PubMed] [Google Scholar]
- 32.Ishiguro Y, Sakuraba H, Yamagata K, Munakata A. The presentation of haptenated proteins and activation of T cells in the mesenteric lymph nodes by dendritic cells in the TNBS colitis rat. Ann NY Acad Sci. 2004;1029:346–7. doi: 10.1196/annals.1309.017. [DOI] [PubMed] [Google Scholar]
- 33.Karlis J, Penttila I, Tran TB, et al. Characterization of colonic and mesenteric lymph node dendritic cell subpopulations in a murine adoptive transfer model of inflammatory bowel disease. Inflamm Bowel Dis. 2004;10:834–47. doi: 10.1097/00054725-200411000-00018. [DOI] [PubMed] [Google Scholar]
- 34.Srikrishna G, Turovskaya O, Shaikh R, et al. Carboxylated glycans mediate colitis through activation of NF-kappa B. J Immunol. 2005;175:5412–22. doi: 10.4049/jimmunol.175.8.5412. [DOI] [PubMed] [Google Scholar]
- 35.Drakes ML, Blanchard TG, Czinn SJ. Colon lamina propria dendritic cells induce a proinflammatory cytokine response in lamina propria T cells in the SCID mouse model of colitis. J Leukoc Biol. 2005;78:1291–300. doi: 10.1189/jlb.0605342. [DOI] [PubMed] [Google Scholar]
- 36.Steinman RM, Nussenzweig MC. Avoiding horror autotoxicus: the importance of dendritic cells in peripheral T cell tolerance. Proc Natl Acad Sci USA. 2002;99:351–8. doi: 10.1073/pnas.231606698. [DOI] [PMC free article] [PubMed] [Google Scholar]
- 37.MacDonald KP, Munster DJ, Clark GJ, Dzionek A, Schmitz J, Hart DN. Characterization of human blood dendritic cell subsets. Blood. 2002;100:4512–20. doi: 10.1182/blood-2001-11-0097. [DOI] [PubMed] [Google Scholar]
- 38.Ikeda Y, Akbar SM, Matsui H, Onji M. Antigen-presenting dendritic cells in ulcerative colitis. J Gastroenterol. 2002;37(Suppl. 14):53–5. doi: 10.1007/BF03326414. [DOI] [PubMed] [Google Scholar]
- 39.Ikeda Y, Akbar F, Matsui H, Onji M. Characterization of antigen-presenting dendritic cells in the peripheral blood and colonic mucosa of patients with ulcerative colitis. Eur J Gastroenterol Hepatol. 2001;13:841–50. doi: 10.1097/00042737-200107000-00013. [DOI] [PubMed] [Google Scholar]
- 40.Vuckovic S, Florin TH, Khalil D, et al. CD40 and CD86 upregulation with divergent CMRF44 expression on blood dendritic cells in inflammatory bowel diseases. Am J Gastroenterol. 2001;96:2946–56. doi: 10.1111/j.1572-0241.2001.04686.x. [DOI] [PubMed] [Google Scholar]
- 41.Liu K, Victora GD, Schwickert TA, et al. In vivo analysis of dendritic cell development and homeostasis. Science. 2009;324:392–7. doi: 10.1126/science.1170540. [DOI] [PMC free article] [PubMed] [Google Scholar]
- 42.van Heel DA, Ghosh S, Hunt KA, et al. Synergy between TLR9 and NOD2 innate immune responses is lost in genetic Crohn's disease. Gut. 2005;54:1553–7. doi: 10.1136/gut.2005.065888. [DOI] [PMC free article] [PubMed] [Google Scholar]
- 43.Colonna M, Trinchieri G, Liu YJ. Plasmacytoid dendritic cells in immunity. Nat Immunol. 2004;5:1219–26. doi: 10.1038/ni1141. [DOI] [PubMed] [Google Scholar]
- 44.Jaehn PS, Zaenker KS, Schmitz J, Dzionek A. Functional dichotomy of plasmacytoid dendritic cells: antigen-specific activation of T cells versus production of type I interferon. Eur J Immunol. 2008;38:1822–32. doi: 10.1002/eji.200737552. [DOI] [PubMed] [Google Scholar]
- 45.Goubier A, Dubois B, Gheit H, et al. Plasmacytoid dendritic cells mediate oral tolerance. Immunity. 2008;29:464–75. doi: 10.1016/j.immuni.2008.06.017. [DOI] [PMC free article] [PubMed] [Google Scholar]
- 46.Rescigno M, Urbano M, Valzasina B, et al. Dendritic cells express tight junction proteins and penetrate gut epithelial monolayers to sample bacteria. Nat Immunol. 2001;2:361–7. doi: 10.1038/86373. [DOI] [PubMed] [Google Scholar]
- 47.Niess JH, Brand S, Gu X, et al. CX3CR1-mediated dendritic cell access to the intestinal lumen and bacterial clearance. Science. 2005;307:254–8. doi: 10.1126/science.1102901. [DOI] [PubMed] [Google Scholar]
- 48.te Velde AA, van KY, Braat H, et al. Increased expression of DC-SIGN+IL-12+IL-18+ and CD83+IL-12-IL-18- dendritic cell populations in the colonic mucosa of patients with Crohn's disease. Eur J Immunol. 2003;33:143–51. doi: 10.1002/immu.200390017. [DOI] [PubMed] [Google Scholar]
- 49.Watanabe S, Yamakawa M, Hiroaki T, Kawata S, Kimura O. Correlation of dendritic cell infiltration with active crypt inflammation in ulcerative colitis. Clin Immunol. 2007;122:288–97. doi: 10.1016/j.clim.2006.10.013. [DOI] [PubMed] [Google Scholar]
- 50.Silva MA, Quera R, Valenzuela J, Salim SY, Soderholm JD, Perdue MH. Dendritic cells and Toll-like receptors 2 and 4 in the ileum of Crohn's disease patients. Dig Dis Sci. 2008;53:1917–28. doi: 10.1007/s10620-007-0105-x. [DOI] [PubMed] [Google Scholar]
- 51.Young JW, Koulova L, Soergel SA, Clark EA, Steinman RM, Dupont B. The B7/BB1 antigen provides one of several costimulatory signals for the activation of CD4+ T lymphocytes by human blood dendritic cells in vitro. J Clin Invest. 1992;90:229–37. doi: 10.1172/JCI115840. [DOI] [PMC free article] [PubMed] [Google Scholar]
- 52.Hart AL, Al-Hassi HO, Rigby RJ, et al. Characteristics of intestinal dendritic cells in inflammatory bowel diseases. Gastroenterology. 2005;129:50–65. doi: 10.1053/j.gastro.2005.05.013. [DOI] [PubMed] [Google Scholar]
- 53.Stuber E, Strober W, Neurath M. Blocking the CD40L-CD40 interaction in vivo specifically prevents the priming of T helper 1 cells through the inhibition of interleukin 12 secretion. J Exp Med. 1996;183:693–8. doi: 10.1084/jem.183.2.693. [DOI] [PMC free article] [PubMed] [Google Scholar]
- 54.Cong Y, Weaver CT, Lazenby A, Elson CO. Colitis induced by enteric bacterial antigen-specific CD4+ T cells requires CD40–CD40 ligand interactions for a sustained increase in mucosal IL-12. J Immunol. 2000;165:2173–82. doi: 10.4049/jimmunol.165.4.2173. [DOI] [PubMed] [Google Scholar]
- 55.Liu Z, Colpaert S, D'Haens GR, et al. Hyperexpression of CD40 ligand (CD154) in inflammatory bowel disease and its contribution to pathogenic cytokine production. J Immunol. 1999;163:4049–57. [PubMed] [Google Scholar]
- 56.Battaglia E, Biancone L, Resegotti A, Emanuelli G, Fronda GR, Camussi G. Expression of CD40 and its ligand, CD40L, in intestinal lesions of Crohn's disease. Am J Gastroenterol. 1999;94:3279–84. doi: 10.1111/j.1572-0241.1999.01538.x. [DOI] [PubMed] [Google Scholar]
- 57.Vogel JD, West GA, Danese S, et al. CD40-mediated immune–nonimmune cell interactions induce mucosal fibroblast chemokines leading to T-cell transmigration. Gastroenterology. 2004;126:63–80. doi: 10.1053/j.gastro.2003.10.046. [DOI] [PubMed] [Google Scholar]
- 58.Gelbmann CM, Leeb SN, Vogl D, et al. Inducible CD40 expression mediates NFkappaB activation and cytokine secretion in human colonic fibroblasts. Gut. 2003;52:1448–56. doi: 10.1136/gut.52.10.1448. [DOI] [PMC free article] [PubMed] [Google Scholar]
- 59.Blom B, Spits H. Development of human lymphoid cells. Annu Rev Immunol. 2006;24:287–320. doi: 10.1146/annurev.immunol.24.021605.090612. [DOI] [PubMed] [Google Scholar]
- 60.Zhou H, Ding G, Liu W, et al. Lipopolysaccharide could be internalized into human peripheral blood mononuclear cells and elicit TNF-alpha release, but not via the pathway of Toll-like receptor 4 on the cell surface. Cell Mol Immunol. 2004;1:373–7. [PubMed] [Google Scholar]