Summary
Salvinorin A (SA) is a potent kappa opioid with a brief duration of action. Consistent with this, our previous positron emission tomography (PET) studies of carbon-11 labeled SA showed that brain levels decrease rapidly after intravenous administration. SA is rapidly metabolized, giving the much less potent salvinorin B (SB), which is presumed to be responsible in part for SA's brief duration of action. To test this, we labeled the metabolically stable methyl ester of SA and SB with carbon-11 and compared their pharmacokinetics by PET imaging after intravenous administration to baboons. Labeling of salvinorin B ethoxymethyl ether (EOM-SB), a derivative with greater potency and resistance to metabolism, provided an additional test of the role of metabolism in brain efflux. Plasma analysis confirmed that SB and EOM-SB exhibited greater metabolic stability than SA. However, the three compounds exhibited very similar pharmacokinetics in brain, entering and exiting rapidly. This suggests that metabolism is not solely responsible for the brief brain residence time of SA. We determined that whole brain concentrations of EOM-SB declined more slowly than SA after intraperitoneal administration in rodents. This is likely due to a combination in EOM-SB's increased metabolic stability and its decreased plasma protein affinity. Our results suggest that protecting salvinorin A derivatives from metabolism will prolong duration of action, but only when administered by routes giving slow absorption.
Keywords: Salvia, Salvinorin A, positron emission tomography, kappa opioid, carbon-11
Introduction
The chemistry and pharmacology of salvinorin A (SA), the primary psychoactive component of Salvia divinorum, has been the target of increasing research. Well over one hundred derivatives of SA have now been synthesized (Prisinzano and Rothman, 2008) since its initial isolation over twenty years ago (Ortega et al., 1982; Valdes et al., 1984). This is in large part due to the exquisite specificity of SA as an agonist for the kappa opioid receptor (KOR) (Roth et al., 2002) and the importance of developing pharmacological probes to interrogate KOR's role throughout the central nervous system (Prisinzano 2009). KORs have been suggested as a target for the development of therapeutics for pain (Simonin et al., 1998; Pasternak 1993), depression (Mague et al., 2003; Newton et al., 2002; McLaughlin et al., 2003; Beardsley et al., 2005), anxiety (Knoll et al., 2007), and drug abuse (Shippenberg and Rea, 1997; Hasebe et al., 2004); thus, SA and its derivatives are often evaluated in these contexts using animal behavioral assays (Fantegrossi et al., 2005; Zhang et al., 2005; Carlezon et al., 2006; Gehrke et al., 2008; Butelman et al., 2009). Of the derivatives reported to date, the most potent is salvinorin B ethoxymethyl ether (EOM-SB), which is approximately ten times more potent than SA in vitro (Munro et al., 2008) and in rodents (Baker et al., 2009). The methoxymethyl ether (MOM-SB)1 is of intermediate potency. In addition to showing higher affinity to the KOR in vitro, these protected derivatives appear to have a longer duration of action when administered to rodents. For example, MOM-SB-induced antinociception persisted for over 2 h after intraperitoneal (i.p.) administration (Wang et al., 2008). By contrast, even high doses of SA (10 mg/kg) produced no detectable antinociception after 30 minutes.
It has been proposed that the longer duration of action of MOM-SB in vivo results from greater metabolic stability. The acetyl group of SA is metabolically labile and cleavage yields salvinorin B (SB), which has greatly diminished affinity for KOR. Previously, we examined [acetyl-11C]-SA using positron emission tomography (PET) and determined that its pharmacokinetics in the brain paralleled its short duration of action (Hooker et al., 2008). We proposed that the rapid deacetylation of SA in vivo may, in part, be responsible for its short duration of action. Since publication of our work, several other detailed investigations of SA metabolism and pharmacokinetics have been reported. In vitro studies have confirmed the instability of the C2 acetyl group both with isolated enzymes (Teksin et al., 2009) and in rat plasma with or without esterase inhibitors (Tsujikawa et al., 2009).
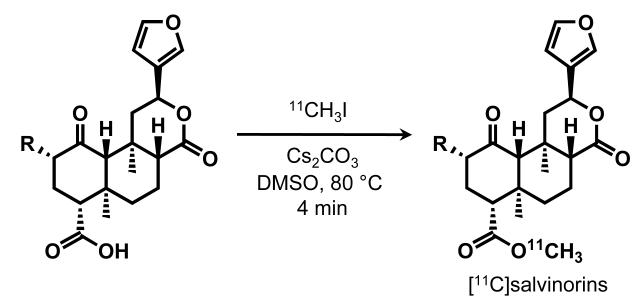
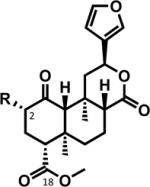
Given the reportedly prolonged effects of MOM-SB, we decided to move the carbon-11 labeling position from the acetate to the methyl ester in order to study derivatives with increased resistance to metabolism as PET ligands. To maximize specific binding, we selected the derivative with the highest affinity and selectivity for KOR, EOM-SB. Herein, we report the [11C] labeling of three compounds (SA, SB, and EOM-SB, Figure 1) and our investigations of the pharmacokinetics and metabolism of these compounds using PET.
Figure 1.
Synthesis of [11C]salvinorins.
Methods
General
[11C]Methyl iodide was produced by PETtrace MeI Microlab (GE Medical Systems, Milwaukee, WI, USA) from [11C]carbon dioxide, which was generated from a nitrogen/oxygen (1000 ppm) target (14N(p,α)11C) using EBCO TR 19 cyclotron (Advanced Cyclotron Systems INC. Richmond, Canada). High performance liquid chromatography (HPLC) purification was performed by a Knauer HPLC system (Sonntek Inc., Woodcliff Lake, NJ, USA) with a model K-5000 pump, a Rheodyne 7125 injector, a model 87 variable wavelength monitor, and NaI radioactivity detector.
Specific activity was determined by measuring the radioactivity and the mass; the latter is derived from a standard curve (UV absorbance at 210 nm by peak area) after HPLC injection of different quantities of the authentic reference compounds. Radiochemical purity was determined by thin-layer chromatography (TLC) using and measuring radioactivity distribution on Macherey–Nagel polygram sil G/UV254 plastic-back TLC plate with Bioscan system 200 imaging scanner (Bioscan Inc., Washington, DC). 11C radioactivity was measured by a MINAXI γ 5000 automated gamma counter (Packard Instrument, Meriden, CT). All measurements were decay corrected. Cesium carbonate was obtained from Sigma-Aldrich (USA); anhydrous DMSO was obtained from Acros Organics (USA).
Synthesis of O-demethylated precursors for radiolabeling
O-Demethylsalvinorin A was prepared from salvinorin A using LiI in refluxing pyridine (Béguin et al., 2006) and purified by repeated flash chromatography (Munro et al., 2007). O-Demethylsalvinorin B can be prepared directly from salvinorin A using LiSEt in DMPU (Munro et al., 2005); we found that deacetylation of O-demethylsalvinorin A using Na2CO3 in MeOH under standard conditions (Tidgewell et al., 2004) also gave satisfactory results. Both of these procedures gave predominantly the 8-epimer which, unlike 8-epi-salvinorin B, could not be removed by trituration in MeOH; separation was achieved by repeated flash chromatography. Attempted preparation directly from salvinorin A using LiI/pyridine/water gave slow and incomplete deacetylation.
O-Demethylation of salvinorin B ethoxymethyl ether proved challenging. Attempted direct demethylation of the EOM protected compound led to slow formation of complex mixtures, under a range of reaction conditions (LiI in pyridine, DMF or DMPU; NaSEt in DMF; NaOH in MeOH; LiOH in THF/H2O; Me3SiONa in THF, Et2O or CH2Cl2). As an alternative approach, we pursued ethoxymethylation of O-demethylsalvinorin B, which afforded the desired product albeit in very low yield after repeated chromatography. Substantial amounts of C-18 ethoxymethyl esters were formed as byproducts. Attempted selective cleavage of the esters (NaHSO4 on silica gel in CH2Cl2) gave yields too low to be justified. Thus, the procedure used is as follows:
O-Demethylsalvinorin B
For preparation, see (Munro et al., 2005). Separation of the epimers by repeated flash column chromatography on silica gel in 1% AcOH:39% EtOAc:30% CH2Cl2:30% hexanes gave the title compound as colorless crystals. m.p. 208–212 °C; TLC (1% AcOH:49% EtOAc:30% CH2Cl2:20% hexanes, visualized in vanillin/H2SO4/EtOH): Rf = 0.22 (pink/purple; 8-epimer = 0.31, blue); 1H NMR (300 MHz, CD3OD): δ 7.56 (1H, dt, J = 1.6, 0.8 Hz), 7.48 (1H, t, J = 1.7 Hz), 6.51 (1H, dd, J = 1.9, 0.9 Hz), 5.61 (1H, dd, J = 11.8, 5.2 Hz), 4.17 (1H, dd, J = 12.0, 7.6 Hz), 2.81 (1H, dd, J = 13.3, 3.6 Hz), 2.49 (1H, s), 2.44 (1H, dd, J = 13.5, 5.2 Hz), 2.33 (2H, ddd, J = 13.2, 7.3, 3.4 Hz), 2.08–2.03 (1H, m), 1.96 (1H, q, J = 13.0 Hz), 1.86 (1H, dd, J = 10.0, 2.9 Hz), 1.81–1.71 (1H, m), 1.70–1.59 (2H, m), 1.46 (3H, s), 1.09 (3H, s); 13C NMR (75 MHz, CD3OD): δ 210.4, 175.3, 174.3, 145.0, 141.2, 126.9 109.6, 75.5, 73.6, 63.7, 54.2, 51.7, 43.9, 42.9, 39.0, 36.4, 35.7, 19.3, 16.8, 15.6; HRMS(ESI): [M+H]+ m/z 377.1601 (calcd for C20H24O7, 377.1595).
O-Demethylsalvinorin B ethoxymethyl ether
O-Demethylsalvinorin B and its 8-epimer (38:62 d.r., 56.4 mg, 150 μmol) and NaI (33 mg, 220 μmol, 1.5 eq) were dissolved in DMF (2 mL). i-Pr2NEt (130 μL, 746 μmol, 5 eq) and EtOCH2Cl (69 μL, 744 μmol, 5 eq) were added. The cloudy yellow solution was stirred at r.t. for 24 h. TLC (1% AcOH/4% MeOH/95% CH2Cl2) showed residual starting material, which was not consumed after an additional 24 h. The solution was diluted to 10 mL with sat. aq. NaHCO3 and extracted with EtOAc. The organic layer was washed (0.1 M aq. HCl (× 3), then brine) and dried (MgSO4) to give ethoxymethyl ester byproducts (22.4 mg). The aqueous NaHCO3 layer was cooled to 3 °C, and the pH adjusted to ∼2 with 0.1 M aq. HCl. This was extracted and dried as above to give the crude product as a resin (27.5 mg). Repeated flash column chromatography on silica gel eluting with a gradient from 20–50% EtOAc in premixed 1% AcOH/49% CH2Cl2/50% hexanes gave the title compound (∼70% pure by 1H NMR) as a resin (4.5 mg, 10 μmol, 7%). TLC (1% AcOH:49% EtOAc:30% CH2Cl2:20% hexanes): Rf = 0.36 (pink/purple); 1H NMR (300 MHz, CDCl3): δ 7.43–7.40 (2H, m), 6.38 (1H, br s), 5.55 (1H, dd, J = 11.3, 5.3 Hz), 4.79 (1H, d, J = 7.3 Hz), 4.75 (1H, d, J = 7.3 Hz), 4.19 (1H, dd, J = 12.4, 7.6 Hz), 3.70 (1H, dq, J = 9.7, 7.0 Hz), 3.59 (1H, dq, J = 9.7, 7.0 Hz), 2.73 (1H, dd, J = 13.6, 3.1 Hz), 2.54 (1H, dd, J = 13.1, 5.1 Hz), 2.47–2.35 (1H, m), 2.25–2.10 (2H, m), 2.09 (1H, br s), 2.08–2.04 (1H, m), 1.99–1.93 (1H, m), 1.76–1.44 (3H, m), 1.48 (3H, s), 1.19 (3H, t, J = 7.1 Hz), 1.14 (3H, s).
Carbon-11 Labeling
A solution of the appropriate precursor (0.7-1.0 mg in 250 μL of anhydrous DMSO) and was added to a cone-bottomed 5 mL reaction vessel which containing 0.5 mg Cs2CO3. The vessel was equipped with a septum and screw cap, and inlet and outlet lines for [11C]-methyl iodide delivery were inserted through the septum. [11C]-Methyl iodide produced by the GE unit was released into a stream of Argon, which was passed through precursor solution. When radioactivity in the vessel reached a maximum, the flow of gas was diverted and the sealed vessel was heated to 80 °C for 5 min. Following dilution of the solution with 1.0 mL of 0.1 M aqueous ammonium formate (NH4HCO2), the solution was loaded onto a semi-preparative HPLC column (Phenomenex C18(2), 250×10 mm, 5 μm) for purification. The elution system for each compound was as follows: [11C]-SA, 55% MeCN, 45% 0.1 M NH4HCO2 isocratic (5 mL/min), retention time = 12 min; [11C]-SB, 35% MeCN, 65% 0.1 M NH4HCO2 isocratic (5 mL/min), retention time = 11.5 min; [11C]-EOM-SB, gradient elution (solvent A = 95% 0.1M NH4HCO2/5% MeCN; balance of gradient = MeCN) under the following timing: 0-2 min (80% A), 2-22 min (−3.5% A/min), 22-27 min (10% A), 5 mL/min, retention time = 18.5 min. The product was collected at the expected retention time, and the solvent was removed by azeotropic evaporation with acetonitrile. After dilution with ethanol (0.4 mL) and water (3.6 mL) the solution was filtered through an Acrodisc 13-mm Syringe Filter with 0.2 μm HT Tuffryn Membrane (Pall Corporation, Ann Arbor, MI) into a sterile vial for delivery.
For quality control (i.e. identity verification and radiochemical purity), analytical TLC and HPLC were performed. [11C]-Salvinorin A was cospotted with unlabelled standard by TLC (Rf = 0.5 in 50% EtOAc:hexanes, visualized by KMnO4). An analogous procedure was used for [11C]-SB (Rf = 0.4 using 60% EtOAc:hexanes) and [11C]-EOM-SB (Rf = 0.7 using 50%EtOAc/Hex). Analytical HPLC of each sample spiked with the corresponding standard was performed using a Phenomenex Gemini C18 column (250 mm × 4.6 mm, 5 μm) using a gradient elution from a 95% aqueous mobile phase to 5% aqueous over 20 min (balance MeCN). Radiochemical yield and specific activities (corrected to EOB) for compounds used in PET imaging were as follows: [11C]-SA (72 ± 6%, 4.3 ± 1.2 Ci/μmol, n = 5), [11C]-SB (54 ± 10%, 2.6 ± 0.6 Ci/μmol, n = 3), [11C]-EOM-SB (41 ± 7%, 4.1 ± 0.9 Ci/μmol, n = 4).
LogD Determination
An aliquot (50 μl) of the formulated [11C]-product was added to a test tube containing 2.5 mL of octanol and 2.5 mL of phosphate buffer solution (pH 7.4). The test tube was vortexed for 2 min and centrifuged for 2 min at the highest speed. A sample (0.1 mL) was taken from the octanol layer, the other (1.0 mL) sample was taken from the phosphate buffer layer and both were saved for radioactivity measurement. An aliquot solution (2.0 mL) from the octanol layer was transferred to the next test tube containing 0.5 mL of octanol and 2.5 mL of phosphate buffer solution (pH 7.4), and the previous procedure (from vortex to transfer to the next test tube) was repeated until six sets of aliquot samples had been prepared. The radioactivity of each sample was measured in a well counter (Picker, Cleveland, OH). The logD of each set of sample was derived by the following equation: logD = log (decay-corrected radioactivity in octanol layer × 10/decay-corrected radioactivity in phosphate buffer layer).
Plasma Protein Binding Assay
An aliquot of the formulated [11C]-product (10 μl) was added to an 0.8-mL baboon plasma sample (pooled from at least 4 separate animals). The mixture was incubated for 10 min at room temperature. After 20 μl of the sample had been taken from the mixture for measurement of total activity (AT; AT=Abound+Aunbound), 0.2 mL of the sample was placed in the upper part of the Centrifree tube (Amicon, Inc., Beverly, MA) and centrifuged for 10 min. After the upper part of the Centrifree tube had been discarded, the aliquot (20 μl) from the bottom part of the tube was taken for measurement of the radioactivity of the unbound sample (Aunbound). Plasma protein binding was derived by the following equation: %unbound=Aunbound×100/AT.
PET imaging and arterial plasma analysis (baboon)
All experiments with animals were approved by the Brookhaven Institutional Animal Care and Use Committee. Female Papio anubis baboons were anesthetized by an intramuscular injection of ketamine hydrochloride (10 mg/kg) and then maintained with oxygen (800 mL/min), nitrous oxide (1500 mL/min) and isoflurane (Forane, 1–4%) during scanning. The appropriate study compound ([11C]-SA, [11C]-SB, or [11C]-EOM-SB) was injected through a catheter placed in a radial arm vein, and arterial blood was sampled through a catheter in the popliteal artery at the following time intervals: every 5 s for 2 min, then 2, 5, 10, 20, 30, 45, 60 min. Heart rate, respiration rate, pO2 and body temperature were checked during the PET scanning. Dynamic PET imaging was performed by Siemens HR+ (Siemens high-resolution, whole-body PET scanner with 4.5×4.5×4.8 mm resolution at the center of field of view) with the brain in the field of view, for a total of 60 min with the following time frames in 3D mode: 12×5, 12×10, 6×20, 6×30, 8×60, 2×120, 4×300, 2×600 s. Prior to each emission scan, a transmission scan was obtained by rotating a 68Ge rod source to correct for attenuation. A total of eight studies in baboons were conducted (3 × [11C]-SA, 3 × [11C]-SB, 2 × [11C]-EOM-SB), with an average injected dose of 3.91 ± 0.93 mCi.
The % unmetabolized radiotracer in the baboon's plasma was determined using the following protocol: Baboon plasma (∼0.2 mL) sampled at various time points during the PET study was counted, added to a solution of unlabeled standard (20 μL of a 1 mg/mL solution) in acetonitrile (0.3 mL) and the resulting mixture vortexed and centrifuged. The supernatant was mixed with 0.3 mL water and then analyzed by HPLC (Waters bondapak C18 column with eluents acetonitrile/0.1 M ammonium formate at 1.0 mL/min using UV (215 nm) and radiodetection. The fraction of radioactivity coeluting with the unlabeled standard, relative to the total radioactivity from the HPLC column was measured as the % of unmetabolized radiotracer.
PET imaging and brain homogenate analysis (rodent after i.p. injection)
For each imaging experiment, two male Sprague Dawley rats (7-8 weeks old, Taconic Farms) were anesthetized and maintained with isoflurane/oxygen. The animals were placed side-by-side in the Siemens HR+ scanner with the anteroposterior axis in the axial dimension of the scanner. Each animal was injected with the study compound solution (0.5-0.8 mL) through a butterfly catheter placed in the peritoneum. The catheter was then rinsed with 0.5 mL of saline. (Injected doses were 3.0 ± 0.4 mCi in each animal). Dynamic PET imaging was performed for a total of 60 min using the following time frames: 1×10, 12×5, 1×20, 1×30, 8×60, 10×300 s.
At the end of imaging and while still anesthetized, each animal was killed by decapitation. Each brain was carefully removed and homogenized with 1 mL of water. An aliquot of this mixture (300 μL) was diluted to 1 mL with cold (4 °C) acetonitrile causing precipitation and phase separation. The sample was mixed by vortex for 1 min and then separated by centrifugation (2000 rcf, 2 min). The supernatant was spiked with the appropriate standard and the radioactivity of the sample was measured by γ-counting. The sample was analyzed by HPLC and the fraction co-eluting with the standard was collected. The radioactivity of the collected product was measured. The decay corrected ratio of collected product to initial radioactivity in the homogenate was determined.
Image analysis
Emission data from the dynamic scans were corrected for attenuation and reconstructed using filtered back projection. Regions of interest (ROIs) on the baboon and rodent brain were drawn on summed images and then projected to the dynamic images to obtain time activity curves (TACs) expressed as %injected dose/cm3 (decay corrected) versus time.
Results and Discussion
In order to facilitate the investigation of C2 derivatives of salvinorin A using PET, we developed and optimized a procedure to label the C18 methyl ester with carbon-11. O-Demethyl salvinorins A and B have been prepared previously by nucleophilic cleavage with LiI or LiSEt. Although these conditions were not effective when applied to the ethoxymethyl ether, sufficient quantities of the O-demethyl compound were obtained for radiolabeling and imaging studies by ethoxymethylation of O-demethylsalvinorin B.
We found that methylation of the C18 acid with [11C]-methyl iodide could be accomplished in DMSO with only a small amount of Cs2CO3 (heterogeneous). The use of a poorly soluble base minimized the known epimerization of the C8 carbon and led to suitable radiochemical yields for each of the three compounds we pursued. We anticipate this simple procedure will be adaptable to labeling other C2 salvinorin derivatives either with carbon-11, long-lived isotopes (e.g. 3H, 14C) or stable isotopes (e.g. 2H, 13C).
The lipophilicity and plasma protein binding characteristics of each labeled compound were determined, Table 1. From these data, it is evident that the C2 position of SA is important in plasma protein binding. A higher proportion of [11C]-SB remained unbound in plasma (more than double that of SA and EOM-SB). The percentage of [11C]-EOM-SB in the free fraction, bound to plasma protein, was higher than was observed for [11C-SA]. Due to this, we would expect at equal plasma concentrations that EOM-SB would be more potent than SA. Thus as metabolism and excretion occur, the increased free fraction also may contribute to an increased duration of action given that EOM-SB will remain above a threshold longer than SA.
Table 1.
Summary of in vitro data (mean ± stdev)
| LogD (pH 7.4) | Plasma Protein Binding (% unbound) |
|
|---|---|---|
| [11C]-SA* | 2.34 ± 0.09 (n = 4) | 16.1 % (n = 2) |
| [11C]-SB | 1.50 ± 0.00 (n = 6) | 47.3 % (n = 2) |
| [11C]-EOM-SB | 2.46 ± 0.01 (n = 5) | 23.4 % (n = 3) |
[acetyl-11C]-SA from published data
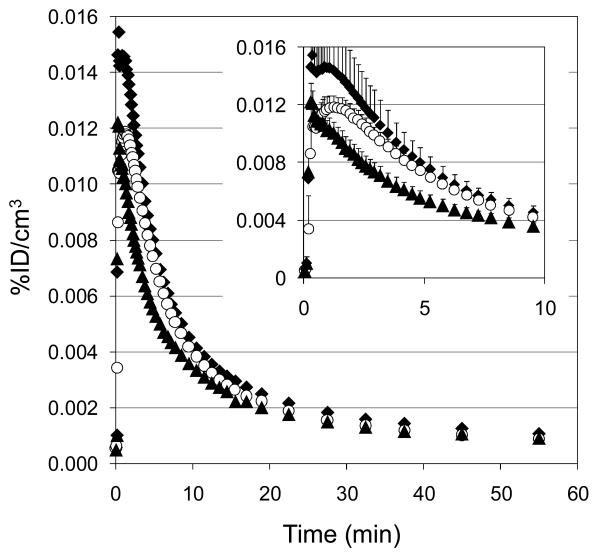
Using a whole brain region of interest, we determined that all three labeled compounds rapidly entered and exited the brain, Figure 2. Consistent with our data from [acetyl-11C]-SA, the maximum average concentration of SA in the brain following bolus intravenous administration was 0.015% ID/cm3. In the previous study, where metabolism gave 1-[11C]-acetate (Hooker, 2008), we observed a small amount of residual radioactivity as late as 60 min after injection (0.004% ID/cm3), whereas [11C]-SA (labeled at the methyl ester) cleared to 0.001% by the same time. The major labeled metabolite from [11C]-SA was [11C]-SB and thus total brain radioactivity likely represents the sum of the two species. To evaluate this, we labeled SB itself.
Figure 2.
Average of whole brain time-activity curves for [11C]-labeled compounds. ◆ [11C]-SA (n = 3); ○ [11C]-SB (n = 3); ▲ [11C]-EOM-SB (n =2). (inset) mean+stdev over first 10 min post injection.
[11C]-SB entered and cleared the brain with kinetics similar to [11C]-SA with an approximately 20% lower average maximum concentration (peaking at 70 s and clearing to half of its maximum concentration in 6.0 min). As with [11C]-SA, no accumulation of radioactivity was observed in any brain region over time. [11C]-SB is a potential metabolite of [11C]-EOM-SB, but these data suggested it would not alter the results if formed.
Given the increased affinity and potency of EOM-SB over SA, we expected to see increased specific binding of [11C]-EOM-SB at KORs. However, we found that [11C]-EOM-SB kinetics were similar to [11C]-SA. In fact, [11C]-EOM-SB had a lower average concentration at 30 s after injection than either [11C]-SA or [11C]-SB.
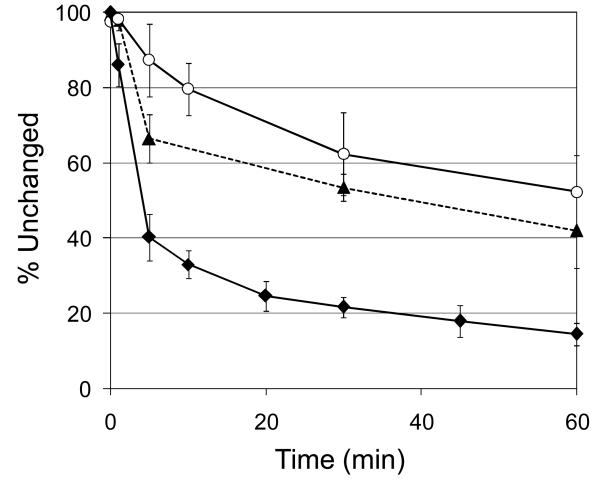
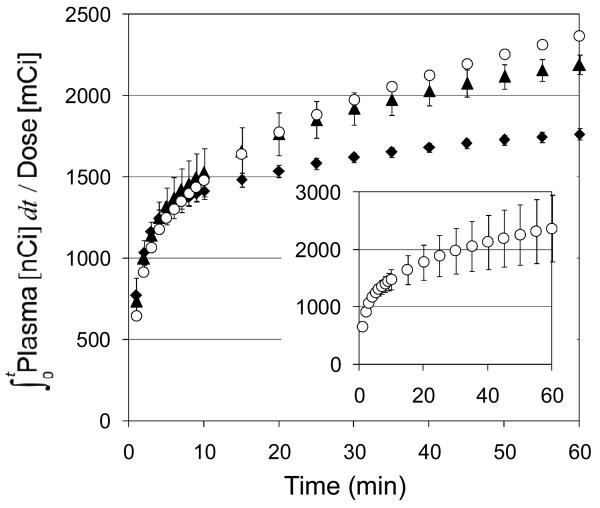
The major difference between [11C]-EOM-SB and [11C]-SA was in the rate of metabolism, Figure 3. The protecting group imparted increased stability: ∼50% of the radioactivity was parent compound at 30 min after injection. This is in stark contrast to [11C]-SA, which is metabolized to ∼50% in under 5 min. The integral of metabolite-corrected plasma radioactivity over time for [11C]-EOM-SB continues to climb longer than that of [11C]-SA (Figure 4), reflecting longer persistence in plasma. The metabolites of [11C]-EOM-SB observed by HPLC were more polar than the parent compound. Co-injection of [11C]-EOM-SB plasma samples with SB on HPLC indicated that some [11C]-SB may be formed, however the percentage of [11C]-SB could not be accurately determined due to the presence of co-eluting [11C]-metabolites. We were not able to exclude the possibility that some of the parent compound had epimerized at the C8 position over time for either [11C]-SB or [11C]-EOM-SB, however incubation of [11C]-EOM-SB in plasma did not cause epimerization. Our data indicate that none of these compounds are suitable candidates for PET imaging of KORs. Due to their low uptake and rapid clearance, PET signal intensity largely reflects plasma drug levels rather than the much lower specific labeling of KORs.
Figure 3.
Baboon plasma analysis. During PET scans, samples of plasma were analyzed to determine the percentage of radioactivity associated with the injected compound. ◆ [acetyl-11C]-SA (n = 10); ○ [11C]-SB (n = 3); ▲ [11C]-EOM-SB (n = 2).
Figure 4.
Metabolite corrected plasma integrals. ◆ [acetyl-11C]-SA (n = 10); ○ [11C]-SB (n = 3); ▲ [11C]-EOM-SB (n = 2). (inset) error bars for [11C]-SB are shown separately to avoid confusing overlap with [11C]-EOM-SB error bars.
Although our results confirm that SB and EOM-SB are metabolized much more slowly than SA, a similarly dramatic increase in brain residence time was not observed (Figure 2). Thus, the brief duration of action of SA is not due solely to metabolism, since a less rapidly metabolized derivative and indeed a metabolite itself are removed from brain almost as rapidly. All three of these compounds show low brain uptake, and are rapidly eliminated, which may suggest transport is mediated by transporters at the blood brain barrier. Consistent with this, efflux of salvinorin A by permeability glycoprotein (P-gp) has recently been reported (Teksin et al., 2009).
These results were surprising, given the increased duration of analgesia reported for the methoxymethyl ether. This may be due to the different routes of administration. After intravenous administration, as used here, the rate of elimination from the brain and plasma was rapid and thus could mask an effect related to metabolism. Intraperitoneal (i.p.) administration, as used in the analgesia assays (Wang et al., 2008), introduces a delay, as the drug is gradually released from the injection site. If the drug is not metabolized during the absorption process, the slower route of administration will prolong the drug's effects. Thus, differences in metabolic rate will be more apparent by intraperitoneal administration. To evaluate this, we administered [11C]-labeled SA and EOM-SB to rats i.p.
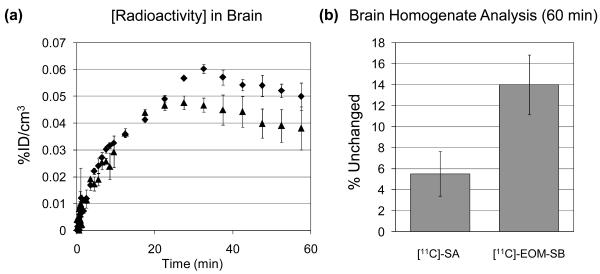
The absorption kinetics of the two compounds were nearly identical (as determined by a 2 mm spherical ROI placed in the injection site) as were the kinetics in the rodent brain, Figure 5. These data were consistent with the brain kinetics obtained using LC-MS for SA administered i.p. (Teksin et al., 2009). The curves in Figure 5 represent the total radioactivity of all labeled compounds in the brain. To determine the amount of remaining parent compound, we analyzed brain homogenate at ∼65 min post injection. The proportion of [11C]-EOM-SB remaining (14%) was nearly 3-fold higher than for [11C]-SA. This suggests that compounds with slower metabolism would indeed display longer duration of action by this route.
Figure 5.
(a) Average of whole brain time-activity curves for [11C]-labeled compounds administered i.p. to Sprague-Dawley rats. ◆ [11C]-SA (n = 2) ▲ [11C]-EOM-SB (n =2). mean±stdev (b) Brain homogenate analysis for parent compound at 60 min post administration (i.p.) to Sprague-Dawley rats. ◆ [11C]-SA (n = 2) ▲ [11C]-EOM-SB (n =2). mean±stdev
Conclusions
The pharmacokinetics of salvinorin B ethyoxymethyl ether, a more potent kappa agonist than salvinorin A, exhibit rapid uptake and clearance in the baboon brain when administered intravenously. However, protecting salvinorin A derivatives from metabolism may prolong duration of action, but only when administered by routes which give slow absorption (intraperitoneal injection). Modification at the C2 position of salvinorin A has a marked impact on plasma protein binding and thus may also contribute to the in vivo potency and duration of action. Our pharmacokinetic analysis was consistent with the notion that active mechanisms such as P-glycoprotein (P-gp) transport may indeed be another factor limiting their duration of action as recent in vitro evidence suggests. Reducing the vulnerability of these compounds to efflux, either by structural modification or by co-administration of transporter inhibitors, might increase and prolong their in vivo effects.
Structures Tables
| R |
Abbrev. |
Compound Name |
|
|---|---|---|---|
 |
 |
SA | Salvinorin A |
 |
SB | Salvinorin B | |
 |
MOM-SB | Salvinorin B methoxymethyl ether | |
| EOM-SB | Salvinorin A ethoxymethyl ether |
Acknowledgments
This work was carried out at McLean Hospital where T.A.M. and C.B. were supported by the Stanley Medical Research Institute and NARSAD and at Brookhaven National Laboratory under contract DE-AC02-98CH10886 with the U.S. Department of Energy, supported by its Office of Biological and Environmental Research. J.M.H. was supported by an NIH Postdoctoral Fellowship (1F32EB008320-01) and through the Goldhaber Distinguished Fellowship program at BNL. The authors are grateful to Dr. Michael Schueller for cyclotron operation, Dr. Stephen Dewey for technical assistance with rodent experiments, and the PET imaging team at BNL (Pauline Carter, Payton King, and Don Warner) for carrying out primate imaging experiments.
Footnotes
Publisher's Disclaimer: This is a PDF file of an unedited manuscript that has been accepted for publication. As a service to our customers we are providing this early version of the manuscript. The manuscript will undergo copyediting, typesetting, and review of the resulting proof before it is published in its final citable form. Please note that during the production process errors may be discovered which could affect the content, and all legal disclaimers that apply to the journal pertain.
Although MOM-SB has been referred to as “2-methoxymethyl-salvinorin B”, this implies that the substituent is attached at C-2. The compound could be termed 2-O-methoxymethylsalvinorin B, but the simpler “salvinorin B methoxymethyl ether” is also unambiguous, and thus preferred under IUPAC recommendations to omit redundant locants.
References
- Baker LE, Panos JJ, Killinger BA, Peet MM, Bell LM, Haliw LA, Walker SL. Comparison of the discriminative stimulus effects of salvinorin A and its derivatives to U69,593 and U50,488 in rats. Psychopharmacology (Berl) 2009;203:203–211. doi: 10.1007/s00213-008-1458-3. [DOI] [PubMed] [Google Scholar]
- Beardsley PM, Howard JL, Shelton KL, Carroll FI. Differential effects of the novel kappa opioid receptor antagonist, JDTic, on reinstatement of cocaine-seeking induced by footshock stressors vs cocaine primes and its antidepressant-like effects in rats. Psychopharmacology (Berl) 2005;183:118–126. doi: 10.1007/s00213-005-0167-4. [DOI] [PubMed] [Google Scholar]
- Béguin C, Richards MR, Li JG, Wang Y, Xu W, Liu-Chen LY, Carlezon WA, Jr., Cohen BM. Synthesis and in vitro evaluation of salvinorin A analogues: effect of configuration at C(2) and substitution at C(18) Bioorg Med Chem Lett. 2006;16:4679–4685. doi: 10.1016/j.bmcl.2006.05.093. [DOI] [PubMed] [Google Scholar]
- Butelman ER, Prisinzano TE, Deng H, Rus S, Kreek MJ. Unconditioned behavioral effects of the powerful kappa-opioid hallucinogen salvinorin A in nonhuman primates: fast onset and entry into cerebrospinal fluid. J Pharmacol Exp Ther. 2009;328:588–597. doi: 10.1124/jpet.108.145342. [DOI] [PMC free article] [PubMed] [Google Scholar]
- Carlezon WA, Jr., Béguin C, DiNieri JA, Baumann MH, Richards MR, Todtenkopf MS, Rothman RB, Ma Z, Lee DY, Cohen BM. Depressive-like effects of the kappa-opioid receptor agonist salvinorin A on behavior and neurochemistry in rats. J Pharmacol Exp Ther. 2006;316:440–447. doi: 10.1124/jpet.105.092304. [DOI] [PubMed] [Google Scholar]
- Fantegrossi WE, Kugle KM, Valdes LJ, 3rd, Koreeda M, Woods JH. Kappa-opioid receptor-mediated effects of the plant-derived hallucinogen, salvinorin A, on inverted screen performance in the mouse. Behav Pharmacol. 2005;16:627–633. doi: 10.1097/00008877-200512000-00005. [DOI] [PubMed] [Google Scholar]
- Gehrke BJ, Chefer VI, Shippenberg TS. Effects of acute and repeated administration of salvinorin A on dopamine function in the rat dorsal striatum. Psychopharmacology (Berl) 2008;197:509–517. doi: 10.1007/s00213-007-1067-6. [DOI] [PMC free article] [PubMed] [Google Scholar]
- Hasebe K, Kawai K, Suzuki T, Kawamura K, Tanaka T, Narita M, Nagase H. Possible pharmacotherapy of the opioid kappa receptor agonist for drug dependence. Ann N Y Acad Sci. 2004;1025:404–413. doi: 10.1196/annals.1316.050. [DOI] [PubMed] [Google Scholar]
- Hooker JM, Xu Y, Schiffer W, Shea C, Carter P, Fowler JS. Pharmacokinetics of the potent hallucinogen, salvinorin A in primates parallels the rapid onset and short duration of effects in humans. Neuroimage. 2008;41:1044–1050. doi: 10.1016/j.neuroimage.2008.03.003. [DOI] [PMC free article] [PubMed] [Google Scholar]
- Knoll AT, Meloni EG, Thomas JB, Carroll FI, Carlezon WA., Jr. Anxiolytic-like effects of kappa-opioid receptor antagonists in models of unlearned and learned fear in rats. J Pharmacol Exp Ther. 2007;323:838–845. doi: 10.1124/jpet.107.127415. [DOI] [PubMed] [Google Scholar]
- Mague SD, Pliakas AM, Todtenkopf MS, Tomasiewicz HC, Zhang Y, Stevens WC, Jr., Jones RM, Portoghese PS, Carlezon WA., Jr. Antidepressant-like effects of kappa-opioid receptor antagonists in the forced swim test in rats. J Pharmacol Exp Ther. 2003;305:323–330. doi: 10.1124/jpet.102.046433. [DOI] [PubMed] [Google Scholar]
- McLaughlin JP, Marton-Popovici M, Chavkin C. Kappa opioid receptor antagonism and prodynorphin gene disruption block stress-induced behavioral responses. J Neurosci. 2003;23:5674–5683. doi: 10.1523/JNEUROSCI.23-13-05674.2003. [DOI] [PMC free article] [PubMed] [Google Scholar]
- Munro TA, Rizzacasa MA, Roth BL, Toth BA, Yan F. Studies toward the pharmacophore of salvinorin A, a potent kappa opioid receptor agonist. J Med Chem. 2005;48:345–348. doi: 10.1021/jm049438q. [DOI] [PMC free article] [PubMed] [Google Scholar]
- Munro TA, Duncan KK, Staples RJ, Xu W, Liu-Chen LY, Beguin C, Carlezon WA, Jr., Cohen BM. 8-epi-Salvinorin B: crystal structure and affinity at the kappa opioid receptor. Beilstein J Org Chem. 2007;3:1. doi: 10.1186/1860-5397-3-1. [DOI] [PMC free article] [PubMed] [Google Scholar]
- Munro TA, Duncan KK, Xu W, Wang Y, Liu-Chen LY, Carlezon WA, Jr., Cohen BM, Béguin C. Standard protecting groups create potent and selective kappa opioids: salvinorin B alkoxymethyl ethers. Bioorg Med Chem. 2008;16:1279–1286. doi: 10.1016/j.bmc.2007.10.067. [DOI] [PMC free article] [PubMed] [Google Scholar]
- Newton SS, Thome J, Wallace TL, Shirayama Y, Schlesinger L, Sakai N, Chen J, Neve R, Nestler EJ, Duman RS. Inhibition of cAMP response element-binding protein or dynorphin in the nucleus accumbens produces an antidepressant-like effect. J Neurosci. 2002;22:10883–10890. doi: 10.1523/JNEUROSCI.22-24-10883.2002. [DOI] [PMC free article] [PubMed] [Google Scholar]
- Ortega A, Blount JF, Manchand PS. Salvinorin, a New Trans-Neoclerodane Diterpene from Salvia-Divinorum (Labiatae) Journal of the Chemical Society-Perkin Transactions. 1982;1:2505–2508. [Google Scholar]
- Pasternak GW. Pharmacological Mechanisms of Opioid Analgesics. Clinical Neuropharmacology. 1993;16:1–18. doi: 10.1097/00002826-199302000-00001. [DOI] [PubMed] [Google Scholar]
- Prisinzano TE. Natural Products as Tools for Neuroscience: Discovery and Development of Novel Agents to Treat Drug. Journal of Natural Products. 2009;72:581–587. doi: 10.1021/np8005748. [DOI] [PMC free article] [PubMed] [Google Scholar]
- Prisinzano TE, Rothman RB. Salvinorin A analogs as probes in opioid pharmacology. Chem Rev. 2008;108:1732–1743. doi: 10.1021/cr0782269. [DOI] [PMC free article] [PubMed] [Google Scholar]
- Roth BL, Baner K, Westkaemper R, Siebert D, Rice KC, Steinberg S, Ernsberger P, Rothman RB. Salvinorin A: a potent naturally occurring nonnitrogenous kappa opioid selective agonist. Proc Natl Acad Sci U S A. 2002;99:11934–11939. doi: 10.1073/pnas.182234399. [DOI] [PMC free article] [PubMed] [Google Scholar]
- Shippenberg TS, Rea W. Sensitization to the behavioral effects of cocaine: modulation by dynorphin and kappa-opioid receptor agonists. Pharmacol Biochem Behav. 1997;57:449–455. doi: 10.1016/s0091-3057(96)00450-9. [DOI] [PubMed] [Google Scholar]
- Simonin F, Valverde O, Smadja C, Slowe S, Kitchen I, Dierich A, Le Meur M, Roques BP, Maldonado R, Kieffer BL. Disruption of the kappa-opioid receptor gene in mice enhances sensitivity to chemical visceral pain, impairs pharmacological actions of the selective kappa-agonist U-50,488H and attenuates morphine withdrawal. Embo J. 1998;17:886–897. doi: 10.1093/emboj/17.4.886. [DOI] [PMC free article] [PubMed] [Google Scholar]
- Teksin ZS, Lee IJ, Nemieboka NN, Othman AA, Upreti VV, Hassan HE, Syed SS, Prisinzano TE, Eddington ND. Evaluation of the transport, in vitro metabolism and pharmacokinetics of Salvinorin A, a potent hallucinogen. European Journal of Pharmaceutics and Biopharmaceutics. 2009;72:471–477. doi: 10.1016/j.ejpb.2009.01.002. [DOI] [PMC free article] [PubMed] [Google Scholar]
- Tidgewell K, Harding WW, Schmidt M, Holden KG, Murry DJ, Prisinzano TE. A facile method for the preparation of deuterium labeled salvinorin A: synthesis of [2,2,2-2H3]-salvinorin A. Bioorg Med Chem Lett. 2004;14:5099–5102. doi: 10.1016/j.bmcl.2004.07.081. [DOI] [PubMed] [Google Scholar]
- Tsujikawa K, Kuwayama K, Miyaguchi H, Kanamori T, Iwata YT, Inoue H. In vitro stability and metabolism of salvinorin A in rat plasma. Xenobiotica. 2009:1–8. doi: 10.1080/00498250902769967. [DOI] [PubMed] [Google Scholar]
- Valdes LJ, Butler WM, Hatfield GM, Paul AG, Koreeda M. Divinorin-a, a Psychotropic Terpenoid, and Divinorin-B from the Hallucinogenic Mexican Mint Salvia-Divinorum. Journal of Organic Chemistry. 1984;49:4716–4720. [Google Scholar]
- Wang Y, Chen Y, Xu W, Lee DY, Ma Z, Rawls SM, Cowan A, Liu-Chen LY. 2-Methoxymethyl-salvinorin B is a potent kappa opioid receptor agonist with longer lasting action in vivo than salvinorin A. J Pharmacol Exp Ther. 2008;324:1073–1083. doi: 10.1124/jpet.107.132142. [DOI] [PMC free article] [PubMed] [Google Scholar]
- Zhang Y, Butelman ER, Schlussman SD, Ho A, Kreek MJ. Effects of the plant-derived hallucinogen salvinorin A on basal dopamine levels in the caudate putamen and in a conditioned place aversion assay in mice: agonist actions at kappa opioid receptors. Psychopharmacology (Berl) 2005;179:551–558. doi: 10.1007/s00213-004-2087-0. [DOI] [PubMed] [Google Scholar]


