

Abstract
Background
A chromosome 9p21 locus is associated with coronary heart disease (CHD) in at least 25 independent populations, but multiple clinically-distinct phenotypes have been evaluated. Utilizing angiographic coronary artery disease (CAD) phenotyping, this study evaluated whether 9p21 single nucleotide polymorphisms (SNPs) predict ischemic events (e.g., myocardial infarction [MI]) among CAD patients.
Methods and Results
Patients undergoing coronary angiography during 1994-2007 (population set 1A: N=1,748; set 1B: N=1,014) were evaluated for association of a 9p21 tagging SNP (rs2383206, A→G) with incident MI and death events among patients with angiographically-significant CAD. Another hypothesis evaluated rs2383206 in two additional angiographic sets of both CAD and non-CAD patients (set 2A: N=2,122; set 2B: N=1,466) for prevalent MI vs. CAD/no MI (and for MI vs. non-CAD and CAD/no MI vs. non-CAD). No association of rs2383206 was found with events in set 1A (OR=0.95 per G allele, p-trend=0.48) and set 1B (OR=0.91 per G allele, p-trend=0.28), or with MI vs. CAD/no MI in set 2A (OR=0.96 per G allele, p-trend=0.57) and set 2B (OR=0.89 per G allele, p-trend=0.21). In contrast, rs2383206 was associated with CAD/no MI compared with non-CAD (set 2A: p-trend=0.0001; set 2B: p-trend=0.0008).
Conclusions
The chromosome 9p21 locus was not associated with incident events or prevalent MI, although it did predict CAD diagnosis. This contradicts reports of a 9p21 association with MI, likely due to differences in phenotype assignment. This suggests that high-quality phenotyping for CAD and MI is required to dissect the specific contributions of genetic variation to each stage of CHD pathophysiology.
Keywords: atherosclerosis, coronary disease, epidemiology, genetics, myocardial infarction
Background
A flurry of recent studies have verified that a genetic locus at chromosome 9p21 is associated with coronary heart disease (CHD) in at least 25 independent case-control populations.(1-9) The first widely-replicated genetic association of a common sequence variant for CHD, 9p21 has been associated with coronary artery disease (CAD), coronary revascularization, ischemic events, coronary calcium, myocardial infarction (MI), cerebrovascular event, and composite CHD phenotypes.(1-9)
While inter-related, these phenotypes are clinically distinct manifestations. Pathophysiologic understanding and clinical decisions may vary substantially based on which phenotype is utilized (e.g., coronary calcification vs. CAD vs. MI), thus it is not yet clear how 9p21 affects CHD pathogenesis or how testing for 9p21 variants will guide patient care.
Further, most populations evaluated for 9p21 utilized controls that were apparently healthy (i.e., no CHD history) or free from CHD events during follow-up.(1-9) A few defined the control phenotype by coronary angiography (Pennsylvania and Durham[2], South Korea [6], and Utah [9]). With such high-quality CAD phenotyping from this most widely accepted method of CAD assessment, both control and case phenotype-refinement is possible. This may be critical since the onset of atherosclerosis, its progression and severity, and the precipitation of clinical events are likely predicted by unique sets of genetic variants.(10,11)
This study evaluated whether single nucleotide polymorphisms (SNPs) at 9p21 predict incident events (i.e., MI/death) and prevalent MI in addition to CAD diagnosis.
Methods
The primary source of study participants was patients undergoing coronary angiography at hospitals within the Utah-based Intermountain Healthcare system who consented to participate in the catheterization registry of the Intermountain Heart Collaborative Study. Between August 1994 and August, 2007, more than 14,000 patients (men and women) underwent angiography and were enrolled in the registry. This study was approved by the Intermountain Healthcare Institutional Review Board.
The primary hypothesis was that chromosome 9p21 SNPs are associated with incident coronary events (i.e., nonfatal MI or death) among CAD patients during longitudinal follow-up after hospital discharge. The second hypothesis was that 9p21 SNPs are associated with prevalent MI among CAD patients at the time of angiography. Confirmatory hypotheses compared MI vs. non-CAD, and CAD without MI (i.e., CAD/no MI) vs. non-CAD patients.
Definitions of phenotypes
Nested case-control populations (Table 1) were developed among CAD patients for incident MI/death events vs. no event (population sample set 1) and for prevalent CAD (including CAD with MI and CAD without MI) vs. non-CAD patients (population set 2). For each phenotype, an initial test population sample (set A) and a second replication sample (set B) were created, thus four sets were evaluated: 1A, 1B, 2A, and 2B.
Table 1.
Population samples tested and comparisons made in this study.
| Population Sample Set | Patient Composition | Comparisons | Events/Cases | Non-Events/Controls |
|---|---|---|---|---|
| 1A. Incident MI/death events | CAD patients | Event vs. no event | n=869 | n=879 |
| 1B. Incident MI/death events | CAD patients | Event vs. no event | n=507 | n=507 |
| 2A. Prevalent disease | CAD & non-CAD | MI vs. CAD/no MI | n=504 | n=546 |
| MI vs. non-CAD | n=504 | n=1,072 | ||
| CAD/no MI vs. non-CAD | n=546 | n=1,072 | ||
| 2B. Prevalent disease | CAD & non-CAD | MI vs. CAD/no MI | n=269 | n=708 |
| MI vs. non-CAD | n=269 | n=489 | ||
| CAD/no MI vs. non-CAD | n=708 | n=489 |
CAD presence was determined by standard coronary angiography, with findings graded by a cardiologist who was unaware of genetic test results. Patients were categorized as free of CAD (i.e., clean coronaries or minimal <10% stenosis), mild to moderate CAD (i.e., most severe lesion 10%-69% stenosis), or clinically-significant CAD (i.e., ≥1 lesion of ≥70% stenosis). The mild/moderate CAD phenotype was excluded as indeterminate.
In sets 2A and 2B, prevalent MI was defined as any MI in the patient's prior history or acute MI at the index hospital admission, representing an initial MI prior to treatment. MIs were determined from Intermountain Healthcare's electronic record repository and ruled-in by ECG and biomarker measurements. Biomarker evidence was a CK-MB >6 mg/dl and a CK-MB index >3% in the appropriate clinical setting. In the absence of biomarker evidence, MI was defined by ECG criteria if present on multiple clinically-indicated ECG recordings. Prior MI without biomarker or ECG evidence was considered a non-event.
For the incident event population sets (1A and 1B), MI was defined based on the criteria above but was counted only if it occurred following discharge from the index hospitalization. Death events were determined from a query of the Social Security death master file, Utah State Health Department death certificate records, and hospital informatics databases. These MI and death data represent break-through events occurring despite clinical interventions and medical treatments.
Random population controls
A population-based control sample was assembled by invitation (letters and follow-up telephone calls) to a randomly-selected population-wide sample from the greater Salt Lake City metropolitan area (within a radius of about 65 miles) based on public records. Responders were scheduled for a clinic appointment where they completed a health-related questionnaire, had vital signs taken, and donated blood for study-related testing. In keeping with prior methods,(9) these controls were analyzed in set 2A.
Test and replication sets
For patient sets 1A and 1B, cases with incident death or MI and non-event controls were matched 1:1 for sex, age (±2 years), and nearest date of entry into the registry (maximum: ±1 year). Patients were selected from 1994-2003 for the test set and from 1994-2007 for the replication set, with all cases meeting the age/sex criteria included in the study (random assignment to the test or replication set was used initially to ensure representative selection of patients).
Set 2A comprised all case patients (and matching controls) enrolled during the years 1994–2002 and the random population controls. This prevalent disease test set (set 2A) overlapped 23% with the incident event test set (set 1A) due to inclusion of some of the same CAD patients in evaluation of both hypotheses. The prevalent disease replication set (set 2B) included all case patients from the years 2003–2007 (and matching controls) and overlapped 42% with the incident event replication set (set 1B). Three-member sets of early-onset CAD cases and age-matched controls were selected by matching 2:1 for age, sex, and nearest date of registry entry. Early-onset disease was defined as angiographic CAD at age ≤55 years in men and ≤65 years in women in set 2A. Due to changing disease demographics, set 2B cases were men ≤60 years and women ≤70.
9p21 genetic data
Genotyping of rs2383206, rs2383207, rs10757274, and rs10757278 single nucleotide polymorphisms (SNPs) was performed with 5′ exonuclease (Taqman®) chemistry on the ABI Prism® 7000 (Applied Biosystems, Foster City, CA).
Clinical information
Demographic and health history data were obtained from physicians and hospital records, including age, sex, body mass index (BMI), ethnicity, smoking status, hypertension, hyperlipidemia, diabetes, and family history of CHD. Smoking was considered present for active smokers or those with a >10 pack-year history. Prevalent diabetes mellitus, hyperlipidemia, and hypertension were physician-reported from clinical and laboratory findings or were based on current use of relevant medications. For laboratory findings, diabetes was defined as fasting glucose ≥126 mg/dL; hypertension as systolic blood pressure ≥140 mmHg or diastolic blood pressure ≥90 mmHg; and hyperlipidemia as fasting total cholesterol ≥200 mg/dL or low-density lipoprotein cholesterol (LDL-C) ≥130 mg/dL. Patient-reported family history of CHD was positive if a first-order relative suffered cardiovascular death, MI, or coronary revascularization before age 65.
Other variables for use in modeling of incident events included prior MI (physician-reported, occurring >30 days before admission), prior cerebrovascular accident (CVA, physician-reported), clinically-diagnosed heart failure, and clinical renal failure. Presentation included stable angina (stable exertional symptoms only, including a positive stress test result, or non-anginal indications such as valvular heart disease or pre-surgical evaluation), unstable angina (progressive symptoms or symptoms at rest), or acute MI. Number of diseased vessels was determined from angiography. Hospital treatment approach included medication only, percutaneous coronary intervention, or coronary bypass surgery. Discharge prescriptions included statins, beta-adrenergic receptor (β)-blockers, angiotensin-converting enzyme (ACE) inhibitors, and diuretics.
Statistical considerations
Selecting one or a few SNPs to “tag” the variance of multiple correlated SNPs that are in linkage disequilibrium (LD) reduces the number of tests of association and, thus, limits the need to correct for multiple comparisons. LD group analysis was used prior to association analysis to select a tagging SNP (tSNP) for the four 9p21 SNPs. Analysis was performed in sets 1A and 2A, and used a previously-described factor analysis method that extracts LD groups and tSNPs using the principal component approach.(12) Pair-wise LD was plotted using Haploview (http://www.broad.mit.edu/mpg/haploview) for visual evaluation of LD group structure.
Differences by genotype were tested for cases compared to controls using the Armitage test of trend, assuming an agnostic additive genetic model. Multivariable logistic regression provided adjusted odds ratios (ORs) and 95% confidence intervals (CI). For all multivariable models, included covariables were BMI, ethnicity, hypertension, hyperlipidemia, diabetes, smoking, and family history of CHD. For multivariable incident event models, additional covariables were heart failure, renal failure, prior MI, prior CVA, presentation, number of diseased vessels, in-hospital treatment modality, and discharge prescriptions. Cox regression was not used for incident event analysis since non-event patients were matched to events by time period and follow-up averaged 6.7 and 3.6 years for sets 1A and 1B, respectively;(13) further, post hoc analysis confirmed that Cox results approximated those from logistic regression.
Further SNP analysis was performed for the Duke CAD Index, number of diseased vessels, left main coronary disease, ostial disease, and proximal disease.(14,15) These associations used the test for linear contrasts in analysis of variance or the Armitage test of trend, as appropriate.
Schunkert et al, Table 2,(8) provides data for “pooled CAD only MI” (i.e., MI) cases and “pooled CAD without MI” (i.e., CAD/no MI) cases. The case groups were not compared previously,(8) thus fixed effects logistic regression tested those data for the association of rs1333049 genotype frequencies (C=risk allele [8]) with MI vs. CAD/no MI for further examination of 9p21 associations with MI.
Table 2.
Baseline characteristics in the incident event patient sets, stratified by rs2383206 genotype.
| Population Sample Set 1A | Population Sample Set 1B | |||||||
|---|---|---|---|---|---|---|---|---|
| Characteristic | AA | AG | GG | p-trend | AA | AG | GG | p-trend |
| Age (years) | 63±10 | 63±10 | 63±10 | 0.35 | 62±10 | 61±10 | 62±9 | 0.61 |
| Sex (male) | 79% | 76% | 78% | 0.90 | 73% | 75% | 70% | 0.35 |
| Non-Caucasian | 15% | 13% | 16% | 0.97 | 9% | 9% | 8% | 0.98 |
| Body mass (kg/m2) | 29±6 | 29±6 | 29±6 | 0.98 | 30±6 | 31±6 | 30±6 | 0.62 |
| Hypertension | 62% | 63% | 58% | 0.14 | 63% | 66% | 67% | 0.30 |
| Hyperlipidemia | 61% | 60% | 65% | 0.17 | 65% | 68% | 68% | 0.51 |
| Diabetes | 21% | 26% | 25% | 0.14 | 28% | 29% | 32% | 0.26 |
| Smoking | 23% | 28% | 26% | 0.35 | 23% | 19% | 19% | 0.33 |
| Family History* | 39% | 44% | 44% | 0.20 | 44% | 48% | 44% | 0.95 |
| Prior MI† | 10% | 14% | 15% | 0.07 | 7% | 8% | 8% | 0.73 |
| Prior CVA‡ | 2% | 2% | 1% | 0.75 | 2% | 3% | 3% | 0.45 |
| Heart Failure | 15% | 15% | 14% | 0.78 | 14% | 17% | 16% | 0.56 |
| Renal Failure | 6% | 5% | 4% | 0.12 | 3% | 3% | 3% | 0.81 |
| Presentation on Admission | ||||||||
| Stable¶ | 43% | 42% | 39% | 44% | 43% | 41% | ||
| USA§ | 31% | 36% | 36% | 29% | 31% | 35% | ||
| Acute MI* | 26% | 22% | 25% | 0.45 | 27% | 26% | 25% | 0.92 |
| Number of Significantly Diseased Vessels | ||||||||
| 1 | 40% | 39% | 35% | 43% | 43% | 40% | ||
| 2 | 27% | 27% | 28% | 25% | 31% | 31% | ||
| 3 | 34% | 34% | 37% | 0.15 | 31% | 26% | 29% | 0.87 |
| Treatment Type | ||||||||
| Medical | 49% | 54% | 52% | 39% | 39% | 39% | ||
| PCI** | 30% | 26% | 26% | 55% | 56% | 56% | ||
| CABG†† | 21% | 20% | 22% | 0.85 | 6% | 5% | 5% | 0.95 |
| Discharge Prescriptions | ||||||||
| Statins | 37% | 40% | 42% | 0.11 | 62% | 63% | 62% | 0.97 |
| β-Blockers | 63% | 65% | 67% | 0.22 | 51% | 51% | 48% | 0.59 |
| ACE inhibitors‡‡ | 30% | 32% | 30% | 0.88 | 30% | 31% | 30% | 0.85 |
| Diuretics | 30% | 33% | 32% | 0.55 | 38% | 38% | 32% | 0.13 |
Family history of early coronary heart disease
Myocardial infarction
Cerebrovascular event
Stable exertional angina or non-anginal requirement for angiography
Unstable angina
Percutaneous coronary intervention
Coronary artery bypass grafting
Angiotensin-converting enzyme inhibitors.
Genetic association analyses were performed using SPSS (v.15.0, SPSS Inc., Chicago, IL). Post hoc power analyses using nQuery 4.0 computed power to detect OR=1.29 (see Schunkert [8]) based on the sample sizes from sets 1A and 1B; further, the detectable OR at 80% power was computed for sets 1A and 1B assuming the G allele increases risk of MI and that the AA genotype had an MI proportion of 51% (assuming 2-sided tests, α=0.05). Given the a priori selection of one tSNP that accounted for the variance of the 4 SNPs, no correction for multiple comparisons was performed for SNPs, but due to the two tests of hypothesis for incident events and six tests for prevalent MI and CAD, correction for multiple comparisons required two-tailed p-values to be designated as significant at p≤0.00625. The authors had full access to and take full responsibility for the integrity of the data. All authors have read and agree to the manuscript as written.
Results
All four SNPs were in strong LD (r2=0.84-0.96, Figure 1). By factor analysis, factor loadings were 0.98, 0.99, 0.98, and 0.97 for rs10757274, rs2383206, rs2383207, and rs10757278, respectively, and all resided on one LD group that accounted for 96% of the observed variance. Based on these data, rs2383206 was selected as a tagging SNP (tSNP) to reduce the need to correct for multiple comparisons.
Figure 1.
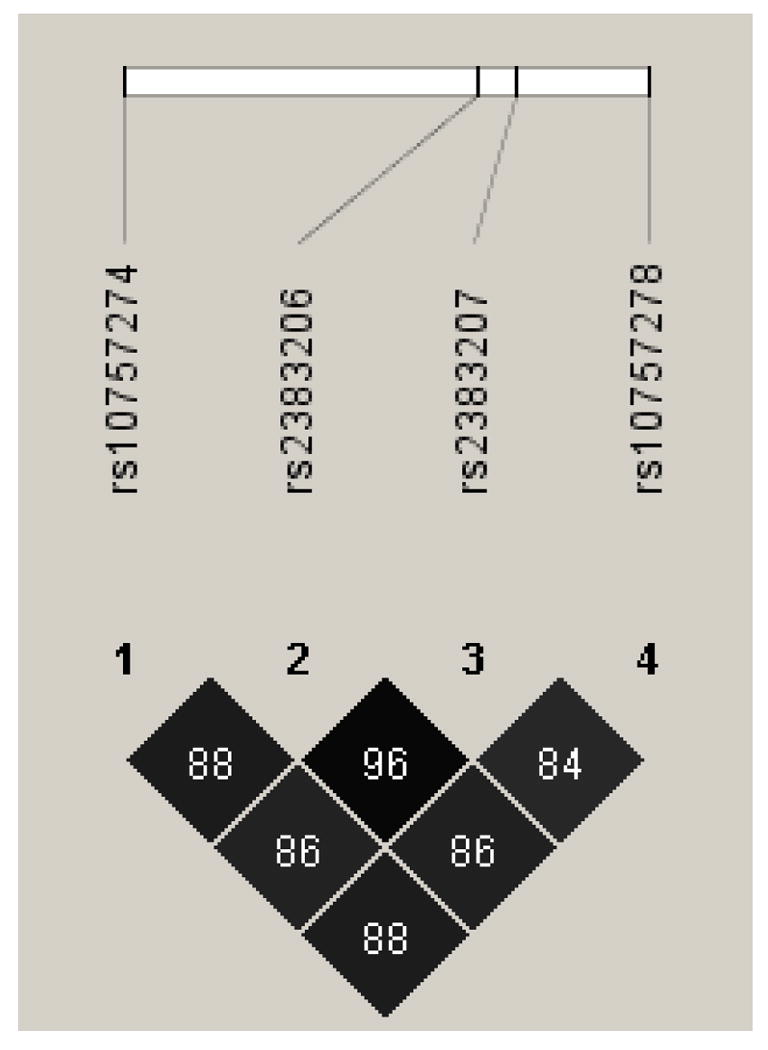
Pair-wise linkage disequilibrium (r2) values for the four 9p21 SNPs.
Baseline characteristics of the incident event population sets 1A and 1B were similar to each other, as shown in Table 2. Frequencies of AA, AG, and GG genotypes in set 1A were 22%, 48%, 30% and in set 1B were 23%, 48%, 29%, respectively. Baseline characteristics of the prevalent disease sets (sets 2A and 2B) are reported elsewhere.(9)
Association of 9p21 with incident events
Set 1A (test set)
Longitudinal patient follow-up averaged 6.7±2.1 years (maximum: 10.9 years) and 48% of cases were non-fatal MI. No association with events was found for rs2383206 (Figure 2). For AA, AG, and GG genotypes, events occurred in 51%, 50%, and 48% of patients, respectively (OR=0.95 per G allele [CI=0.83, 1.09], p-trend=0.48). Adjustment for hypertension, hyperlipidemia, ethnicity, BMI, diabetes, smoking, CHD family history, prior MI, prior CVA, heart failure, renal failure, presentation, coronary anatomy, interventional treatment type, and medical prescriptions did not affect this result (OR=0.94 per G allele [CI=0.82, 1.08], p-trend=0.38). Post hoc analysis also found no association for rs10757274 (p-trend=0.74), rs2383207 (p-trend=0.67), and rs10757278 (p-trend=0.66).
Figure 2.

Plots of the relative risk of incident acute events during longitudinal follow-up (compared to event-free CAD patients) and prevalent MI at the time of index angiography (compared to MI-free CAD patients).
Set 1B (replication set)
Longitudinal follow-up averaged 3.6±3.3 years (maximum: 14.1 years) and 55% of cases were non-fatal MI. As in set 1A, no association with events was found for rs2383206 (AA: 51%, AG: 51%, GG: 47%; OR=0.91 per G allele [CI=0.77, 1.08], p-trend=0.28). Multivariable adjustment for ethnicity, BMI, hypertension, hyperlipidemia, diabetes, smoking, family history, prior MI, prior CVA, heart failure, renal failure, presentation, coronary anatomy, interventional treatment type, and medical prescriptions did not affect findings: OR=0.91 per G allele (CI=0.77, 1.09), p-trend=0.32.
Post hoc power calculations for sets 1A and 1B
With its sample size, set 1A had 95% power to detect OR=1.29 for risk of incident events. Similarly, given its sample size, set 1B had 80% power to detect OR=1.29 for incident events. Assuming the AA genotype had the same proportion of MI as found in sets 1A and 1B (i.e., 51%), this study had 80% power to detect OR=1.21 per allele in set 1A and OR=1.28 per allele in set 1B.
Prevalent disease associations
Set 2A (test set)
Among those with angiographically-defined CAD, no association of rs2383206 with prevalent MI was found compared to CAD/no MI. MI was present in 53% (AA), 46% (AG), and 48% (GG), providing OR=0.96 per G allele (CI=0.80, 1.14) and p-trend=0.57. Adjustment for ethnicity, hypertension, hyperlipidemia, diabetes, smoking, family history, and BMI did not alter this finding (adjusted OR=0.96 per G allele, p-trend=0.62). In post hoc comparison, rs10757274 (p-trend=0.35), rs2383207 (p-trend=0.68), and rs10757278 (p-trend=0.37) also did not predict MI vs. CAD/no MI.
For the comparison of CAD/no MI (n=546) vs. non-CAD (n=1,072), CAD was present in 26%, 33%, and 39% of patients (p=0.0001) with AA, AG, and GG genotype, respectively (Table 3). A similar finding was recorded for the comparison of MI (n=504) vs. non-CAD, with MI found in 26%, 28%, and 36% of patients (p-trend=0.003) for AA, AG, and GG genotype, respectively (Table 3). These results were similar when adjusted for ethnicity, BMI, hypertension, hyperlipidemia, diabetes, smoking, and family history of early CHD (data not shown).
Table 3.
Association of 9p21 SNPs with prevalent MI and CAD compared to non-CAD controls. These findings confirm prior associations reported in the literature.
| Population Sample | Comparison | OR (95% CI) | p-trend |
|---|---|---|---|
| Set 2A | CAD/no MI vs. non-CAD | 1.33 per G allele (1.15,1.54) | 0.0001 |
| MI vs. non-CAD | 1.26 per G allele (1.08,1.47) | 0.003 | |
| Set 2B | CAD/no MI vs. non-CAD | 1.32 per G allele (1.12,1.55) | 0.0008 |
| MI vs. non-CAD | 1.16 per G allele (0.94,1.43) | 0.12 |
Set 2B (replication set)
No association was found of rs2383206 with prevalent MI (vs. CAD/no MI), with MI in 27% (AA), 30% (AG), and 23% (GG) of patients—trending toward lower risk (OR=0.89 per G allele [CI=0.73, 1.09], p-trend=0.21).
As in set 2A for CAD/no MI (n=708) vs. non-CAD (n=489), CAD was found in 52%, 59%, and 65% of patients (p-trend=0.0008) for AA, AG, and GG, respectively (Table 3). For MI (with CAD, n=269) vs. non-CAD, MI was present in 29%, 40%, and 37% of patients (p-trend=0.12) for AA, AG, and GG, respectively (Table 3). These results were similar when adjusted for ethnicity, BMI, hypertension, hyperlipidemia, diabetes, smoking, and family history of early CHD (data not shown).
9p21 (lack of) association with severity, extent, and location of CAD
No association by rs2383206 genotype was found for the mean number of severely-diseased vessels or Duke CAD Index (Table 4). Analysis of the location of CAD revealed no consistent association of genotype with left main, proximal, or ostial disease (Table 4).
Table 4.
Association of rs2383206 genotype with extent, severity, and location of CAD in the incident event (population sets 1A and 1B) and the prevalent disease patients (sets 2A and 2B, excluding the non-CAD patients).
| CAD Measure | AA | AG | GG | p-trend |
|---|---|---|---|---|
| Number of diseased vessels (mean) | ||||
| Set 1A | 1.94 | 1.95 | 2.02 | 0.15 |
| Set 1B | 1.88 | 1.83 | 1.89 | 0.87 |
| Set 2A | 1.79 | 1.70 | 1.78 | 0.87 |
| Set 2B | 1.74 | 1.72 | 1.78 | 0.57 |
| Duke CAD Index (mean) | ||||
| Set 1A | 46.4 | 47.0 | 48.5 | 0.10 |
| Set 1B | 47.5 | 45.8 | 46.8 | 0.75 |
| Set 2A | 44.7 | 43.8 | 45.4 | 0.42 |
| Set 2B | 43.0 | 43.8 | 44.8 | 0.32 |
| Left Main disease | ||||
| Set 1A | 3.6% | 3.5% | 2.3% | 0.26 |
| Set 1B | 5.3% | 6.2% | 7.3% | 0.36 |
| Set 2A | 1.4% | 2.9% | 2.6% | 0.49 |
| Set 2B | 3.3% | 5.2% | 6.1% | 0.20 |
| Proximal disease | ||||
| Set 1A | 31.3% | 35.6% | 32.5% | 0.86 |
| Set 1B | 47.1% | 37.7% | 39.7% | 0.12 |
| Set 2A | 35.9% | 34.9% | 42.9% | 0.06 |
| Set 2B | 40.6% | 31.8% | 38.9% | 0.98 |
| Ostial disease | ||||
| Set 1A | 5.3% | 6.5% | 5.5% | 0.99 |
| Set 1B | 7.1% | 7.7% | 7.3% | 0.95 |
| Set 2A | 2.4% | 4.5% | 6.1% | 0.048 |
| Set 2B | 3.9% | 5.0% | 6.1% | 0.29 |
9p21 and MI in published data (data source: reference 8, Table 2)
Comparison of MI vs. CAD/no MI data from 7 European case-control sets (N=4,456) found that rs1333049 was not associated with increased MI risk: OR=0.90 per C allele (95% CI=0.81, 0.99; p-trend=0.032). MI proportions were 79%, 76%, and 75% for genotypes GG, CG, and CC, respectively, with n=750, 1685, 976 among MI cases and n=196, 528, 321 among CAD/no MI participants.
Discussion
In this study, SNP rs2383206 was an efficient marker of variation at the 9p21 locus for 3 others in the region and, in association testing, was found to not be associated with longitudinal incidence of MI and death events in two population samples or with prevalent MI in another two population samples. Post hoc analysis confirmed this finding for the other 3 SNPs. Analysis of data reported by Schunkert (8) from participants in 7 European case-control sets but not previously evaluated for MI vs. CAD/no MI also showed a lack of increased MI risk for 9p21 risk allele carriers. These findings contrast with prior reports that 9p21 predicts MI or ischemic events,(1-4,7) or that it predicts CHD in population samples where a majority of cases were MIs.(5,8)
In contrast, rs2383206 was highly associated in patient sets 2A and 2B with the diagnosis of CAD (excluding patients with MI) when compared to non-CAD patients. Those associations were robust, with significance probabilities that withstood conservative correction for multiple comparisons. Association of rs2383206 was also present in patient sets 2A and 2B for MI cases (who have CAD) compared with non-CAD patients, but these did not achieve the corrected threshold for statistical significance. These findings support prior association reports for 9p21 SNPs,(1-8) but for CAD initiation only. The lack of association of 9p21 variation with extent and severity of CAD was surprising, however, but was consistent when analyzed in multiple ways (Table 4). The explanation for this apparent paradox will require additional study.
Clinical basis for this finding
Clinically, the phenotypes of MI and other coronary events (e.g., death) are not equal to the presence of coronary atherosclerosis (Figure 3). CAD may eventually manifest as acute coronary thrombotic occlusion, MI, and death, often due to the rupture of an unstable plaque,(16-18) but this usually occurs to plaques with a thin, eroded fibrous cap, regardless of the degree of narrowing.(18,19) Many patients live to advanced age with stable, significant CAD and never experience an MI. These clinical phenotypic differences were found previously to be important in genetic association studies of CAD and MI for a variety of genes, including CETP and ALOX5AP.(10,11) The importance of such distinctions cannot be overstated if pathophysiologic mechanisms are to be understood in scientific laboratories and if genetic markers are to be applied to clinical disease diagnosis and treatment decisions in medical practice.
Figure 3.

Simplified diagram of potential pathophysiologic mechanisms involved in CHD. The present study suggests that the role of the chromosome 9p21 locus in CHD involves the initiation or facilitation of atherosclerosis. It likely is not involved in the complexity of disease (e.g., number or severity of lesions) or the precipitation of coronary events (i.e., plaque destabilization or thrombosis). Also see reference 19.
High-quality phenotyping of both cases and controls is crucial for genetic association studies. Mis-classification of cases as controls due to poor phenotyping can bias a study towards the null hypothesis and result in artificially low power. Further, if—as in this study—multiple related phenotypes are possible for a disease process but are clinically distinct, inadequate phenotype characterization can confuse the interpretation of findings, potentially leading to erroneous conclusions.
The pertinent example of this is a test of association of sequence variants with MI cases compared to apparently healthy controls. That comparison may detect variants predisposing to MI, as is intuitively obvious, or it may reveal sequence variants that are predictive of various preceding stages of atherosclerosis that occurred leading up to the MI. The lack of knowledge about the coronary status of the controls or the use of normal controls clouds the interpretation. In contrast, if MI-free individuals with existing CAD are defined as the control group, the hypothesis test takes on new meaning.
Phenotype assignment is also important for cases because it enables clear separation of distinct clinical conditions, such as acute coronary events (e.g., MI) from stable atherosclerosis (i.e., CAD without MI). The need for this was evidenced herein both by a weaker association of 9p21 with MI compared to non-CAD, supporting the findings of prior studies,(5,8) and by the lack of association of 9p21 with MI (vs. CAD/no MI) and incident events (vs. CAD/no event). These findings support the concept that acute events and CAD differ pathologically and clinically.(10,11,16-19)
Poor phenotyping may lead to a wasting of effort and resources on unneeded investigations of disease pathophysiology, mistaken evaluation of potential therapeutic interventions, incorrect categorization of a patient's risk of expressing a specific phenotype, and improper assignment of genetically-individualized treatments. As a special example, some companies today are marketing diagnostic tests for MI that utilize variants at the 9p21 locus, but this study suggests that this may lead to unnecessary and improper clinical actions.
Need for greater clarity in CHD genetic studies
This study's findings suggest that the design of genetic association studies should be more precisely incorporated into an overall investigative framework. For example, large scale epidemiological studies using less precisely defined phenotypes might be used to discover regions of potential interest. These should be followed by additional studies that better examine the role of the variant for precisely-defined disease phenotypes.
The subsequent studies should be designed to clearly define the clinically-distinct phenotypes of MI, CAD without MI (which may be further subcategorized by the need for coronary revascularization or other measures of CAD severity or extent of atherosclerosis), non-CAD (e.g., angiographically phenotyped), and apparently healthy population normals (with lack of the phenotype serving as a surrogate indicator that the individual is a control but the recognition that this control group may be polluted by sub-clinical CAD cases).
Further sub-phenotypes are possible and should be considered, such as diffuse arterial disease (which often occurs in diabetics) compared to focal lesions, or location of coronary disease (left main, proximal, or ostial compared to medial or distal) since location of atherosclerosis and other lesion characteristics may be inherited.(15) The phenotype differentiations may also be extended to categorizations of CVA, presence of carotid disease without CVA, and lack of both CVA and carotid atherosclerosis.
Careful assignment of cardiovascular phenotypes will aid in the interpretation of which sequence variants are involved in the initiation/facilitation (i.e., onset), and amplification/acceleration (i.e., severity) of atherosclerosis, and in the precipitation of an acute event (Figure 3; see also reference 20). Some methods of phenotype assignment are less accurate or precise than angiography (e.g., coronary calcium scanning),(21,22) thus the limitations of these methods should be considered carefully prior to study initiation and their relative merits considered in the interpretation and reporting of genetic associations. Additionally, new methods are being developed to non-invasively measure disease presence or to quantify the stability of plaque, and these should be integrated into the standardized framework as they are implemented so that their relative value is clear.
Strengths and Limitations
Despite that angiography is the most widely utilized, validated, and accepted quantitative method of CAD assessment, limitations to its research application may include that referral for angiography involves patient selection based on criteria that may make it difficult to generalize findings to the general population. However, adjustment for known cardiac risk factors and variables did not influence the findings in this study. Further, for previously-unknown risk factors such as chromosome 9p21 SNPs, such selection bias appears not to exist.(9) Also, while patients are referred for angiography based on selection factors, it is clear which patients have and do not have CAD. Finally, the ORs for carriage of the risk allele in the comparisons of CAD to non-CAD patients and MI to non-CAD patients in population sets 2A and 2B herein were similar to those reported by prior studies of 9p21 SNPs,(1-8) thus it is unlikely that this study's patient sample is of lesser quality than those previously-studied populations. Yet, unmeasured confounders may remain and other factors such as ethnic composition require further study to confirm these novel findings. The cross-sectional observation of a lack of influence of 9p21 variation on CAD extent, as opposed to prevalence, although consistent for several measures, should also be validated by prospective, longitudinal studies.
Conclusions
The chromosome 9p21 locus was not associated with incident MI/death events or with prevalent MI. This contradicts prior reports of a 9p21 association with MI, likely due to differences in defining phenotype: this study employed coronary angiography—the most widely utilized and accepted method of measuring CAD presence and extent—for both cases and controls. Importantly, evidence from this study of a strong 9p21 association with a risk difference between non-event CAD patients and CAD-free individuals validates prior reports of a link to atherosclerosis. These results suggest that high-quality phenotyping for CAD (e.g., angiographically) and, separately, for MI can successfully dissect the specific contributions of genetic variation to the distinctive stages of CHD pathophysiology, which should further advance the use of genetics in CHD diagnosis, prognosis, and treatment.
Acknowledgments
Funding Sources: This study was funded by NIH grant HL071878.
Footnotes
Disclosures: No conflicts of interest to disclose.
Trial Registration: NCT00406185 on ClinicalTrials.gov.
Clinical Perspective: Genetic variation at 9p21 represents the first widely-replicated association of a common sequence variant with coronary heart disease (CHD). However, the clinical CHD phenotype studied has varied widely across a broad clinical spectrum of cardiovascular disease (CVD) phenotypes, including myocardial infarction (MI), angina pectoris, coronary revascularization, angiographic coronary artery disease (CAD), coronary calcification, carotid intimal thickening/plaque, cerebrovascular events, cerebral or aortic aneurysms, and various composite CHD/CVD phenotypes. Although inter-related and overlapping, these phenotypes also represent clinically and pathophysiologically distinct manifestations of atherothrombotic disease. Thus it has not been clear which stage(s) of CHD expression are associated with 9p21. Further, control populations not angiographically assessed, as often used in these studies, may harbor an appreciable percentage of cases with subclinical CAD. This study sought to clarify the specific CHD phenotype associated with 9p21 by utilizing coronary angiography to precisely define the prevalence and the extent of CAD in a large cohort of prospectively assembled cases and controls. We first tested for an association of the 9p21 tagging SNP (rs2383206) with incident MI/death among patients with preexisting angiographic CAD. No association was observed with incident death/MI in either the initial or the replication samples. We next compared association of the 9p21 variant with prevalent MI versus CAD/no MI status. Again, no association was observed. In contrast, an important association of the SNP was observed with CAD prevalence (but not extent). These results suggest that the 9p21 locus variant may be associated with initiation of CAD rather than with the occurrence of MI.
References
- 1.McPherson R, Pertsemlidis A, Kavaslar N, Stewart A, Roberts R, Cox DR, Hinds DA, Pennacchio LA, Tybaerg-Hansen A, Folsom AR, Boerwinkle E, Hobbs HH, Cohen JC. A common allele on chromosome 9 associated with coronary heart disease. Science. 2007;316:1488–1491. doi: 10.1126/science.1142447. [DOI] [PMC free article] [PubMed] [Google Scholar]
- 2.Helgadottir A, Thorleifsson G, Manolescu A, Gretarsdottir S, Blondal T, Jonasdottir A, Jonasdottir A, Sigurdsson A, Baker A, Palsson A, Masson G, Gudbjartsson D, Magnusson KP, Andersen K, Levey AI, Backman VM, Matthiasdottir S, Jonsdottir T, Palsson S, Einarsdottir H, Gunnarsdottir S, Gylfason A, Vaccarino V, Hooper WC, Reilly MP, Granger CB, Austin H, Rader DJ, Shah SH, Quyyumi AA, Gulcher JR, Thorgeirsson G, Thorsteinsdottir U, Kong A, Stefansson K. A common variant on chromosome 9p21 affects the risk of myocardial infarction. Science. 2007;316:1491–1493. doi: 10.1126/science.1142842. [DOI] [PubMed] [Google Scholar]
- 3.Samani NJ, Erdmann J, Hall AS, Hengstenberg C, Mangino M, Mayer B, Dixon RJ, Meitinger T, Braund P, Wichmann HE, Barrett JH, König IR, Stevens SE, Szymczak S, Tregouet DA, Iles MM, Pahlke F, Pollard H, Lieb W, Cambien F, Fischer M, Ouwehand W, Blankenberg S, Balmforth AJ, Baessler A, Ball SG, Strom TM, Brænne I, Gieger C, Deloukas P, Tobin MD, Ziegler A, Thompson JR, Schunkert H. Genomewide association analysis of coronary artery disease. N Engl J Med. 2007;357:443–453. doi: 10.1056/NEJMoa072366. [DOI] [PMC free article] [PubMed] [Google Scholar]
- 4.Larson MG, Atwood LD, Benjamin EJ, Cupples LA, D'Agostino RB, Sr, Fox CS, Govindaraju DR, Guo CY, Heard-Costa NL, Hwang SJ, Murabito JM, Newton-Cheh C, O'Donnell CJ, Seshadri S, Vasan RS, Wang TJ, Wolf PA, Levy D. Framingham Heart Study 100K project: genome-wide associations for cardiovascular disease outcomes. BMC Med Genet. 2007;8(Suppl I):S5–S13. doi: 10.1186/1471-2350-8-S1-S5. [DOI] [PMC free article] [PubMed] [Google Scholar]
- 5.Broadbent HM, Peden JF, Lorkowski S, Goel A, Ongen H, Green F, Clarke R, Collins R, Franzosi MG, Tognoni G, Seedorf U, Rust S, Eriksson P, Hamsten A, Farrall M, Watkins H. Susceptibility to coronary artery disease and diabetes is encoded by distinct, tightly linked SNPs in the ANRIL locus on chromosome 9p. Hum Molec Genet. 2008;17:806–814. doi: 10.1093/hmg/ddm352. [DOI] [PubMed] [Google Scholar]
- 6.Shen GQ, Li L, Rao S, Adbullah KG, Ban JM, Lee BS, Euy J, Wang QK. Four SNPs on chromosome 9p21 in a South Korean population implicate a genetic locus that confers high cross-race risk for development of coronary artery disease. Arterioscler Thromb Vasc Biol. 2008;28:360–365. doi: 10.1161/ATVBAHA.107.157248. [DOI] [PubMed] [Google Scholar]
- 7.Shen GQ, Rao S, Martinelli N, Li L, Olivieri O, Corrocher R, Abdullah KG, Hazen SL, Smith J, Barnard J, Plow EF, Girelli D, Wang QK. Association between four SNPs on chromosome 9p21 and myocardial infarction is replicated in an Italian population. J Hum Genet. 2008;53:144–150. doi: 10.1007/s10038-007-0230-6. [DOI] [PubMed] [Google Scholar]
- 8.Schunkert J, Götz A, Braund P, McGinnis R, Tregouet DA, Mangino M, Linsel-Nitschke P, Cambien F, Hengstenberg C, Stark K, Blankenberg S, Tiret L, Ducimetiere P, Keniry A, Ghori MJR, Schreiber S, Mokhtari NEE, Hall AS, Dixon RJ, Goodall AH, Liptau H, Pollard H, Schwarz DF, Hothorn LA, Wichmann HE, König IR, Fischer M, Meisinger C, Ouwehand W, Deloukas P, Thompson JR, Erdmann J, Ziegler A, Samani NJ. Repeated replication and a prospective meta-analysis of the association between chromosome 9p21.3 and coronary artery disease. Circulation. 2008;117:1675–1684. doi: 10.1161/CIRCULATIONAHA.107.730614. [DOI] [PMC free article] [PubMed] [Google Scholar]
- 9.Anderson JL, Horne BD, Kolek MJ, Muhlestein JB, Mower CP, Park JJ, May HT, Camp NJ, Carlquist JF. Variants at the 9p21 locus robustly predict angiographic CAD independent of standard risk factors. Am Heart J. 2008 doi: 10.1016/j.ahj.2008.07.006. In press. [DOI] [PubMed] [Google Scholar]
- 10.Girelli D, Martinelli N, Trabetti E, Olivieri O, Cavallari U, Malerba G, Busti F, Friso S, Pizzolo F, Pignatti PF, Corrocher R. ALOX5AP gene variants and risk of coronary artery disease: an angiography-based study. Eur J Hum Genet. 2007;15:959–966. doi: 10.1038/sj.ejhg.5201854. [DOI] [PubMed] [Google Scholar]
- 11.Horne BD, Camp NJ, Anderson JL, Mower CP, Kolek MJ, Clarke JL, Carlquist JF. Multiple less common genetic variants explain the association of the cholesteryl ester transfer protein gene with coronary artery disease. J Am Coll Cardiol. 2007;49:2053–2060. doi: 10.1016/j.jacc.2007.02.039. [DOI] [PubMed] [Google Scholar]
- 12.Horne BD, Camp NJ. Principal component analysis for selection of optimal SNP-sets that capture intragenic genetic variation. Genet Epidemiol. 2004;26:11–21. doi: 10.1002/gepi.10292. [DOI] [PubMed] [Google Scholar]
- 13.Annesi I, Moreau T, Lellouch J. Efficiency of the logistic regression and Cox proportional hazards models in longitudinal studies. Stat Med. 1989;8:1515–1521. doi: 10.1002/sim.4780081211. [DOI] [PubMed] [Google Scholar]
- 14.Smith LR, Harrell FE, Jr, Rankin JS, Califf RM, Pryor DB, Muhlbaier LH, Lee KL, Mark DB, Jones RH, Oldham HN. Determinants of early versus late cardiac death in patients undergoing coronary artery bypass graft surgery. Circulation. 1991;84(suppl 5):III245–III253. [PubMed] [Google Scholar]
- 15.Fischer M, Broeckel U, Holmer S, Baessler A, Hengstenberg C, Mayer B, Erdmann J, Klein G, Riegger G, Jacob HJ, Schunkert H. Distinct heritable patterns of angiographic coronary artery disease in families with myocardial infarction. Circulation. 2005;111:855–862. doi: 10.1161/01.CIR.0000155611.41961.BB. [DOI] [PubMed] [Google Scholar]
- 16.Libby P. Coronary artery injury and the biology of atherosclerosis: inflammation, thrombosis, and stabilization. Am J Cardiol. 2000;86(suppl):3J–9J. doi: 10.1016/s0002-9149(00)01339-4. [DOI] [PubMed] [Google Scholar]
- 17.Libby P. What have we learned about the biology of atherosclerosis? The role of inflammation. Am J Cardiol. 2001;88(suppl):3J–6J. doi: 10.1016/s0002-9149(01)01879-3. [DOI] [PubMed] [Google Scholar]
- 18.Galis ZS, Sukhova GK, Lark MW, Libby P. Increased expression of matrix metalloproteinases and matrix degrading activity in vulnerable regions of human atherosclerotic plaques. J Clin Invest. 1994;94:2493–2503. doi: 10.1172/JCI117619. [DOI] [PMC free article] [PubMed] [Google Scholar]
- 19.van der Wal AC, Becker AR, van der Luce CM, Das PK. Site of intimal rupture or erosion of thrombosis in coronary atherosclerotic plaques is characterized by an inflammatory process irrespective of the dominant plaque morphology. Circulation. 1994;89:36–44. doi: 10.1161/01.cir.89.1.36. [DOI] [PubMed] [Google Scholar]
- 20.Hopkins PN, Hunt SC, Wu LL. Family history and genetic factors. In: Wong ND, Black HR, Gardin JM, editors. Preventive Cardiology, A Practical Approach. New York: McGraw-Hill; 2005. pp. 92–148. [Google Scholar]
- 21.Akram K, Voros S. Absolute coronary artery calcium scores are superior to MESA percentile rank in predicting obstructive coronary artery disease. Int J Cardiovasc Imaging. 2008 doi: 10.1007/s10554-008-9305-5. Epub ahead of print. [DOI] [PubMed] [Google Scholar]
- 22.Greenland P, Bonow RO. How low-risk is a coronary calcium score of zero?: The importance of conditional probability. Circulation. 2008;117:1627–1629. doi: 10.1161/CIRCULATIONAHA.108.767665. [DOI] [PubMed] [Google Scholar]