

Abstract
Modification of iron oxide nanoparticles (NPs) synthesized by high temperature solvothermal routes is carried out using two silanes: (i) N-(6-aminohexyl)-aminopropyltrimethoxysilane (AHAPS) where only one end of the molecule reacts with the surface Fe-OH groups and (ii) 3-(triethoxysilyl)propylsuccinic anhydride (SSA) where both ends are reactive with Fe-OH. Depending on the NP synthesis protocol, the amount of surface OH groups on the NPs may differ, however, for all the cases presented here, the comparatively low OH group density prevents a high density of AHAPS coverage, yielding NP aggregates instead of single particles in aqueous solutions. Alternatively, use of SSA containing two terminal functionalities, anhydride and siloxy, which are both reactive towards the NP surface, results in the formation of discrete dense polymeric shells, providing stability of individual NPs in water. The mechanism of the SSA shell formation is discussed. The evolution of the chemical transformations leads to shells of different thickness and density, yet this evolution can be halted by hydrolysis, after which the NPs are water soluble, negatively charged and exhibit excellent stability in aqueous media.
1. Introduction
Recently, development of methods of nanoparticle (NP) functionalization has gained considerable attention due to potential applications of NPs as building blocks of nanomaterials fabrication1-4 and in biomedical research.5-11 In the majority of cases, these methods deal with a post-synthetic modification12 because monodisperse NPs are often obtained by solvothermal methods at high temperatures when capping ligand functionalities are either unstable or negatively influence the NP synthesis.13 For biomedical applications, iron oxide NPs are favored because they are generally stable in air and can be metabolized or degraded in vivo.14,15 Monodisperse iron oxide NPs are normally synthesized with oleic acid and/or long chain amines as capping agents, thus these particles do not have any functional end groups and are soluble only in organic solvents.16-20 Surface functionalization of iron oxide nanoparticles can be carried out in four major ways: (i) replacement of oleic acid or oleylamine with other functional molecules,21-23 (ii) formation of a functional shell due to hydrophobic interactions between the capping molecules and the hydrophobic tails of PEGylated phospholipids24,25 or amphiphilic copolymers,26,27 (iii) by controlled polymerization initiated from the NP surface23,28,29or (iv) by interaction with functional silanes.11,30-34
Each of these methods has its advantages and disadvantages. The exchange of adsorbing capping molecules is often incomplete and difficult to carry out in a controlled way. The two-phase modification where functional molecules are located in an aqueous layer may result in particle etching if the solution is acidic. The use of hydrophobic interactions for NP modification is a facile method of NP functionalization; however, it is limited to applications where no amphiphilic molecules are involved as the latter can induce disassembling of the hydrophobic bilayer. The controlled polymerization approach is normally used when comparatively thick shells are acceptable.
Silane attachment is the method of choice for stable NP coatings due to covalent bond formation. Unlike silane coating of Au or semiconductor NPs where either tetraethoxy silane35 or functional trialkoxysilanes36,37 can be used (the latter due to adsorption of functional groups on the NP surface followed by condensation of siloxy groups), iron oxide NPs are normally coated with silanes (usually, aminosilanes) via interaction with surface OH groups.11,30-34,38 In an anhydrous medium the iron oxide hydroxyl groups which are always present on the iron oxide nanoparticle surface (although their amount can be significantly varied depending on the methods of NP preparation) react with alkoxy groups of a silane, replacing a capping ligand and forming a covalent Fe-O-Si bond. The advantage of this method resides in the covalent bonding between the nanoparticle surface and the functional molecule. The coating is stable towards amphiphiles (for example, proteins or lipids). This method, however, often leads to significant aggregation of iron oxide NPs. In recent papers38,39 condensation catalysts were used to stimulate silane condensation and improve iron oxide coating with silanes, but these procedures were successful for NPs not exceeding 15 nm: for larger particles, they resulted in aggregation.38 Stabilization of larger magnetic NPs is especially challenging due to their strong interparticle interactions.
In the present paper we report functionalization of iron oxide nanoparticles with sizes between 9 and 20 nm with two silanes: (i) N-(6-aminohexyl)-aminopropyltrimethoxysilane (AHAPS) where only one end of the molecule reacts with the surface Fe-OH groups and (ii) 3-(triethoxysilyl)propylsuccinic anhydride (SSA) where both ends are reactive with Fe-OH. For the first time, bifunctional succinic anhydride containing silane is used for the formation of the discrete shells on the iron oxide NP surface resulting in stable water soluble individual NPs.
2. Experimental part
2.1. Materials
FeCl3·6H2O (98%), octadecane (99%), docosane (99%), iron pentacarbonyl (99.9%), octyl ether (97%), and trimethylamine N-oxide dihydrate (99%) were purchased from Sigma-Aldrich and used as received. Hexanes (85%), ethanol (95%), and acetone (99.78%) were purchased from EMD and used without purification. Chloroform (Mallinckrodt, 100%), oleic acid (TCI, 95%) and oleic acid sodium salt (ScienceLab.com, 95%) were used without purification. Tetrahydrofuran, THF (Mallinckrodt, 99.0%) was purified by PURE-SOLV systems (Innovative Technology, Inc). N-(6-Aminohexyl)-aminopropyltrimethoxysilane (AHAPS) (95%) and 3-(triethoxysilyl)propylsuccinic anhydride (SSA) (95%) were purchased from Gelest, Inc and used as received. Tris-borate-EDTA (TBE) buffer (10 × concentrate), Biotechnology Performance Certified was purchased from Sigma-Aldrich and used as received.
2.2. Iron oxide NP synthesis
2.2.1 Synthesis of γ-Fe2O3 nanoparticles (NP1) from iron pentacarbonyl Fe(CO)5
We followed the procedure described elsewhere.40 In a typical experiment, a three-neck round-bottom flask (with elongated necks) equipped with a reflux condenser and two septa, one of which contains an inserted temperature probe protected with a glass shield, was charged with 10 mL of octyl ether and 1.28 g of oleic acid (4.56 mmol). The flask was degassed four times using “evacuation-filling with argon” cycles ending with filling with argon. Then the flask was placed in a Glas-Col heating mantle attached to a digital temperature controller. The temperature was increased to 100 °C and 0.2 mL of Fe(CO)5 (1.52 mmol) was added to the reaction flask. The resulting mixture was heated to reflux and refluxed for 1 h. This led to a color change from orange to black. The resulting black solution was cooled to room temperature and 0.34 g of dehydrated (CH3)3NO (4.56 mmol) was added. The mixture was then heated to 130 °C and maintained at this temperature for 2 h. Meanwhile, the solution turned brown. The reaction temperature was slowly increased to reflux and the reflux continued for 1 h; this resulted in a black solution. After cooling to room temperature the particles were precipitated with ethanol and separated by centrifugation.
2.2.2 Synthesis of iron oxide nanoparticles from Fe oleate
The synthesis of iron oleate was carried out according to a published procedure.41 The resultant iron oleate was either used as is after drying at 70 °C in a vacuum oven for 24 h (notation FeOl2, see ref. 20) or it was first extracted with ethanol and acetone to remove impurities, including oleic acid (which is formed during the iron oleate synthesis) and then dried at the above conditions (notation FeOl4, see ref. 20). The spherical iron oxide nanoparticles with a mean diameter of 20.1 nm (NP2) were synthesized using thermal decomposition of FeOl2, while NPs with 16.1 nm in diameter (NP3) were prepared from FeOl4.20
In a typical experiment for NP2, 2.78 g (3 mmol) of FeOl2, 0.96 mL of oleic acid (3 mmol), and 10 g of docosane (hydrocarbon C22H46, solid at room temperature) were placed in the reaction flask (see above for details regarding the flask and setup) and the flask was degassed four times (see above). Then the reaction mixture was first heated to 60 °C to melt the solvent and allow the reactants to dissolve during vigorous stirring. After that the temperature was increased to the solution’s boiling point (around 371 °C) with a heating rate of 3.3 °C per min (set temperature of 380 °C) under stirring and the solution was kept at reflux for 3 min. The initial reddish-brown color of the reaction solution turned brownish-black. The resultant solution was then cooled down to 50 °C and 50 mL of a mixture of hexane and acetone (volume ratio 1: 1) were added into the reaction flask to precipitate the NPs. The NPs were separated by centrifugation and washed three times by a mixture of hexane and acetone (volume ratio 1: 3). After washing, the resultant NPs were again separated in a centrifuge and dissolved in chloroform for storage. Alternatively, only a small fraction of the reaction solution was precipitated as described above, while the major fraction was kept as a solid solution and precipitated when needed. The latter procedure allows one to avoid NP aggregation in a liquid solution for prolonged storage time. Alternatively, the 16.1 nm spherical iron oxide nanoparticles (NP3) were made from FeOl4 as a precursor, while the reaction procedure was analogous to that described for NP2 except for oleic acid, the concentration of which was increased by a factor of 2.2 while the iron oleate concentration was decreased by a factor of 1.5.
2.3. Silane coating
To attach functional silanes on the NP surface, we used sonication in anhydrous THF at 50 °C in argon flow. In a typical experiment, 10 mg of NP2 were placed in a three-neck round-bottom flask in a chloroform solution and chloroform was evaporated with a rotary evaporator. Then the flask was equipped with a reflux condenser and two septa, charged with 0.04 mL of SSA, and degassed three times followed with filling with Ar. Anhydrous and degassed THF (10 mL) was added into the flask using a degassed syringe and needle. After 5-10 min of room temperature treatment in a sonication bath (Bransonic 1510R-DTH Ultrasonic cleaner) to redissolve the nanoparticles, sonication was carried at 50 °C for 100, 150 or 210 min. The resultant NPs were separated from the reaction solution by centrifugation at 9000 rpm for 20 min at room temperature and dissolved in anhydrous THF. The procedure was repeated four times to remove unreacted SSA. After that THF was evaporated and the purified functionalized NPs were hydrolyzed by mixing with 5% TBE buffer solution in a sonication bath for 20 min at 50 °C. The resultant NPs were separated by centrifugation, washed three times with Milli-Q water and redissolved in Milli-Q water to form a transparent brownish-black solution.
In the case of AHAPS, 10 mg of iron oxide NPs (NP1) reacted with 0.02 mL of AHAPS in 10 mL of THF at 50 °C for 45 min in a sonication bath. Longer reaction times resulted in uncontrolled silane condensation. After precipitation and washing (see above) the particles were redispersed in THF, ethanol or water at pH 3 after 30 min sonication.
2.4. Characterization
Electron-transparent specimens for transmission electron microscopy (TEM) were prepared by placing a drop of dilute solution onto a carbon-coated Cu grid. Images were acquired at an accelerating voltage of 80 kV on a JEOL JEM1010 transmission electron microscope. Images were processed with the Adobe Photoshop software package and analyzed with the Scion Image Processing Toolkit to estimate NP diameters. Typically, 150 to 300 NPs were used for analysis. Electron energy-loss spectroscopy (EELS) for elemental mapping was carried out in a scanning TEM mode using a Tecnai F20 electron microscope. High resolution TEM (HRTEM) images were acquired at accelerating voltage 200 kV on a JEOL 2200FS transmission electron microscope. The same TEM grids were used for all analyses.
Dynamic light scattering (DLS) measurements were carried out with a Zetasizer Nano-S instrument (Malvern). DLS was performed to measure the hydrodynamic diameter of suspended particles in a carrier solution. Typically the diluted sample underwent sonication for about 10-20 min and filtration with a 0.2 mm syringe filter before the measurement. Samples were loaded into low volume disposable sizing cuvettes. The measurement duration was set to be determined automatically, and data were averaged from at least three runs. Intensity and volume distributions of the particle sizes were recorded and analyzed.
Fourier transform infrared (FTIR) spectra were recorded on a Nicolet 510P FT-IR spectrometer. The iron oxide NP samples were prepared by evaporating the NP chloroform solutions on a KBr disk. The samples of the silane coated NPs were redissolved in anhydrous THF after purification and then evaporated on KBr disks.
X-Ray diffraction (XRD) patterns were collected on a Scintag theta-theta powder diffractometer with a Cu Kα source (0.154 nm).
Fe content was determined using X-ray fluorescence measurements performed with a Zeiss Jena VRA-30 spectrometer equipped with a Mo anode, a LiF crystal analyzer, and a SZ detector. Analyses were based on the Fe Kα line. A series of standards were prepared by mixing 1 g of polystyrene with 10-20 mg of standard compounds. The time of data acquisition was held constant at 10 s.
Magnetic measurements were performed on a Quantum Design MPMS XL magnetometer using the system DC measurement capabilities. Milligram quantities of the sample were placed in a standard gelatin capsule. For zero field cooling (ZFC) curves, the sample was cooled in a null field (+/-0.1 Oe) to 4.5 K. A 50 Oe field was then applied, and measurements were taken at regular temperature increments up to 300 K. The sample was then cooled in the 50 Oe field and the measurements repeated at the same temperature increments for the field cooling (FC) curves. These ZFC/FC curves were used to establish the blocking temperature. Magnetization measurements were also made at room temperature (300 K) by varying fields over a +7T to -7T range.
3. Results and discussion
3.1. Iron oxide nanoparticles coated with oleic acid
Iron oxide NPs were prepared using two methods. In the first method we followed the procedure described elsewhere.40 The TEM image of a typical sample obtained in this procedure is presented in Fig. 1a. The NPs (NP1) are uniformly spherical and monodisperse. The mean particle size calculated from the TEM images (out of 510 NPs) is 9.2 nm with a standard deviation of 3.4%. The XRD pattern of NP1 (Fig. 1b) contains peaks matching well the characteristic spinel reflections.42,43 In ref. 40 these particles are considered to be γ-Fe2O3 (maghemite). The calculation of the nanocrystal size from the line broadening of the XRD pattern (using the Scherer equation44) gives a value of 8.9 nm, revealing that these NPs are single crystals. This method, although it affords monodisperse nanocrystals, is laborious and time consuming and leads to nanoparticles in only a limited size range.42
Fig. 1.

TEM image (a) and XRD pattern (b) of iron oxide nanoparticles (NP1) prepared from Fe(CO)5 and oleic acid.
In the second method, we used thermal decomposition of iron oleates,17 modifying the procedure as described in our preceding paper.20 This allowed us to prepare monodisperse NPs ranging in diameter from 8.5 to 23.4 nm.20 As is reported in ref. 20, these NPs are not single crystals: their structure is composed of larger wüstite and smaller spinel crystallites. For the silane functionalization, we used the two NP samples prepared from iron oleates after a different post-synthesis treatment:20 the 20.1 nm (NP2) NPs derived from iron oleate (FeOl2)20 dried in a vacuum oven at 70 °C and the 16.1 nm NPs (NP3) derived from iron oleate (FeOl4)20 extracted with ethanol and acetone (to remove oleic acid formed during iron oleate synthesis) and dried in the same conditions. Different post-synthesis treatment of iron oleates leads to different iron oleate structures.20 At the same time, the crystalline structures of iron oxide NPs—the final products of thermal decomposition of iron oleates—are similar independently of the iron oleate structure as confirmed by X-ray powder diffraction (not shown) and the HRTEM data (see Fig. 2 for NP2 and NP3). However, a similarity in the crystalline structure of NPs does not necessarily mean a similarity in surface properties; the latter, however, are crucial for silane coating.
Fig. 2.
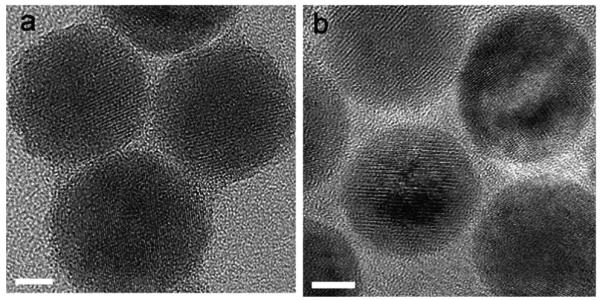
HRTEM images of NP2 and NP3. The scale bar represents 5 nm.
To probe surface properties, we used FTIR spectroscopy. The FTIR spectra of NP1, NP2 and NP3 are presented in Fig. 3.All the spectra contain a strong band at 570 cm-1 which is characteristic of Fe-O vibrations of iron oxides.45,46 The weaker vibrations at 1094 and 1025 cm-1 and 890 and 800 cm-1 can be assigned to surface Fe-OH groups.47,48 Comparison of the relative intensity of the Fe-O and Fe-OH vibrations reveals that the highest fraction of hydroxyl groups is located on NP2, while the lowest one is on NP3. Apparently different procedures of iron oxide NP formation and different precursors influence the NP surface properties. Because silane attachment occurs through reaction with surface hydroxyl groups, the density of silane coating should be proportional to the density of hydroxyl groups.
Fig. 3.

FTIR spectra of NP1, NP2, and NP3.
3.2. AHAPS coating
Aminopropyl-triethoxysilane is commonly used to place amino groups on NPs. In AHAPS chosen in this work, two amino groups are separated by six methylene groups allowing greater diversity of further NP functionalization and more interesting properties.
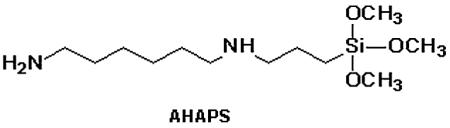
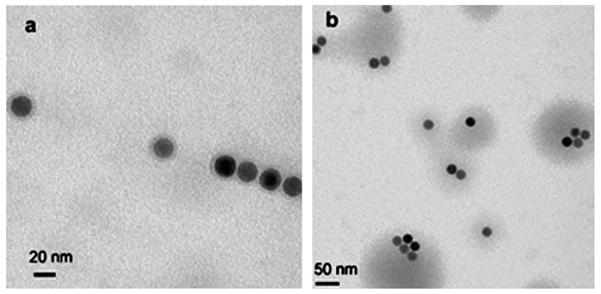
Fig. 4 shows TEM images of NP1 modified with AHAPS. Although initial NPs are perfectly soluble in hexane, after AHAPS coating they can be easily precipitated by hexane. Sonication of NP1-AHAPS in THF (Fig. 4a), ethanol (Fig. 4b) or water at pH 3 (when amino groups are protonated, Fig. 4c) yields particle dissolution.
Fig. 4.

TEM images of NP1-AHAPS cast from THF (a), ethanol (b) or water at pH 3 (c).
Magnetic properties of the NP1 sample before and after coating with AHAPS are presented in the ESI† (Fig. S1 and S2). In both cases, the NPs are superparamagnetic, while the changes in the magnetic properties are consistent with the replacement of capping molecules.
Fig. 4 demonstrates that the NPs both exist as individual entities and have a tendency to aggregate. However, the aggregation we observe might occur only on the TEM grid, not necessarily in solution. To probe this, we carried out DLS measurements (ESI,† Fig. S3). The mean hydrodynamic diameter for the volume-weighted size distribution of NP1-AHAPS is 51 nm. Note that the diameter of the individual NP1-AHAPS NPs (core size of 9.2 nm) should not exceed 11.4 nm even if the AHAPS molecules are fully extended in the NP shell, thus revealing formation of NP aggregates in the NP1-AHAPS solution. We believe that the low density of the OH groups on the NP1 surface (see Fig. 3) leads to the low density of the silane coating followed by aggregation. To explore this hypothesis, we carried out the same reaction with the NP2 sample, containing the highest fraction of OH groups among the NPs studied; however, NP2 has a much larger core diameter: 20.1 nm. As a result, NP2 showed a much stronger tendency to aggregation (ESI,† Fig. S4), suggesting that the OH group density was still insufficient and the larger particles are more prone to aggregation. This is consistent with stronger interparticle interactions between larger magnetic particles, than between smaller ones made of the same material.49,50 The volume-weighted size distribution of this sample in THF displays an intense peak with a mean hydrodynamic diameter of 450 nm (ESI,† Fig. S1) revealing formation of large NP aggregates. Thus, to stabilize larger magnetic particles, denser surfactant coating is needed which requires even higher density of the OH surface groups. Similar results were obtained for NP3-AHAPS (ESI,† Fig. S3), but the aggregates are slightly smaller owing to the smaller core size (16.1 nm).
Despite the aggregation, the change of solubility of the NPs treated with AHAPS unambiguously shows that replacement of oleic acid with the silane takes place. To characterize NP2-AHAPS more accurately, we carried out FTIR spectroscopy. The detailed description of the FTIR spectra is presented in the ESI,† Fig. S5. Here, we emphasize the unexpected change in the FTIR spectra of AHAPS molecules after attachment to the NP surface. The band at 1309 cm-1 in the AHAPS spectrum which can be assigned to CH2(N),51 nearly disappears in the spectrum of NP2-AHAPS. This was surprising considering that this group does not react during attachment to the iron oxide surface or silane condensation. On the other hand, we observed another consistent change in the AHAPS and NP2-AHAPS FTIR spectra. The broad band at 3283 cm-1 in the AHAPS FTIR spectrum that we assign to the primary and secondary amino group asymmetric stretching52 practically disappears in the NP2-AHAPS spectrum. Taking into account that the band at 1568 cm-1 in the NP2-AHAPS spectrum assigned to the amino group deformation vibrations53 remains very strong and broadens, we can suggest that the AHAPS amino groups are adsorbed on the iron oxide surface via hydrogen bond formation, yet this adsorption impedes stretching vibrations, but allows deformations. The adsorption of amino groups is consistent with the low density of AHAPS: if a dense AHAPS brush would form on the surface, the adsorption of amino groups would be prevented. Based on the FTIR data, we conclude that AHAPS coats the NPs, but this coverage is rather low and evidently insufficient to provide the individual NP stability (see discussion above).
Recently a slightly different procedure was reported to coat NPs with silanes where instead of heating or sonication, the catalyst (acetic acid) was added to the NP-silane mixture in hexane.38 The authors demonstrated attachment of various silanes. We followed this procedure for AHAPS attachment to NP2. According to our results the AHAPS coating takes place, however, the degree of aggregation in the aqueous solution at pH 238 is similar (data not shown) to that observed for the NP2-AHAPS sample prepared by sonication. Thus, the procedure with a catalyzed silane attachment does not provide more stable silane coated individual particles.
3.3. SSA coating
To overcome the limitation of low Fe-OH group density and to create a thicker and denser shell on the NP surface allowing stable water-soluble particles, we selected SSA, both ends of which are highly reactive. We chose NP2 for this study as these NPs contain the highest fraction of surface hydroxyl groups.
Sonication of NP2 with SSA for 150 min (see the experimental part for details) resulted in the formation of discrete well-defined shells of 3.6 nm thickness; the shell is clearly visible on the TEM image (Fig. 5a). The histogram obtained from the TEM image (Fig. 5c) shows that the mean particle size after shell formation is 27.3 nm. By the DLS data (ESI,† Fig. S6), the mean particle diameter is 32.7 nm, in good agreement with the TEM data.
Fig. 5.

(a) TEM image of NP2 functionalized with SSA for 150 min. The grey ring in the inset is the shell formed by attachment and condensation of SSA. (b) The same particles after two day storage in the purified THF solution (no free silane). The scale bar is 50 nm. Insets in (a) and (b) show higher magnification images of a single particle. (c), (d) Histograms of the TEM images of the samples presented in (a) and (b), respectively.
To our surprise, after two days the mean particle diameter of these purified NPs decreased to 22.7 nm (Fig. 5d), thus the shell thickness decreased from 3.6 to 1.3 nm. This result becomes comprehensible after a closer look at the TEM images presented in the insets in Fig. 5a and b. After two days the shell becomes much denser and hardly distinguishable from the iron oxide core. Because the free silane is removed during purification, the radial shell growth is blocked while the condensation within the silane shell continues to occur during storage, leading to the increase of the shell density (and respectively to the decrease of the shell size).
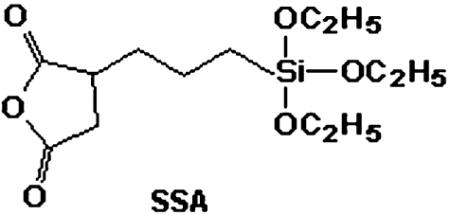
Chemical mapping by spatially resolved EELS (Fig. 6) shows that the iron and silicon compositional maps coincide, and thus the silicon-rich layer is located on the NP surface with SSA covering evenly the iron oxide NPs.
Fig. 6.
Iron (a) and silicon (b) compositional EELS maps of NP2 coated with SSA. The scale bar is 20 nm.
An especially astonishing result was obtained, however, when the reaction with SSA was carried out for 100 min instead of 150 min. The mean particle size in this sample measures 30.0 nm, thus making the shell thickness 5.0 nm. The decrease of the shell size from 5.0 to 3.6 nm in the reaction solution when the reaction time increases from 100 to 150 min is attributed to the limited functionality of NPs. Indeed, in this later time frame, free silane does not participate due to the lack of free surface OH groups or other hydrolyzing species (see below). Apparently, after 100 min the fixed but loose shell is already formed (Fig. 7a) while during 50 more minutes (Fig. 5a) mainly densification (condensation) of the polymeric shell occurs, leading to the decrease of the shell size.
Fig. 7.
TEM images of NP2 functionalized with SSA after 100 (a) and 210 (b) min reaction time.
On the other hand, further increase of the reaction time to 210 min results in uncontrolled condensation of the silane and particle aggregation (Fig. 7b). We believe that extended sonication is responsible for the silane self-condensation unrelated to the reaction with the surface hydroxyl groups.
According to the FTIR spectrum (Fig. 8) of the purified sample (no free SSA) after 150 min reaction, the bands at 1863 cm-1 (the asymmetric stretching of the carbonyl group νas(C=O)) and 1784 cm-1 (the symmetric stretching of the carbonyl group νs(C=O)) characteristic of an anhydride group52,54 are largely preserved. The band at 1733 cm-1 is assigned to the ester group.
Fig. 8.

FTIR spectrum of the NP2-SSA (after purification of the reaction solution, 150 min sonication).
The detailed NMR analysis of step by step shell formation in these systems is impossible because of line broadening due to magnetic species but based on the FTIR data and the finite shell size observed by TEM, we tentatively suggest the following mechanism of the SSA shell formation. We believe that the SSA anhydride group is very reactive and may react first with the surface hydroxyl group, Fe-OH (Scheme 1), replacing adsorbed oleic acid from the NP surface. After attachment via formation of the ester bond and the carboxylic group, a water molecule can be eliminated due to condensation between the other surface OH and the carboxylic group. The next step is the hydrolysis of the terminal siloxy group by released water with formation of a silanol group. Next the SSA molecule may react with the silanol group either via interaction with a siloxy group (hydrolytic condensation or sol-gel reaction) or via anhydride attachment. The former route will result in preservation of anhydride moieties while the latter one will lead to the presence of siloxy groups in the NP exterior. The FTIR data suggest that the anhydride moieties are mostly preserved revealing that the former route (hydrolytic condensation) is more favorable. The shell growth proceeds until all available OH and H2O species, which are able to initiate the growth, are reacted. Then the shell growth stops, while the condensation reaction may proceed further, leading to higher density of the polymeric shell.
Scheme 1.

Growth of the SSA shell.
Evolution of a well-defined polymeric shell can be halted by hydrolysis. Both siloxy and anhydride groups are easily hydrolyzed by brief sonication in 5% TBE buffer.55 After such hydrolysis the NPs with the SSA shells are well soluble in water and negatively charged: the Z-potential is -40.3 eV, which is comparable with that of the PEGylated phospholipid coated NPs used as successful templates for brome mosaic virus capsid self-assembling.25 These hydrolyzed NPs show no aggregation for several months as confirmed by DLS data (ESI,† Fig. S6). The mean hydrodynamic diameter increases slightly to 37.8 nm (vs. 32.8 nm for NP-SSA in THF) which is ascribed to the water cloud associated with NPs due to hydrogen bonding. The TEM image of these particles is presented in Fig. 9.
Fig. 9.

TEM image of NP2-SSA hydrolyzed with 5% TBE buffer (deposited on the carbon-coated TEM grid from an aqueous solution).
Note that the shell formation with SSA was also observed with NP3, but the SSA coated particles were stable only for a few days which we attribute to lower coverage by the silane due to a lower fraction of OH groups on the NP surface.
Hence the NP2-SSA solutions are more stable both in THF after purification and water than the solutions of NPs coated with AHAPS due to formation of well-defined SSA shells. Therefore, the low density of the OH groups on the iron oxide NP surface is overcome by multiple functionality of SSA.
4. Conclusions
The advantages of the silane-based approach of NP functionalization are the commercial availability of numerous functional silanes and the covalent attachment of silanes to the nanoparticle surface affording permanent particle stabilization. However, iron oxide NPs prepared by solvothermal methods at high temperatures bear a low fraction of hydroxyl groups on the NP surface preventing efficient silane coverage and stabilization of individual nanoparticles in solution: rather comparatively stable aggregates form. The anhydride containing silane, however, allows us to overcome this limitation due to building up multilayer shell via interactions of both anhydride and siloxy groups. The formation of a well-defined shell is determined by a finite number of hydroxyl groups on the NP surface along with a finite amount of produced hydrolyzing species. Subsequent evolution of the residual functionalities leads to shells of different thickness and density, yet this evolution can be halted by hydrolysis, after which the NPs are water soluble, negatively charged and exhibit excellent stability in aqueous media.
Supplementary Material
Acknowledgements
This work has been supported, in part, by the NATO Science for Peace Program (grant SfP-981438), NSF award 0631982, NIH award GM081029-01, NSF award 0220560, and the IU FRSP grant. B. D. acknowledges partial support from the Indiana METACyt Initiative of Indiana University, funded in part through a major grant from the Lilly Endowment, Inc.
Footnotes
Electronic Supplementary Information (ESI) available: Magnetic measurement data, DLS, TEM and FTIR. See DOI: 10.1039/b821917f/
References
- 1.Korth BD, Keng P, Shim I, Bowles SE, Tang C, Kowalewski T, Nebesny KW, Pyun J. J. Am. Chem. Soc. 2006;128:6562. doi: 10.1021/ja0609147. [DOI] [PubMed] [Google Scholar]
- 2.Son SJ, Lee SB. J. Am. Chem. Soc. 2006;128:15974. doi: 10.1021/ja0663632. [DOI] [PubMed] [Google Scholar]
- 3.Uzun O, Frankamp BL, Sanyal A, Rotello VM. Chem. Mater. 2006;18:5404. [Google Scholar]
- 4.Park S-J, Taton TA, Mirkin CA. Science. 2002;295:1503. doi: 10.1126/science.1067003. [DOI] [PubMed] [Google Scholar]
- 5.Li Y, Chen J, Zhu C, Wang L, Zhao D, Zhuo S, Wu Y. Spectrochim. Acta. 2004;60A:1719. doi: 10.1016/j.saa.2003.09.012. [DOI] [PubMed] [Google Scholar]
- 6.Roux S, Garcia B, Bridot J-L, Salome M, Marquette C, Lemelle L, Gillet P, Blum L, Perriat P, Tillement O. Langmuir. 2005;21:2526. doi: 10.1021/la048082i. [DOI] [PubMed] [Google Scholar]
- 7.Wang Q, Xu Y, Zhao X, Chang Y, Liu Y, Jiang L, Sharma J, Seo D-K, Yan H. J. Am. Chem. Soc. 2007;129:6380. doi: 10.1021/ja071434y. [DOI] [PubMed] [Google Scholar]
- 8.De M, You C-C, Srivastava S, Rotello VM. J. Am. Chem. Soc. 2007;129:10747. doi: 10.1021/ja071642q. [DOI] [PubMed] [Google Scholar]
- 9.Han G, Ghosh P, Rotello VM. Nanomedicine. 2007;2:113. doi: 10.2217/17435889.2.1.113. [DOI] [PubMed] [Google Scholar]
- 10.Xu X, Rosi NL, Wang Y, Huo F, Mirkin CA. J. Am. Chem. Soc. 2006;128:9286. doi: 10.1021/ja061980b. [DOI] [PMC free article] [PubMed] [Google Scholar]
- 11.Kohler N, Sun C, Wang J, Zhang M. Langmuir. 2005;21:8858. doi: 10.1021/la0503451. [DOI] [PubMed] [Google Scholar]
- 12.Bowles SE, Wu W, Kowalewski T, Schalnat MC, Davis RJ, Pemberton JE, Shim I, Korth BD, Pyun J. J. Am. Chem. Soc. 2007;129:8694. doi: 10.1021/ja072757x. [DOI] [PubMed] [Google Scholar]
- 13.Schmid G. Nanoparticles: From Theory to Application. Wiley-VCH Verlag GmbH & Co KGaA; Weinheim, Germany: 2004. [Google Scholar]
- 14.Hellstern D, Schulze K, Schopf B, Petri-Fink A, Steitz B, Kamau S, Hilbe M, Koch-Schneidemann S, Vaughan L, Hottiger M, Hofmann M, Hofmann H, von Rechenberg B. J. Nanosci. Nanotechnol. 2006;6:3261. doi: 10.1166/jnn.2006.482. [DOI] [PubMed] [Google Scholar]
- 15.Briley-Saebo K, Bjornerud A, Grant D, Ahlstrom H, Berg T, Kindberg GM. Cell Tissue Res. 2004;316:315. doi: 10.1007/s00441-004-0884-8. [DOI] [PubMed] [Google Scholar]
- 16.Hyeon T, Lee SS, Park J, Chung Y, Na HB. J. Am. Chem. Soc. 2001;123:12798. doi: 10.1021/ja016812s. [DOI] [PubMed] [Google Scholar]
- 17.Park J, An K, Hwang Y, Park J-G, Noh H-J, Kim J-Y, Park J-H, Hwang N-M, Hyeon T. Nat. Mater. 2004;3:891. doi: 10.1038/nmat1251. [DOI] [PubMed] [Google Scholar]
- 18.Sun S, Zeng H. J. Am. Chem. Soc. 2002;124:8204. doi: 10.1021/ja026501x. [DOI] [PubMed] [Google Scholar]
- 19.Yu WW, Falkner JC, Yavuz CT, Colvin VL. Chem. Commun. 2004:2306. doi: 10.1039/b409601k. [DOI] [PubMed] [Google Scholar]
- 20.Bronstein LM, Huang X, Retrum J, Schmucker A, Pink M, Stein BD, Dragnea B. Chem. Mater. 2007;19:3624. [Google Scholar]
- 21.Peng S, Wang C, Xie J, Sun S. J. Am. Chem. Soc. 2006;128:10676. doi: 10.1021/ja063969h. [DOI] [PubMed] [Google Scholar]
- 22.Binder WH, Weinstabl HC. Monatsh. Chem. 2007;138:315. [Google Scholar]
- 23.Lattuada M, Hatton TA. Langmuir. 2007;23:2158. doi: 10.1021/la062092x. [DOI] [PubMed] [Google Scholar]
- 24.Nitin N, LaConte LEW, Zurkiya O, Hu X, Bao G. J. Biol. Inorg. Chem. 2004;9:706. doi: 10.1007/s00775-004-0560-1. [DOI] [PubMed] [Google Scholar]
- 25.Huang X, Bronstein LM, Retrum JR, Dufort C, Tsvetkova I, Aniagyei S, Stein B, Stucky G, McKenna B, Remmes N, Baxter B, Kao CC, Dragnea B. Nano Lett. 2007;7:2407. doi: 10.1021/nl071083l. [DOI] [PubMed] [Google Scholar]
- 26.Yu WW, Chang E, Sayes CM, Drezek R, Colvin VL. Nanotechnology. 2006;17:4483. [Google Scholar]
- 27.Shtykova EV, Gao X, Huang X, Dyke JC, Schmucker AL, Remmes N, Baxter DV, Stein B, Dragnea B, Konarev PV, Svergun DI, Bronstein LM. J. Phys. Chem. C. 2008;112:16809. doi: 10.1021/jp8053636. [DOI] [PMC free article] [PubMed] [Google Scholar]
- 28.Hu F, Neoh KG, Cen L, Kang E-T. Biomacromolecules. 2006;7:809. doi: 10.1021/bm050870e. [DOI] [PubMed] [Google Scholar]
- 29.Ding S, Xing Y, Radosz M, Shen Y. Macromolecules. 2006;39:6399. [Google Scholar]
- 30.Kim DK, Mikhaylova M, Zhang Y, Muhammed M. Chem. Mater. 2003;15:1617. [Google Scholar]
- 31.Ma M, Zhang Y, Yu W, Shen H-Y, Zhang H-Q, Gu N. Colloids Surf., A. 2003;212:219. [Google Scholar]
- 32.Lesniak C, Schiestel T, Nass R, Schmidt H. Mater. Res. Soc. Symp. Proc. 1997;432:169. [Google Scholar]
- 33.Kohler N, Fryxell GE, Zhang MJ. J. Am. Chem. Soc. 2004;126:7206. doi: 10.1021/ja049195r. [DOI] [PubMed] [Google Scholar]
- 34.Koh I, Wang X, Varughese B, Isaacs L, Ehrman SH, English DS. J. Phys. Chem. B. 2006;110:1553. doi: 10.1021/jp0556310. [DOI] [PubMed] [Google Scholar]
- 35.Liz-Marzan LM. In: Nanoscale Materials. Liz-Marzan LM, Kamat PV, editors. Kluwer Academic Publishers; Norwell, Massachusetts: 2003. p. 227. [Google Scholar]
- 36.Schroedter A, Weller H. Angew. Chem., Int. Ed. 2002;41:3218. doi: 10.1002/1521-3773(20020902)41:17<3218::AID-ANIE3218>3.0.CO;2-P. [DOI] [PubMed] [Google Scholar]
- 37.Bruchez M, Jr, Moronne M, Gin P, Weiss S, Alivisatos AP. Science. 1998;281:2013. doi: 10.1126/science.281.5385.2013. [DOI] [PubMed] [Google Scholar]
- 38.De Palma R, Peeters S, Van Bael MJ, Van den Rul H, Bonroy K, Laureyn W, Mullens J, Borghs G, Maes G. Chem. Mater. 2007;19:1821. [Google Scholar]
- 39.Jana NR, Earhart C, Ying JY. Chem. Mater. 2007;19:5074. [Google Scholar]
- 40.Hyeon T, Lee SS, Park J, Chung Y, Na HB. J. Am. Chem. Soc. 2001;123:12798. doi: 10.1021/ja016812s. [DOI] [PubMed] [Google Scholar]
- 41.Park J, Kang E, Bae CJ, Park J-G, Noh H-J, Kim J-Y, Park J-H, Park HM, Hyeon T. J. Phys. Chem. B. 2004;108:13594. [Google Scholar]
- 42.Hyeon T, Lee SS, Park J, Chung Y, Bin Na H. J. Am. Chem. Soc. 2001;123:12798–12801. doi: 10.1021/ja016812s. [DOI] [PubMed] [Google Scholar]
- 43.Dutta P, Manivannan A, Seehra MS, Shah N, Huffman GP. J. Appl. Phys. 2006;99 08H105/1. [Google Scholar]
- 44.Cullity BD. Elements of X-Ray Diffraction. Agune Gijutsu Center Co.; Reading, Massachusetts: 1980. [Google Scholar]
- 45.Bruce IJ, Taylor J, Todd M, Davies MJ, Borioni E, Sangregorio C, Sen T. J. Magn. Magn. Mater. 2004;284:145. [Google Scholar]
- 46.Wang L, Bao J, Wang L, Zhang F, Li Y. Chemistry. 2006;12:6341. doi: 10.1002/chem.200501334. [DOI] [PubMed] [Google Scholar]
- 47.Ishikawa T, Cai WY, Kandori K. J. Chem. Soc., Faraday Trans. 1992;88:1173. [Google Scholar]
- 48.Ishikawa T, Minamigawa M, Kandori K, Nakayama T, Tsubota T. J. Electrochem. Soc. 2004;151:B512. [Google Scholar]
- 49.Thurm S, Odenbach S. Phys. Fluids. 2003;15:1658. [Google Scholar]
- 50.Aoshima M, Satoh A. J. Colloid Interface Sci. 2005;288:475. doi: 10.1016/j.jcis.2005.02.093. [DOI] [PubMed] [Google Scholar]
- 51.Yuan W, van Oou WJ. J. Colloid Interface Sci. 1997;185:197. doi: 10.1006/jcis.1996.4604. [DOI] [PubMed] [Google Scholar]
- 52.Bellamy LJ. The Infra-red Spectra of Complex Molecules. Chapman and Hall; London: 1975. [Google Scholar]
- 53.Remes Z, Kromka A, Vanecek M, Grinevich A, Hartmannova H, Kmoch S. Diamond Relat. Mater. 2007;16:671. [Google Scholar]
- 54.Yang L, Zhang F, Endo T, Hirotsu T. Macromolecules. 2003;36:4709. [Google Scholar]
- 55.Pellegrino T, Manna L, Kudera S, Liedl T, Koktysh D, Rogach AL, Keller S, Raedler J, Natile G, Parak WJ. Nano Lett. 2004;4:703. [Google Scholar]
Associated Data
This section collects any data citations, data availability statements, or supplementary materials included in this article.