

Abstract
Threshold vs. intensity (tvi) functions were measured under conditions in which the slope of the rising branch approximated the deVries–Rose law in order to evaluate the contribution of intrinsic visual noise (dark light, Eigengrau) to age-related elevations in threshold under photopic conditions. Data were obtained from 48 observers (20–88 years) using a temporal 2AFC procedure. The stimulus was centered at 8° nasal retinal eccentricity and consisted of a 560 nm, 14.4′ test flash (10 ms) concentric with a steady 500 nm (12.9°) adapting field (13 intensity levels ranging from 0–9 log quanta · sec−1 · deg−2), which resulted in clear scotopic and photopic branches. Photopic thresholds increased linearly with age at a rate of 0.08 log unit per decade at the cornea. The mean slope of the rising portion of the tvi functions (in log–log coordinates) was 0.62, and not correlated with age. Dark light values increased with age, but not significantly. Dark light was a statistically significant predictor of individual differences in absolute photopic threshold, but it is not responsible for age-related increases in threshold under photopic conditions.
Keywords: aging, cone sensitivity, photopic sensitivity, thresholds, noise, dark light, increment thresholds, individual differences
INTRODUCTION
Age-related elevations in thresholds have been demonstrated under both scotopic and photopic conditions.1 When thresholds are referred to the retina by correcting for the effect of age-related reductions in pupil diameter and transmission of the ocular media, a substantial neural change remains to be explained. Modeling of threshold vs. intensity (tvi) functions indicates that the neural processes underlying age-related sensitivity losses are early in retinal processing, at least for an S-cone pathway.2 This argument is derived from the observation that age-related losses are greatest along the plateau of the tvi function, or absolute threshold, but with increasing background intensity the tvi functions of younger and older observers converge. In a simple model of visual detection as an ideal photon counter,3–6 these results would be expected from either of two possible age-related signal degradations, quantal efficiency or dark light. Dark light is defined as “the intensity of background which, because of the inevitable fluctuations in the number of absorbed quanta, would have the same effect on the increment threshold as the intrinsic retinal noise itself.”5p.475 Operationally, dark light is the intensity of the background where the plateau and rising portion of the tvi function intersect.
The contributions of quantal efficiency and dark light to age-related changes in the tvi function can be modeled using the following equation:
| (1) |
where A is the Weber fraction, x is the field intensity, D is the dark light (Eigengrau), and p is the proportion of unbleached photopigment.7 When n = 1.0, reductions in photopigment (or mathematically equivalent degradations of quantal efficiency) and increases in dark light appear in the equation in a ratio so that the effects of changes (with age) in either cannot be distinguished in the shape of the tvi curve. Under conditions that are limited by statistical fluctuations in the number of quanta absorbed (following the deVries–Rose law; n = 0.5),3,4 however, decreases in quantal efficiency, and increases in dark light do not produce equivalent shifts in the tvi function. In particular, photopigment depletion shifts the tvi function such that there is no convergence of the rising portions of the curves.
The purpose of this study was to measure tvi functions under conditions in which the slope is < 1.0 in order to assess the possible contribution of dark light to age-related elevations in photopic thresholds. Barlow5 has shown that conditions likely to generate a tvi function conforming to the deVries–Rose law are obtained with test stimuli of small area and short duration detected on backgrounds of moderately low intensity. The tvi functions obtained under such conditions differed for younger and older observers primarily by vertical translation along the threshold axis and, thus, imply that age-related changes in dark light are not responsible for age-related changes in photopic increment thresholds.
METHODS
Subjects
Forty eight subjects (23 male, 25 female), 20–88 years of age, participated in this study. They were normal trichromats according to the Panel D-15 test, Neitz anomaloscope, and HRR pseudo-isochromatic plates. Undilated direct ophthalmoscopy by a licensed clinician was performed to rule out the presence of retinal disease or abnormal ocular media. All subjects had a corrected visual acuity of 20/30 or better.
Stimulus and Apparatus
The stimulus was presented at 8° in the nasal retina of one eye using a Maxwellian-view optical system. The test stimulus consisted of a 560 nm, 14.4′ diameter spot, presented as a 10-ms flash concentric with a 500 nm, 12.9° steady adapting field (0–9 log quanta · sec−1 · deg−2, 13 intensity steps). A small (21′) 640 nm spot served as the fixation point. Apparatus and calibration details are described elsewhere.8
PROCEDURES
Following 30 min dark adaptation, subjects adapted to the lowest intensity background (0 log quanta · sec−1 · deg−2) for 2 min. Thresholds were determined using a temporal 2AFC procedure (3-down, 1-up staircase). The subject’s task was to press a button to indicate whether the test flash was presented in the first or second of two intervals (separated by 3.5 s) that were signaled by tones. The staircase step size was 0.3 log unit initially, followed by a step size of 0.1 log unit after the second reversal. Threshold was based on the geometric mean of the last four of six reversals, corresponding to 0.79 probability of detection, or d′ = 1.12. After determining a threshold, the background was increased and the subject adapted to it for 2 min before repeating the procedure.
RESULTS
Figure 1 presents results from a younger and older subject. In each panel, log threshold (quanta · sec−1 · deg−2) is plotted as a function of log background intensity (quanta · sec−1 · deg−2). In this and subsequent figures, values are specified in terms of light delivered to the cornea. For each subject, two distinct branches or tvi functions were observed. The test sensitivity functions for a 27-year-old subject obtained on the lower plateau agreed well with the CIE V′(λ) function, while the test sensitivity obtained on the upper plateau agreed well with the 10° V(λ) function.9 For this reason, the plateaus of the lower and upper branches are taken to represent absolute thresholds of scotopic and photopic mechanisms, respectively.
FIG. 1.

Tvi functions of two observers covering the approximate age range of the sample. In each panel, log threshold (quanta · sec−1 · deg−2) is plotted as a function of log background (quanta · sec−1 · deg−2). Lines were fitted by procedures described in the text. Horizontal arrows show absolute thresholds for a photopic mechanism; vertical arrows denote the dark light values. Dashed lines (upper panel) illustrate slopes of 1.0 (Weber’s law) and 0.5 (deVries–Rose law).
Each subject’s data were fitted simultaneously by four straight lines using a Marquardt least-squares algorithm in KaleidaGraph v.3.08d. Two lines were constrained to a slope of zero, and two lines were unconstrained in their slope. The horizontal lines define the plateaus of the tvi functions, the scotopic and photopic absolute thresholds. Goodness of fit was evaluated by R2 (mean = 0.98, sd = 0.025). For reference, R2 for the functions fitted to the observers in Fig. 1 was 0.99. Due to space limitations, we present only the analyses of the photopic data.
As noted in the introduction, to evaluate our hypotheses regarding factors contributing to age-related elevations in threshold, it is necessary to measure the tvi functions under conditions in which the rising portion has slope < 1.0, preferably following the deVries–Rose law (slope = 0.5), but this occurs only over a narrow range of background intensities before approaching Weber’s law (slope = 1.0). The mean number of data points used to determine the slopes was 3.8 (range = 2–7). Dashed lines in the upper panel of Fig. 1 illustrate the slopes according to deVries–Rose and Weber laws for comparison with the data. The mean slope for the photopic branch of our 48 observers was 0.62 (sd = 0.17). There was no statistically significant relation between the slope of the photopic tvi branches and observer age (r = 0.02, p > 0.900).
Dark Light and Age-Related Changes in Photopic Absolute Threshold
As expected from previous work, there was an increase in photopic thresholds with increasing age. This is shown by the upper panel in Fig. 2 with the least-squares linear regression line, which was statistically significant (r = 0.57; F1,45 = 21.826, p > 0.0001).† The change with age was 0.08 log unit per decade, specified at the cornea.
FIG. 2.

Absolute thresholds (log quanta · sec−1 · deg−2) obtained from the photopic plateaus of the tvi functions are plotted as a function of age in the upper panel. The least-squares regression line is: Threshold (quanta) = 0.008A + 7.684, where A is age in years. Photopic dark light (log quanta · sec−1 · deg−2) is plotted as a function of age in the lower panel.
Following Barlow,5 dark light was calculated as the intensity of the background stimulus, where the plateau and the rising portion intersect, as illustrated by the vertical arrows in Fig. 1. These values were determined objectively using parameters obtained from the fitted functions. The lower panel of Fig. 2 shows photopic dark light (log quanta · sec−1 · deg−2) of each observer plotted as a function of age. The slope of the regression equation was positive, but not statistically significant (r = 0.19, p = 0.219) so the regression line is not presented in the figure. The mean dark light value for the photopic branch was 7.05 log quanta · sec−1 · deg−2 (sd = 0.50), consistent with Stiles’s dark light values of 6.49 and 6.56 log quanta · sec−1 · deg−2 for π4 and π5 mechanisms, respectively.10
Dark Light and Individual Differences in Absolute Threshold
It is generally accepted that absolute threshold depends upon intrinsic visual noise and quantal efficiency. Barlow5 has noted a large range of individual variation in scotopic dark light values. Yet, the relative contribution of dark light and quantal efficiency to variation in absolute threshold seems not to have been explored from an individual differences perspective. The results of this study show a significant positive relation between photopic threshold and dark light (r = 0.47; F1,45 = 11.739, p = 0.001).
It might have been expected, as illustrated by Fig. 3, that age-related changes in dark light contribute, in part, to age-related changes in threshold. The link between dark light and age is not significant, so this hypothesis is not supported by the data. Figure 3 shows, however, that age and dark light are each independently related to individual variation in thresholds. The standardized regression coefficients (β) indicate that age is a significant predictor of threshold when controlling for dark light (β = 0.47; F2,40 = 15.343; p = 0.0003) and dark light is a significant predictor when controlling for age (β = 0.38; F2,40 = 9.897; p = 0.003). There was no significant interaction between age and dark light (p = 0.854). Thus, higher dark light values are associated with higher thresholds, but age-related increases in visual threshold are not explained by age-related changes in dark light.
FIG. 3.

Schematic to show that age and dark light are both significant independent predictors of photopic threshold (* denotes statistically significant relations), but the path between age and dark light is not significant.
DISCUSSION
Detection thresholds under the conditions of this experiment were close to those that are limited by statistical fluctuations in quantum absorption (deVries–Rose law), thereby permitting the influences of dark light and quantal efficiency to senescent elevations in photopic thresholds to be separated. Dark light values and slopes of the tvi functions did not change significantly with age, but the absolute thresholds increased. Thus, the tvi functions of young and old differ primarily by a vertical translation for these conditions of testing. This pattern of results is illustrated in Fig. 4 for theoretical tvi functions generated using Eq. (1) and mean parameter values from the seven youngest and seven oldest observers tested. For the older group, dark light values are 0.17 log unit higher, while the plateau is 0.64 log unit higher, than in the younger group.
FIG. 4.
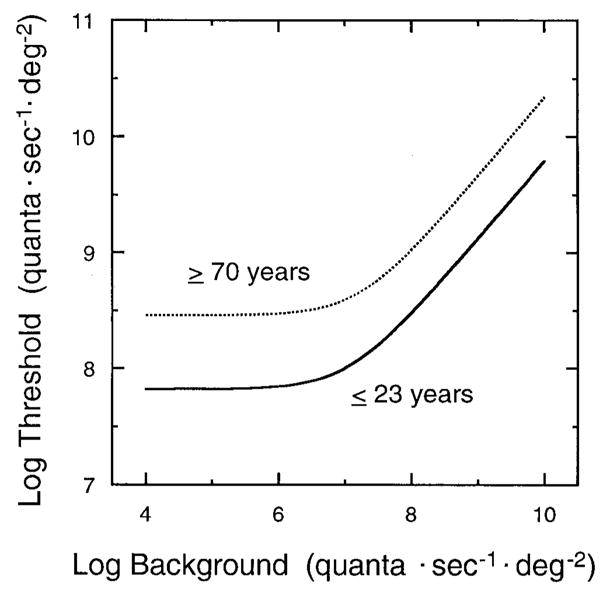
Modeled tvi functions are shown based on Eq. (1) and mean parameters obtained from fits to the data of the seven youngest (≤ 23 years) and seven oldest (≥ 70 years) observers. Threshold log quanta · sec−1 · deg−2 is plotted as a function of background log quanta · sec−1 · deg−2. Tvi functions were generated using mean values of the plateaus (7.82, 8.46), dark light (7.06, 7.23) and slope (0.64, 0.65) for younger and older observers, respectively.
The magnitude of the age-related elevations in threshold obtained under these conditions are similar to those obtained at 0–8° in the temporal retina for conditions of isolation of M- and L-cone mechanisms on the plateau of their tvi functions.8 In the central retina, reflection densitometry measurements11–13 and psychophysical data14 indicate that the amount of bleachable photopigment decreases with age. Indeed, some of these studies show losses in photopigment density that are linear with age,11,14 as with the threshold elevations presented here. However, the magnitude of the age-related loss in photopigment density is much lower than required to account for the age-related elevation in the plateau of the photopic tvi function. The physiological basis for mathematically equivalent photodegradations to explain the remaining age-correlated loss is still to be found. The photoreceptors themselves do not appear to decline significantly in number at the retinal location of our measurements,15 but they may undergo age-related distortions of their outer segments.16 Approximately one-third of the ganglion cells mediating response to the test stimuli are lost over the age-range of our sample,17 but their relation to sensitivity is not at all clear. Finally, in addition to quantal efficiency, other age-related degradations not tested in this study may exist such as additive and multiplicative internal noise,18 central inefficiency,19 or intrinsic uncertainty.20 However, several studies have examined senescence of internal noise and have generally21–22, cf 23 not found significant changes.
In conclusion, the results of this study indicate that age-related changes in photopic thresholds are not ascribable to an increase in one type of additive noise, dark light, but are attributable, at least in part, to reductions in quantal efficiency, most likely several different factors influencing the ability of the photoreceptors to capture quanta.
Acknowledgments
This research was supported by the National Institute on Aging (grant AG04058) and a Research to Prevent Blindness Jules and Doris Stein Professorship. We thank James M. Kraft for drawing the implications of Eq. (1) to our attention and to Patrick Bennett, Theodore E. Cohn, Adam Reeves, and Brooke E. Schefrin for useful discussions and comments.
Footnotes
One point was omitted from each panel of Fig. 2, because it was an outlier. Statistical inferences do not depend on whether this point is included.
References
- 1.Domey RG, McFarland RA, Chadwick E. Dark adaptation as a function of age and time: II. A derivation J Gerontol. 1960;15:267–279. doi: 10.1093/geronj/15.3.267. [DOI] [PubMed] [Google Scholar]
- 2.Schefrin BE, Werner JS, Plach M, Utlaut N, Switkes E. Sites of age-related sensitivity loss in a short-wave cone pathway. J Opt Soc Am A. 1992;9:355–363. doi: 10.1364/josaa.9.000355. [DOI] [PubMed] [Google Scholar]
- 3.deVries H. The quantum character of light and its bearing upon threshold of vision, the differential sensitivity and visual acuity of the eye. Physica. 1943;10:553–564. [Google Scholar]
- 4.Rose A. The sensitivity performance of the human eye on an absolute scale. J Opt Soc Am. 1948;38:196–208. doi: 10.1364/josa.38.000196. [DOI] [PubMed] [Google Scholar]
- 5.Barlow HB. Increment thresholds at low intensities considered as signal/noise discriminations. J Physiol. 1957;136:469–488. doi: 10.1113/jphysiol.1957.sp005774. [DOI] [PMC free article] [PubMed] [Google Scholar]
- 6.Cohn T. Quantum fluctuation limit in foveal vision. Vision Res. 1976;16:573–579. doi: 10.1016/0042-6989(76)90002-x. [DOI] [PubMed] [Google Scholar]
- 7.Reeves A, Wu S, Schirillo J. The effect of photon noise on the detection of white flashes. Vision Res. 1998;38:691–703. doi: 10.1016/s0042-6989(97)00201-0. [DOI] [PubMed] [Google Scholar]
- 8.Werner JS, Bieber ML, Schefrin BE. Senescence of foveal and parafoveal cone sensitivities and their relations to macular pigment density. J Opt Soc Am. doi: 10.1364/josaa.17.001918. in press. [DOI] [PMC free article] [PubMed] [Google Scholar]
- 9.Wyszecki G, Stiles WS. Color science: Concepts and methods, quantitative data and formulae. 2. New York: Wiley; 1982. [Google Scholar]
- 10.Barlow HB. Visual problems of colour. II. London: Her Majesty’s Stationary Office; 1958. Intrinsic noise of cones; pp. 617–630. [Google Scholar]
- 11.Kilbride PE, Hutman LP, Fishman M, Read JS. Foveal cone pigment density difference in the aging eye. Vision Res. 1986;26:321–325. doi: 10.1016/0042-6989(86)90029-5. [DOI] [PubMed] [Google Scholar]
- 12.Keunen JEE, van Norren D, van Meel GJ. Density of foveal cone pigments at older age. Invest Ophthal Vis Sci. 1987;28:985–991. [PubMed] [Google Scholar]
- 13.Elsner AE, Burns SA, Beausencourt E, Weiter JJ. Foveal cone photopigment distribution: Small alterations associated with macular pigment distribution. Invest Ophthal Vis Sci. 1998;39:2394–2404. [PubMed] [Google Scholar]
- 14.Swanson WH, Fish GE. Age-related changes in the color-match-area effect. Vision Res. 1996;36:2079–2085. doi: 10.1016/0042-6989(95)00280-4. [DOI] [PubMed] [Google Scholar]
- 15.Curcio CA, Millican CL, Allen KA, Kalina RE. Aging of the human photoreceptor mosaic: Evidence for selective vulnerability of rods in central retina. Invest Ophthal Vis Sci. 1993;34:3278–3296. [PubMed] [Google Scholar]
- 16.Marshall J. Ageing changes in human cones. In: Shimuzu K, Oosterhuis JA, editors. XXIII Concilium ophthmologicum, Kyoto. Amsterdam: Elsevier; 1978. pp. 375–378. [Google Scholar]
- 17.Curcio CA, Drucker DN. Retinal ganglion cells in Alzheimer’s disease and aging. Ann Neurol. 1993;33:248–257. doi: 10.1002/ana.410330305. [DOI] [PubMed] [Google Scholar]
- 18.Lillywhite PG. Multiplicative intrinsic noise and the limits to visual performance. Vision Res. 1981;21:291–296. doi: 10.1016/0042-6989(81)90123-1. [DOI] [PubMed] [Google Scholar]
- 19.van Meeteren A, Barlow HB. The statistical efficiency for detecting sinusoidal modulation of average dot density in random figures. Vision Res. 1981;21:765–777. doi: 10.1016/0042-6989(81)90174-7. [DOI] [PubMed] [Google Scholar]
- 20.Pelli DG. Uncertainty explains many aspects of visual contrast detection and discrimination. J Opt Soc Am A. 1985;2:1508–1531. doi: 10.1364/josaa.2.001508. [DOI] [PubMed] [Google Scholar]
- 21.Pardhan S, Gilchrist J, Elliott DB, Beh GK. A comparison of sampling efficiency and internal noise level in young and old subjects. Vision Res. 1996;36:1641–1648. doi: 10.1016/0042-6989(95)00214-6. [DOI] [PubMed] [Google Scholar]
- 22.Bennett PJ, Sekuler AB, Ozin L. Effect of aging on calculation efficiency and equivalent noise. J Opt Soc Am A. 1999;16:654–668. doi: 10.1364/josaa.16.000654. [DOI] [PubMed] [Google Scholar]
- 23.Cremer R, Zeef EJ. What kind of noise increases with age? J Gerontol. 1987;42:515–518. doi: 10.1093/geronj/42.5.515. [DOI] [PubMed] [Google Scholar]