Abstract
When modulators of neuromuscular function alter the motor neuron spike patterns that elicit muscle contractions, it is predicted that they will also retune correspondingly the connecting processes of the neuromuscular transform. Here we confirm this prediction by analyzing data from the cardiac neuromuscular system of the blue crab. We apply a method that decodes the contraction response to the spike pattern in terms of three elementary building-block functions that completely characterize the neuromuscular transform. This method allows us to dissociate modulator-induced changes in the neuromuscular transform from changes in the spike pattern in the normally operating, essentially unperturbed neuromuscular system.
Keywords: spike train, stimulus-response decoding, reconstruction, neuromuscular system, neuromodulation
Question
Neuromodulators regulate many neurophysiological processes. These processes are often modeled as input-output relationships. Here we consider, for example, the neuromuscular transform [1]: in a neuromuscular system, the transformation of the pattern of motor neuron spikes to the waveform of muscle contractions that the spikes elicit (Fig. 1). Consider a modulator that, to meet some physiological demand, must alter the output contractions in a particular way. How can the modulator accomplish this? Experimentally, it is observed that it generally alters the input spike pattern. Yet both theory and experiment strongly suggest that this alone will often be insufficient. This is because the neuromuscular transform acts as a constraining channel whose properties are tuned, at any particular time, only to a narrow range of input patterns. When the input pattern is modulated outside this range, the output contractions will not be able to follow [3]. To allow them to follow, the properties of the neuromuscular transform must be retuned correspondingly [2]. We predict, therefore, that physiological modulators of neuromuscular function, and of other comparable input-output processes, will act simultaneously at two sites, altering in a complementary way both the input and the input-output relationship (Fig. 1).
Fig. 1.
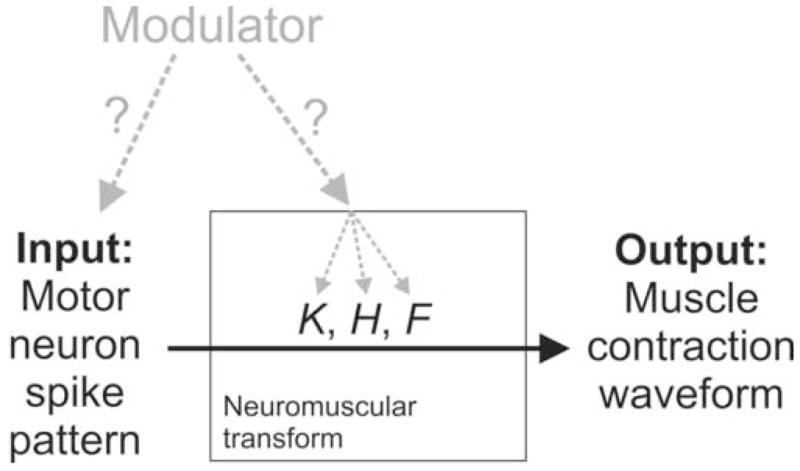
The question. K, H, and F are the functions that characterize the neuromuscular transform in our analysis.
How can we test this prediction with the natural spike patterns in the normally functioning, minimally perturbed neuromuscular system? Here we apply an analytical method developed by Stern et al. [11] that “decodes” [cf. 9, 10] the contraction response to the motor neuron spike pattern in terms of three elementary building-block functions that completely characterize the neuromuscular transform, in the unmodulated and modulated system.
Data
To illustrate our approach and results, we work in this paper through the details of just one representative example, using data from a single experiment performed in the cardiac neuromuscular system of the blue crab Callinectes sapidus [5, 7]. The data are shown in Fig. 2. The crab heartbeat is neurogenic, driven by the endogenous rhythmic activity of a simple central pattern generator, the cardiac ganglion, embedded within the heart itself. In each cycle, the cardiac ganglion generates a burst of motor neuron spikes (Fig. 2A, bottom) that produces a contraction of the heart muscle (top). The system is endogenously modulated by numerous modulators. In Fig. 2 we exogenously applied one of these, crustacean cardioactive peptide (CCAP) [5, 6], by superfusing it over the entire system, the cardiac ganglion as well as the heart muscle. Expanded excerpts from the records in Fig. 2A before and during the modulation by CCAP can be compared in B and C. Clearly, CCAP dramatically altered the motor neuron spike pattern—most obviously, it greatly increased the frequency of the bursts, accelerating the heart rhythm—as well as the size and shape of the contractions. We now ask, were the changes in the contraction waveform due simply to the changes in the spike pattern, or did they, as we predict, also require changes in the neuromuscular transform?
Fig. 2.
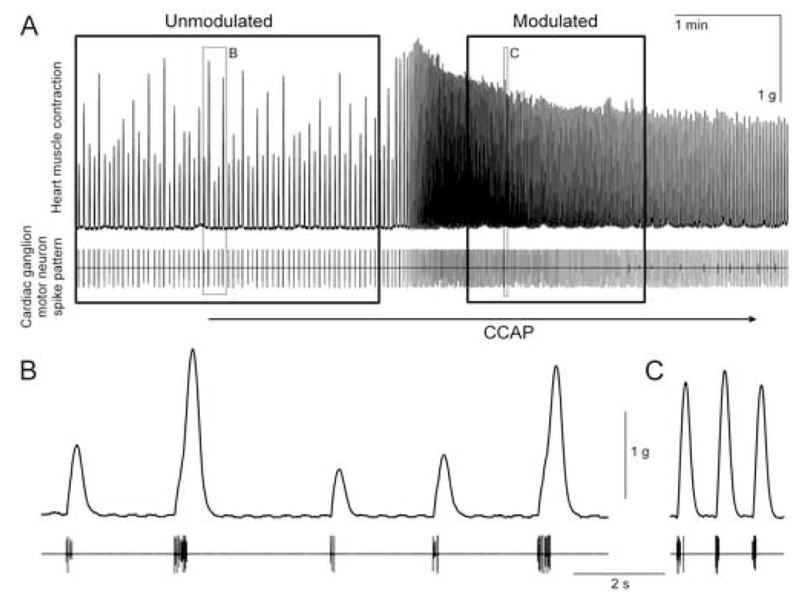
The data, from a representative semi-intact working heart preparation [6, 7] of Callinectes. A, top: heart muscle tension. A, bottom: cardiac ganglion motor neuron spike pattern, recorded extracellularly in a connective leading from the ganglion to the muscle. 10−6 M CCAP was superfused; the lag before the response reflects the dead volume of the perfusion system. B and C expand the unmodulated and modulated excerpts in the small boxes in A. The large boxes in A indicate the unmodulated (175 s of data, with 466 spikes) and modulated (100 s of data, with 740 spikes) portions of data that were used to decode, respectively, the unmodulated and modulated functions K, H, and F in Fig. 3.
Method
Briefly, the method [11] assumes that the contraction response to the spike pattern is produced by the operation of three invariant elementary functions, K, H, and F. Once we have identified these, we will be able to predict the response to any arbitrary spike pattern, and so will have achieved a complete spike-level characterization of the neuromuscular transform. With the times of the spikes in an experimentally observed pattern as input, we use a least-squares minimization to construct an estimated response, Rest, that best approximates the observed response, Rexp. We assume that
| (1) |
where tti = spike times, i = 1, 2, …, n
K = single spike response or kernel
Ai = factor scaling the amplitude of K at each spike time
We further assume that Ai = A(ti), where
| (2) |
where H = function describing dependence on previous spikes
F = nonlinear “dose-response” curve
A least-squares minimization is then implemented for . This expression is converted into a continuous (integral) expression to take advantage of analytical techniques in mathematics. Calculus of variations is then used to find the minimum. In the case of equation (1), the resulting expressions that must be solved numerically are nonlinear in K and A, but are solved as two separate linear equations, in terms of K and A respectively. The two equations are solved in alternation, iteratively until a desired level of error tolerance is achieved. This method is repeated to find H and F, as in equation (2). An important feature of the method is that K, H, and F are not assumed to be of any particular analytic form (e.g., exponential). Instead, each function value is treated as an independent degree of freedom, to be determined by the algorithm. The initial guesses for the functions are constants, and the form of these functions emerges as the computation runs.
Since each function value is treated as an independent “parameter” of the fit, a possible concern is that, if the number of data points of Rexp to be fit were to be almost equaled by the number of parameters available to fit them, the method might “overfit” the data, that is, find a solution tailored too specifically to that particular Rexp. The method in fact uses matrices that combine all of the corresponding data points, for example at each time following each spike, from the entire given dataset. The question is then simply, what is the ratio of the number of data points to the number of parameters in a typical fit? Consider equation (1). Here the number of parameters is n + k, where k is the number of function values of K and n is the number of spikes, each of which is associated with one amplitude factor A. The number of data points, on the other hand, is nk, if all the spikes are so far apart that their responses nowhere overlap (in this case the algorithm simply finds the ensemble average of the responses), and smaller than nk with overlap. With no overlap, there are thus nk/(n + k) data points per parameter. The ratio increases with n and k, but decreases with overlap. Typically n and k are quite large, and there is only moderate overlap. The ratio is thus sufficiently large. In the two portions of the data in Fig. 2 decoded below, for example, n = 466 and 740, k = 100, and, with the overlap present in the data, the ratio was computed to be ~13 and ~12 data points per parameter.
Overfitting can also be eliminated as a concern if the fit can explain new data, as our fits here do (see below).
Results
Fig. 3 shows the functions K, H, and F decoded by the method from the unmodulated (open circles) and modulated (filled circles) portions of the experiment in Fig. 2. Clearly, the unmodulated and modulated functions differ: the neuromuscular transform was indeed changed by the modulator. Some of the differences have reasonably intuitive interpretations. For example, as the modulator accelerated the heartbeat by increasing the frequency of the motor neuron spike bursts, the function K—the contraction shape elicited by each spike (Fig. 3A)—became faster at the same time.
Fig. 3.
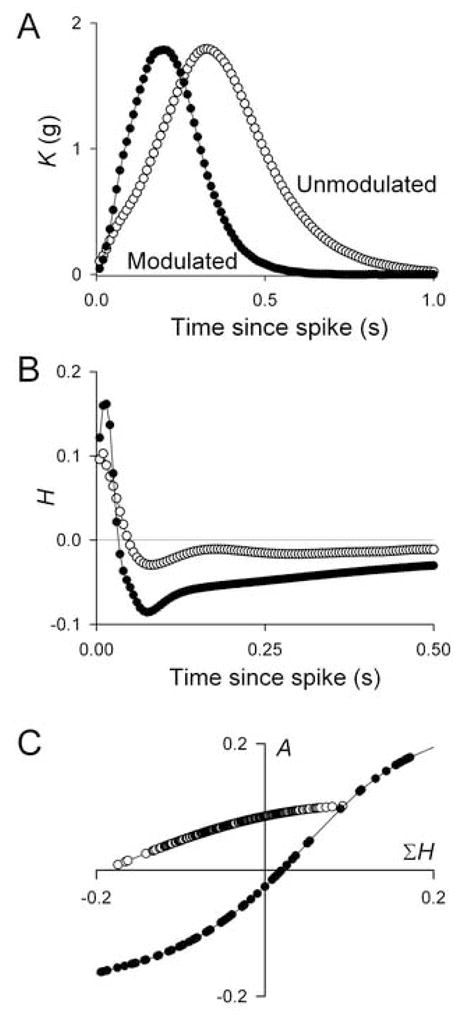
The unmodulated (open circles) and modulated (filled circles) functions K, H, and F decoded from the portions of data within the large boxes in Fig. 2A.
It is, however, the entire set of the three functions K, H, and F, interacting with each other and with the spike pattern, that determines the contraction waveform. The full shape of the contraction waveform is therefore difficult to predict intuitively. But, knowing the spike pattern and the functions K, H, and F, which in our analysis are all the components of the system, it should be possible to reconstruct it. We demonstrate this in Fig. 4. If the decoding method is valid, for example, the unmodulated spike pattern (e.g., that in row 1 in Fig. 4A), passed through the neuromuscular transform composed of the unmodulated functions K, H, and F, should reproduce the unmodulated contraction waveform that was really observed. Indeed, this is the case: compare rows 2 and 3 in Fig. 4A. Similarly, the modulated spike pattern (e.g., that in row 1 in Fig. 4B), passed through the modulated functions K, H, and F, should reproduce the modulated contraction waveform. This, too, is the case: compare rows 2 and 4 in Fig. 4B.
Fig. 4.
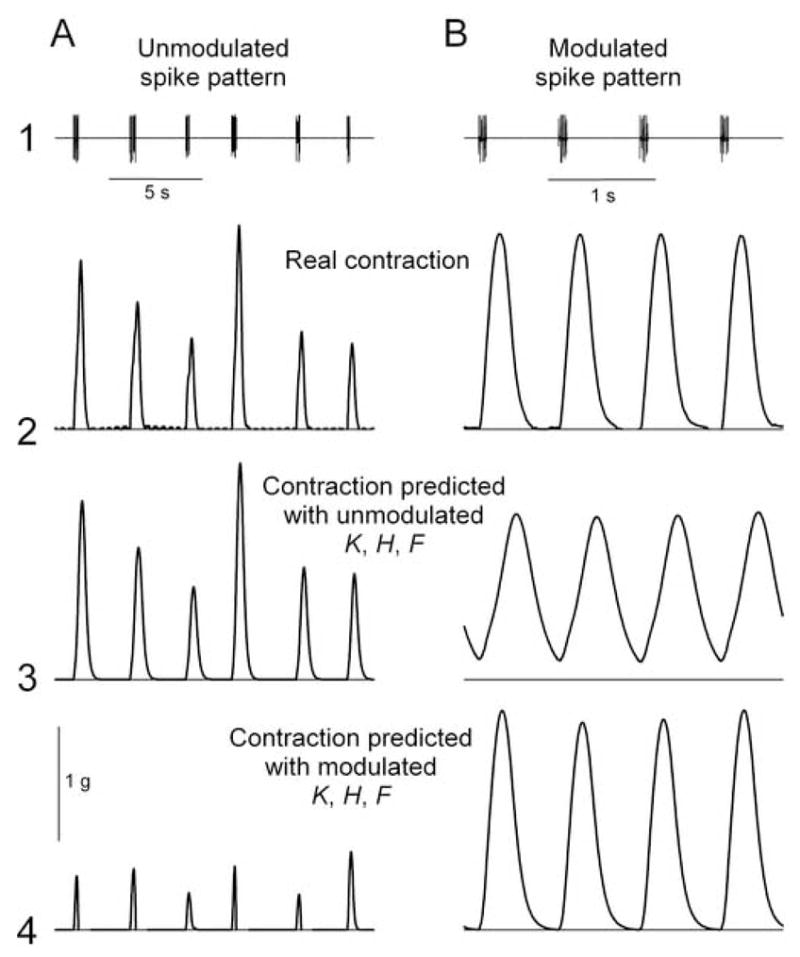
Representative contraction waveforms reconstructed by passing the unmodulated (A) and modulated (B) spike patterns shown in row 1 (taken from Fig. 2) through the unmodulated (row 3) and modulated (row 4) functions K, H, and F. The contraction waveforms that were really observed are shown in row 2. Note different time scales in A and B.
What happens, now, when we pass the unmodulated spike pattern through the modulated transform, or, conversely, the modulated pattern through the unmodulated transform? In both cases, the predicted contractions are very unlike the real contractions, with shapes that probably would be inefficient or completely unsuccessful in pumping blood. In the first case (row 4 of Fig. 4A), the contractions are predicted to be abnormally fast, brief, and small. In the second case (row 3 of Fig. 4B), the contractions are, conversely, too slow for the accelerated heart rhythm and so can never relax completely, instead of the fast, large, yet fully relaxing contractions that were actually produced by the modulator.
We performed a reconstruction like that in Fig. 4 for the entire dataset in Fig. 2, quantifying the similarity between the real and the reconstructed contraction waveforms by computing the root mean square (RMS) error between them. Fig. 5A shows the RMS error for each successive 5 s-long segment of the data in Fig. 2A when the spike pattern was passed through the neuromuscular transform composed of either the unmodulated (open points) or the modulated (filled points) functions K, H, and F. At the beginning of the experiment, when the spike pattern was itself unmodulated, it produced relatively low error—that is, relatively realistic contraction shapes, as in Fig. 4—when passed through the unmodulated transform but much higher error when passed through the modulated transform. Later in the experiment, when the spike pattern became modulated, the converse was true. Thus, realistic contraction shapes were produced only when the spike pattern and the neuromuscular transform were both in the same modulatory state. The differences in RMS error between different modulatory states either of the spike pattern or of the transform were statistically highly significant (Fig. 5B).
Fig. 5.
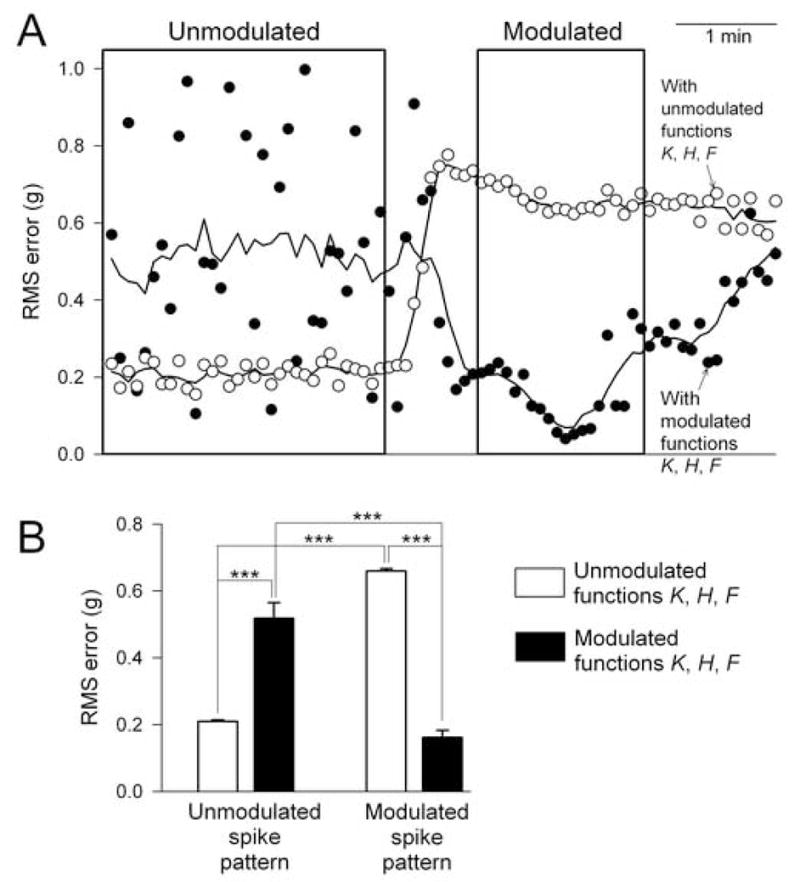
Statistics of the reconstruction of the entire dataset. A: root mean square (RMS) error between the real contraction waveform Rexp and the reconstructed contraction waveform Rest when a reconstruction like that in Fig. 4 was performed for each successive 5 s-long segment of the data in Fig. 2A with either the unmodulated (open points) or the modulated (filled points) functions K, H, and F. The continuous curves are simply smoothed curves through the points to show their average trend. The boxes are reproduced from Fig. 2A to indicate the portions of the data from which the unmodulated and modulated functions K, H, and F were decoded. B: means ± SE of the RMS errors from A, comparing four conditions: unmodulated spike pattern segments reconstructed with the unmodulated functions K, H, and F (bar 1) and with the modulated functions (bar 2), and modulated spike pattern segments reconstructed with the unmodulated functions (bar 3) and with the modulated functions (bar 4). Specifically, the points included in the appropriate bars of B were all those lying within the boxes in A. Statistical significance was tested with ANOVA on ranks followed by pairwise multiple comparisons using the Holm-Sidak method; “***” indicates p < 0.001.
With regard to our decoding method, too, Fig. 5 makes an important point. The decoded functions K, H, and F are able to reconstruct not just selected data, as in Fig. 4, but every segment of the dataset recorded under the same conditions—all of the segments lying within the boxes in Fig. 5A from which the functions K, H, and F were decoded in the first place, but also, without obviously worse error, also segments extending beyond the boxes. The functions K, H, and F thus characterize the neuromuscular transform, as required, in a sufficiently general manner to be able to predict contraction responses to new spike patterns.
Conclusion
To change the contraction waveform, CCAP appears to have acted, as predicted, by changing simultaneously both the input motor neuron spike pattern and the properties of the input-output relationship, the neuromuscular transform. Both changes were required: either one without the other would not have succeeded.
As in other neuromuscular systems [2], the change in the neuromuscular transform is very likely brought about by peripheral action of CCAP on the heart muscle to change its response to the motor neuron spike pattern. In vivo, CCAP is released from projections of neurosecretory CNS neurons that terminate in the pericardial organs, neurohemal structures adjacent to the heart [5, 6]. Thus, CCAP is released as a neurohormone that (as in our experiment here) has access both to the cardiac ganglion and the heart muscle. Anatomically, it is therefore quite capable of exerting multiple actions throughout the cardiac system. Indeed, in recent experiments [6] we have discerned at least three primary actions of CCAP in the system, two probably on the cardiac ganglion and one on the heart muscle that, as our analysis here predicts, changes the contraction response even to the same spike pattern. The mechanism of this peripheral action may include modification of the transmission at the cardiac neuromuscular junctions or of the contractility of the heart muscle itself. There is extensive precedent for both mechanisms in invertebrate, as well as vertebrate, neuromuscular systems [2, 4, 12].
Our analytical method was able to dissociate the two actions of CCAP from each other in the normally operating, essentially unperturbed neuromuscular system. For full power, however, this approach will clearly be well complemented by perturbation techniques. For example, to test our understanding of the system, we would like to repeat the reconstructions in Fig. 4 experimentally. If we fire the real motor neurons in the modulated pattern but in the unmodulated system, or conversely in the unmodulated pattern in the modulated system, do we obtain the contraction waveforms predicted in row 3 of Fig. 4B and row 4 of Fig. 4A, respectively? Methods for controlled experimental stimulation of the crab cardiac system, albeit requiring its further dissection, have been developed [8] and such experiments are in progress.
Acknowledgments
Supported by NIH grant R01 NS41497 to V.B.
Biographies
 Estee Stern is pursuing her Ph.D. at the Mount Sinai School of Medicine in New York. She received her M.S. from the Courant Institute of Mathematical Sciences at NYU in 2004, where she studied the effects of compensatory mechanisms in the circulatory system. She currently uses mathematical and computational tools to study the properties governing modulation of neuromuscular networks.
 Timothy Fort received his Ph.D. from the University of Rhode Island in 2000. After postdoctoral work at the Institute of Neurobiology, University of Puerto Rico, he is currently completing a postdoctoral position at the University of the Virgin Islands. He uses experimental techniques to study the modulation of integrated central pattern generator-effector systems in crustaceans.
 Mark W. Miller received his Ph.D. from the University of Connecticut in 1980. He did postdoctoral work at the University of Hawaii, Hebrew University, UCLA, and Columbia University before joining the faculty of the Institute of Neurobiology at the University of Puerto Rico. His research uses model invertebrate systems to understand the regulation of motor behavior.
 Charles S. Peskin received his Ph.D. in Physiology from the Albert Einstein College of Medicine in 1972. In 1973, he joined the faculty of the Courant Institute of Mathematical Sciences, New York University, where he works on mathematical and computer modeling of physiological systems, especially in the areas of cardiac physiology, biomolecular motors, and neural science.
 Vladimir Brezina received his Ph.D. from UCLA in 1988. He did postdoctoral work at Columbia University and the Mount Sinai School of Medicine before becoming a faculty member at Mount Sinai. He uses both experimental and computational approaches to study modulated neuromuscular networks in Aplysia, and, more generally, the principles of operation of complex neurobiological networks.
Footnotes
Publisher's Disclaimer: This is a PDF file of an unedited manuscript that has been accepted for publication. As a service to our customers we are providing this early version of the manuscript. The manuscript will undergo copyediting, typesetting, and review of the resulting proof before it is published in its final citable form. Please note that during the production process errors may be discovered which could affect the content, and all legal disclaimers that apply to the journal pertain.
References
- 1.Brezina V, Orekhova IV, Weiss KR. The neuromuscular transform: the dynamic, nonlinear link between motor neuron firing patterns and muscle contraction in rhythmic behaviors. J Neurophysiol. 2000;83:207–231. doi: 10.1152/jn.2000.83.1.207. [DOI] [PubMed] [Google Scholar]
- 2.Brezina V, Orekhova IV, Weiss KR. Optimization of rhythmic behaviors by modulation of the neuromuscular transform. J Neurophysiol. 2000;83:260–279. doi: 10.1152/jn.2000.83.1.260. [DOI] [PubMed] [Google Scholar]
- 3.Brezina V, Weiss KR. The neuromuscular transform constrains the production of functional rhythmic behaviors. J Neurophysiol. 2000;83:232–259. doi: 10.1152/jn.2000.83.1.232. [DOI] [PubMed] [Google Scholar]
- 4.Calabrese RL. Modulation of muscle and neuromuscular junctions in invertebrates. Semin Neurosci. 1989;1:25–34. [Google Scholar]
- 5.Cooke IM. Reliable, responsive pacemaking and pattern generation with minimal cell numbers: the crustacean cardiac ganglion. Biol Bull. 2002;202:108–136. doi: 10.2307/1543649. [DOI] [PubMed] [Google Scholar]
- 6.Fort TJ, Agricola HJ, Brezina V, Miller MW. Regulation of the crab heartbeat by crustacean cardioactive peptide (CCAP): central and peripheral actions. doi: 10.1152/jn.00939.2006. Submitted. [DOI] [PubMed] [Google Scholar]
- 7.Fort TJ, Brezina V, Miller MW. Modulation of an integrated central pattern generator-effector system: dopaminergic regulation of cardiac activity in the blue crab Callinectes sapidus. J Neurophysiol. 2004;92:3455–3470. doi: 10.1152/jn.00550.2004. [DOI] [PubMed] [Google Scholar]
- 8.Fort TJ, Krenz WD, Brezina V, Miller MW. Modulation of the crab cardiac system: assessment of synaptic transmission with controlled stimulus trains. Soc Neurosci Abstr. 2005:752.23. [Google Scholar]
- 9.Hunter JD, Milton JG. Synaptic heterogeneity and stimulus-induced modulation of depression in central synapses. J Neurosci. 2001;21:5781–5793. doi: 10.1523/JNEUROSCI.21-15-05781.2001. [DOI] [PMC free article] [PubMed] [Google Scholar]
- 10.Sen K, Jorge-Rivera JC, Marder E, Abbott LF. Decoding synapses. J Neurosci. 1996;16:6307–6318. doi: 10.1523/JNEUROSCI.16-19-06307.1996. [DOI] [PMC free article] [PubMed] [Google Scholar]
- 11.Stern E, Peskin CS, Brezina V. A method for decoding neurophysiological responses to arbitrary spike trains; Presentation at CNS*2005; July 2005; Madison, WI, U.S.A. [Google Scholar]
- 12.Worden MK. Modulation of vertebrate and invertebrate neuromuscular junctions. Curr Opin Neurobiol. 1998;8:740–745. doi: 10.1016/s0959-4388(98)80116-5. [DOI] [PubMed] [Google Scholar]


