Abstract
We study the solvation of polar molecules in water. The center of water's dipole moment is offset from its steric center. In common water models, the Lennard-Jones center is closer to the negatively charged oxygen than to the positively charged hydrogens. This asymmetry of water's charge sites leads to different hydration free energies of positive versus negative ions of the same size. Here, we explore these hydration effects for some hypothetical neutral solutes, and two real solutes, with molecular dynamics simulations using several different water models. We find that, like ions, polar solutes are solvated differently in water depending on the sign of the partial charges. Solutes having a large negative charge balancing diffuse positive charges are preferentially solvated relative to those having a large positive charge balancing diffuse negative charges. Asymmetries in hydration free energies can be as large as 10 kcal/mol for neutral benzene-sized solutes. These asymmetries are mainly enthalpic, arising primarily from the first solvation shell water structure. Such effects are not readily captured by implicit solvent models, which respond symmetrically with respect to charge.
1. Introduction
We explore here the hydration of polar solutes. This is important for protein folding and ligand binding, among other processes. The simplest models of solvation provide one picture of how water influences these processes. In the simplest electrostatic models, such as the Poisson–Boltzmann1 and generalized Born models,2 water is treated as a dielectric continuum. In these models, transferring a negative ion to water has the same free energy as transferring a positive ion of the same size to water. Dielectric continuum models respond identically to positively and negatively charged atoms of the same size.
In reality, however, positive ions are hydrated differently than negative ions in water. This has long been recognized in applications of the Born theory of ion solvation: the effective radii of positively and negatively charged ions are chosen to be different in order to capture experimental hydration free energies.3–9 In a simple explanation, dating to 1939, Latimer et al. attributed this to the asymmetric structure of water. A negative ion will attract water's positive hydrogens, which are very close to the van der Waals surface of water, so the ion will have a strong electrostatic attraction for water. Therefore, they argued, a negative ion's effective radius should be nearly equal to its van der Waals radius. In contrast, a positive ion will attract water's negative oxygen, which is buried further inside water's van der Waals surface. So, they reasoned, the effective radius of a positive ion must be closer to the combination of its van der Waals radius and that of oxygen. Regardless of whether this is the reason for needing different effective radii or not, affinities of positive ions for water are overestimated whenever effective radii for positive and negative ions are taken to be independent of the sign of the atomic charge.3
Similar effects are seen for large ions. Several recent computational studies addressed this in the context of the TATB hypothesis. In this hypothesis, the hydration free energies of isosteric tetraphenylarsonium (TA+) and tetraphenylborate (TB−) are assumed to be equal. With this assumption, hydration free energies of various ions can be derived from the hydration free energies of ion pairs with reference to these two ions. However, computational studies indicate that hydration free energies of TA+ and TB− are not equal in several different molecular mechanics water models;10,11 the negative ion is preferentially hydrated. Computational studies have also found this to be the case for hypothetical ion analogs, like positively and negatively charged methane6 or negatively and positively charged chloride5 or ionic series.12
The asymmetric response of water has consequences beyond ionic hydration free energies. One recent study noted energetic differences between positive ions approaching a negative surface versus negative ions approaching a positive surface.13
Here, we study asymmetries in hydration free energies of polar solutes that have no net charge. We use alchemical free energy methods, combined with molecular dynamics simulations, to compute the hydration free energies of a number of fictitious molecules with simple geometries (regular equilateral polygons, or “bracelets”, and linear chains, or “rods”), each of which is overall net neutral, yet has an internal charge distribution we define. We also apply these methods to several real molecules, and artificial analogs. The reason for inventing these fictitious molecules is to explore matters of principle involving different internal charge distributions that we can control. By simulating these solutes in standard models of explicit water (TIP3P,14 TIP4P-Ew,15 and TIP5P-E16), we can explore how computer models of water respond to different charge distributions in polar solutes.
2. Simulation Methods
We use alchemical free energy methods to compute the free energies of transfer from vacuum to water. Alchemical free energy methods compute free energies using a series of separate “alchemical” simulations with varying degrees of interaction between the solute and water, from fully interacting to noninteracting. Here, we use the Bennett acceptance ratio (BAR) approach to analyze these simulations and compute the free energy of transfer from water to vacuum.17,18
2.1. Hydration Free Energies
We employed the same general simulation protocols as in a previous study of hydration free energies of small molecules,19 except that we used GROMACS20,21 version 3.3.1.
In addition, for the regular polygon “molecules” (which we call “bracelets”) considered here, there were several exceptions: We added additional bonds within each molecule as necessary in order to keep the molecule completely rigid and used SHAKE22 to keep bond lengths fixed. The addition of these additional bonds also removed all intramolecular interactions, so no separate vacuum calculations were necessary. For the linear “molecules” (“rods”) examined here, bond lengths were constrained with SHAKE and the molecules were kept linear by adding harmonic angle restraints with a minimum at 180° and a spring constant of 95 kcal·(mol·degree2)−1, as well as by adding additional bonds between the first atom and each other atom. This also excluded all intramolecular interactions.
Geometries for the bracelets and rods were generated automatically using a bond length of 1.4 Å (a typical aromatic C–C bond length) and solving for atom positions based on the size of the polygon or chain. Molecules were then solvated in a cubic box of water with a minimum distance of 12 Å from the solute to each side. Lennard-Jones parameters for all artificial polygons and chains were taken to be those for the aromatic carbon (“ca”) atom type from the generalized Amber force field (GAFF):23 σ = 0.339967 nm and ∈ = 0.086 kcal/mol. We also used analogs where we varied the σ parameter by multiplying it by a constant factor for all atoms (1.5 or 2).
For bracelets, we assigned partial charges with several different schemes, each of which we applied for both cases where the large charge was positive (“P-solutes” or “P-bracelets”) and cases where it was negative (“N-solutes” or “N-bracelets”). These schemes were the following (Figure 1, for the hexagonal case): (a) The “distributed” scheme, where one atom is given a large charge (±1) and the bracelet is made net neutral by distributing a uniform neutralizing charge across the remainder of the atoms in the ring. (b) The “opposing” scheme, where one atom is given a large charge (±1) and two other atoms are given charges of (∓0.5); these atoms are as far away from the large charge as possible. (c) The “fixed dipole” scheme, where one atom is given a large charge (±1) and the remaining charges are of opposite sign and chosen/distributed to (1) keep the molecule net neutral, and (2) fix the dipole moment to the value for the triangular geometry. We discuss the dipole moment issue in more detail below, but the basic concern is that, in schemes a and b, changing the geometry also changes the dipole moment. It was also desirable to test a scheme where the dipole moment is held fixed across all geometries, so we developed the fixed dipole scheme. Additional charge distributions for this scheme are given in the Supporting Information.
Figure 1.
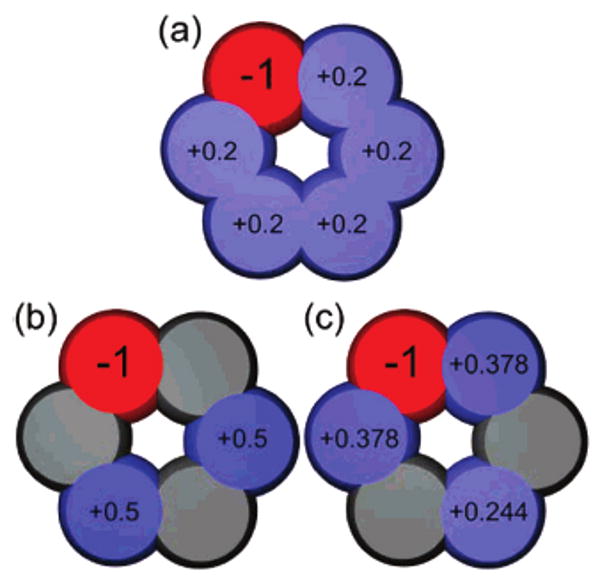
Different charge distribution schemes used, for the hexagon. Shown are example charge distributions for the N-bracelet case, where the large charge is negative (red). In the distributed scheme (a), neutralizing charge is distributed equally across all of the remaining atoms. In the opposing scheme (b), neutralizing charges of 0.5 are placed on the two atoms as far away as possible away from the atom with the largest charge. In the fixed dipole scheme (c), charges are distributed to keep the dipole moment fixed to that for the triangle. Atoms are color coded by magnitude of the charge, with red for negative, blue for positive, and gray for neutral.
For rods, all atoms were neutral except for two, one with a charge of +1 and one with a charge of −1. We tried all possible locations of the +1 and −1 charges for each rod of a given number of atoms. The rationale for this choice of charges is that these are among the simplest conceivable charge distributions for net neutral linear solutes.
For nitrobenzene and N,N-dimethylaniline, initial parameters were assigned as discussed previously,19 with AM1-BCC24,25 charges and the GAFF parameter set. To determine how much of the difference in experimental hydration free energies of these molecules is due to charge asymmetries, we made a series of analogs by hand. We made a united atom (UA) dimethylaniline analog by transferring the charge from the methyl hydrogens to the methyl carbons and removing the methyl hydrogens. We then created analogs where the only difference was electrostatic, by changing the Lennard-Jones parameters of all equivalent atoms to the mean of those from the two molecules (i.e., assigning the methyl carbons and nitrobenzene oxygens Lennard-Jones parameters appropriate for the average of a methyl carbon and a nitro oxygen). We applied a similar procedure for the bonded parameters, leaving us analogs that differed only by charge distribution (we call these “hybrid” UA N,N-dimethylaniline and “hybrid” nitrobenzene below). We then made two sets of further analogs for each molecule where the charges on the ring were equivalent and net neutral so that we could swap between molecules where the large charge was positive, and those where it was negative, simply by changing the sign of the charges on the side group. Partial charges for these are shown in the Supporting Information.
Most of our calculations were done using TIP3P14 water, but we also tested the TIP4P-Ew15 and TIP5P-E16 water models in some cases, as noted below, to ensure we were not observing artifacts of a particular water model.
2.2. Enthalpy and Entropy of Hydration
We computed the entropy and enthalpy of hydration for one particular bracelet (the hexagon) using the opposing scheme for partial charges. We also did the same for rods with five components. These were computed by running one set of 50 ns simulations in both the fully interacting and noninteracting end states for each of the two charge distributions. From these simulations, we computed the average enthalpy of hydration and the uncertainty in the enthalpy of hydration by using standard error analysis after computing the autocorrelation time, as discussed previously.19 A similar procedure has been used previously to compute hydration enthalpies of a variety of small molecules.26 From the enthalpy of hydration, we were able to extract the entropy of hydration using TΔS = ΔH − ΔG. For the bracelets, production simulations (for this part only) were done at constant pressure using the Berendsen barostat with a time constant of 0.5 fs, and for the rods, production simulations were done by doing an additional box rescaling after constant pressure equilibration to set the box volume to its average value, then discarding an additional 20 ps to equilibration. A convergence plot for the enthalpy of hydration for the hexagon with the opposing scheme is shown in the Supporting Information.
2.3. Occupancy Plots
We generated solvent occupancy plots for a series of our test molecules to help visualize how water solvates these systems. To generate these plots, we binned water oxygen and hydrogen positions from 10 000 separate configurations taken from a series of 10 ns simulations for each of the selected geometries. The bin cubes had widths ranging from 0.15 to 0.18 Å, depending on the size of the solute, and only atoms within 5 Å of any solute atom were considered in the resulting occupancy figures. We then displayed oxygen/hydrogen densities for any bin with an occupancy (as a fraction of the maximum occupancy) higher than the specified tolerance. We chose independent tolerances for the oxygen and hydrogen densities to best show the occupancy structure in the first solvation shell, and the resulting plots were rendered using POV-Ray. A table of all of the chosen tolerances can be found in the Supporting Information.
2.4. First Solvation Shell
Some of our simulations were aimed at learning whether the observed effects were dominated by the first solvation shell. We explored this by removing all of the waters except those in the first solvation shell around the artificial molecules. We defined the first solvation shell by plotting the radial distribution function for water around an atom in the artificial molecule and taking the distance to the first minimum in bulk (we used a value of 5 Å). We then removed all water molecules that did not have at least one atom within this cutoff. We evaluated energies for these configurations (solute plus first solvation shell) in vacuum using GROMACS with our standard cutoffs, but turning off periodicity in the treatment of long-range electrostatics. Average energies were evaluated over 1000 simulation snapshots.
2.5. Implicit Solvent Calculations
The simplest way to “fix” implicit solvent models to include asymmetries in hydration free energies of positive and negative ions is to use different effective radii for positive versus negative ions.3 To explore the possibility of such fixes for polar, neutral solutes, we used ZAP, a Poisson–Boltzmann (PB) solver by OpenEye, as our implicit solvent model, and applied it to the different bracelets for the “opposing” scheme (charges ±1, ∓0.5, ∓0.5), using Bondi radii (1.7 Å for carbon). We used a grid spacing of 0.5 Å for ZAP, with an inner dielectric of 1. After comparing with explicit solvent (TIP3P) results with no radii adjustments, we attempted to parametrize new radii to match the explicit solvent (TIP3P) results. We took the triangle geometry and adjusted the radii on the positively and negatively charged atoms separately until we achieved agreement for both explicit solvent cases (where the large charge is positive, and where it is negative). We performed the optimization by multiplying the PB radius of all positively charged atoms by a factor of a and all negatively charged atoms by a factor of b, beginning with the Bondi radii. We performed a search on a grid of size 0.05 in a and b with a and b running from 0 to 3 and found the best solution where neither radius was zero. This was a = 0.5 and b = 1.5, or radii of 0.85 and 2.55 Å, respectively. We then applied these radii from the triangle case to all other bracelets to test transferability. The results are discussed below.
3. Results and Discussion
We find that a polar molecule and its charge mirror image, with the signs of the partial charges reversed, have different hydration free energies. As described below, we find that this is due to the asymmetrical response of the surrounding water, especially the first solvation shell.
3.1. Case Study: Hexagon
Consider two hexagonal “bracelet” molecules. For the negative hexagonal bracelet, or N-bracelet, one of the beads (atoms), the “head bead”, has a charge of −1, and the remaining five beads all have charges of +0.2 (the distributed charge scheme). For the positive hexagonal bracelet, or P-bracelet, the head bead has a charge of +1, and the five other beads have charges of −0.2 each. Both molecules are net neutral and are identical except the sign of the charges is reversed. In TIP3P water, the hydration free energy for the N-bracelet is −26.01 ± 0.04 kcal/mol and that for the P-bracelet is −16.38 ± 0.04 kcal/mol. We define the asymmetry free energy as the hydration free energy for the positive case minus that for the negative case. In this case, the asymmetry free energy is 9.63 kcal/mol. The N-bracelet is more favorably solvated than the P-bracelet.
What is the origin of this asymmetry? Figure 2 provides an explanation. It shows how the water molecules are distributed differently around the N-bracelet versus the P-bracelet solutes (which are charge image pairs, identical in every respect except for having partial charges of opposite sign). Water molecules point their hydrogens at the head bead on the N-bracelet. Those hydrogens, for steric reasons, can get very close to the head bead, resulting in strong electrostatic interactions. In contrast, water molecules point their oxygens toward the head bead of the P-bracelet. The oxygens cannot approach as close for steric reasons. Hence, the electrostatic interaction between water's negative oxygen and the positive solute head bead is weaker in this case, resulting in a less-negative hydration free energy for P-bracelets than for N-bracelets. A schematic of this is shown in Figure 3. Marked differences in solvent structure have also been observed around negatively charged ions versus otherwise identical ions that are positively charged.12
Figure 2.
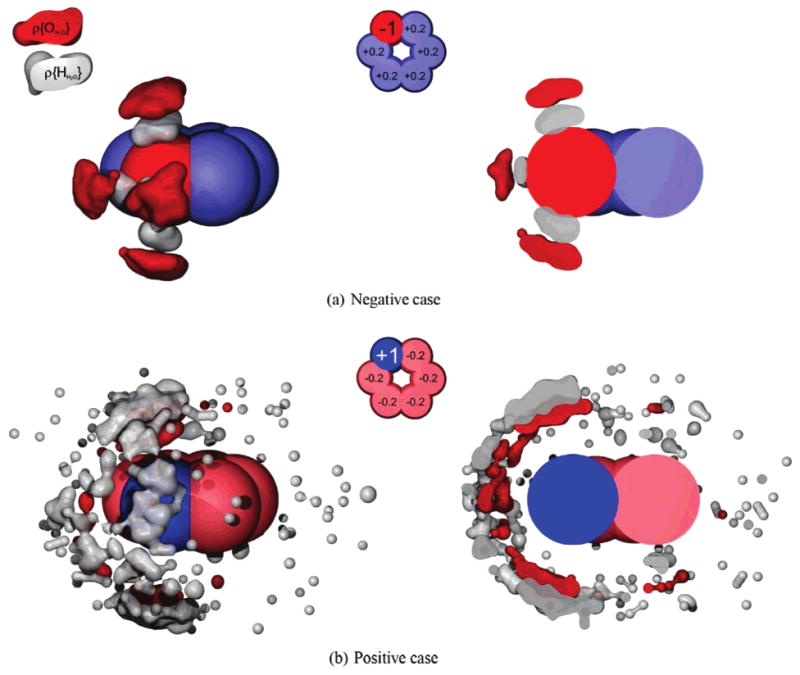
Water (oxygen and hydrogen) occupancies around the hexagonal bracelet. Density plots of water and hydrogen occupancies in the most occupied bins with the distributed charge scheme, for case a where the large charge is negative, and b where the large charge is positive. At left is a view of the density from outside, and at right is a slice through the solute center. In a, hydrogen atoms are able to get very close to the negative atom, whereas in b, oxgen atoms are further from the positive charge. The negative case also pays a higher entropic cost for solvation than does the positive case, and this is apparent from the relatively tight confinement of water in a compared to b. Occupancy tolerance values are shown in the Supporting Information.
Figure 3.
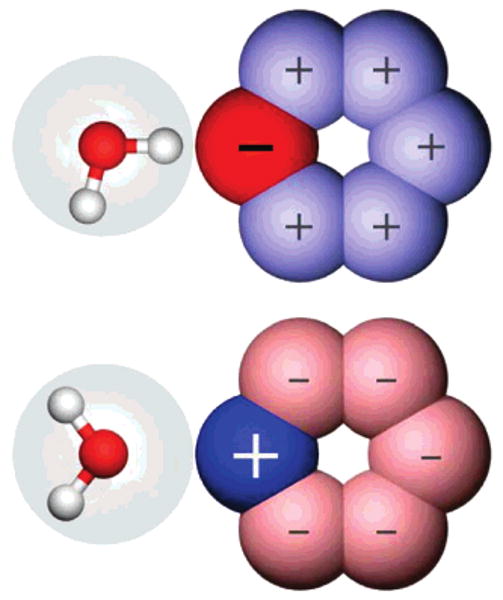
Illustration of the origin of the hydration free energy asymmetries. Shown are cartoons of hexagonal bracelets with a negative head bead (top) and positive head bead (bottom). A cartoon of a TIP3P water molecule is shown. The water van der Waals surface is shown as a transparent sphere, and charge sites are shown as filled spheres. Because the steric center of water is the oxygen charge site, the hydrogen charge sites can approach much closer to the negative head bead (top) than the oxygen charge site can approach the positive head bead (bottom). This, and associated differences in the water structure, results in hydration free energy asymmetries.
We decomposed the hydration free energies into entropic and enthalpic components. We find that the hydration free energy asymmetry is enthalpy-driven. For the N-bracelet, ΔH = −37.3 ± 0.2 kcal/mol, and −TΔS = 11.3 ± 0.2 kcal/mol, whereas for the P-bracelet, ΔH = −20.3 ± 0.2 kcal/mol and −TΔS = 3.9 ± 0.2 kcal/mol. The stronger electrostatic attraction of water to the N-bracelet also leads to more restriction of the water orientations, as seen in the entropic contributions, which play a compensating role. We also decomposed the enthalpic change into water–solvent and water–water components (neglecting the PME contribution to Coulombic interactions) and find that the water–water enthalpic change on hydration is almost identical for the N and P-bracelets; the difference is only −1.5 ± 0.9 kcal/mol (favoring the N-bracelet). This indicates that, as suggested above, it is the difference in solute–water interactions, rather than changes in the hydrogen-bonding network within water, that drives the hydration free energy asymmetry.
We find that most of the free energy asymmetry of the bracelet charge-image pairs is due to first solvation shell effects. The average potential energy of the first solvation shell (after normalizing to an equal number of water molecules) is lower by 21 ± 7 kcal/mol for the negative bracelet than the positive bracelet, in rough agreement with the difference in enthalpy of solvation computed from the full simulations (17.0 ± 0.35 kcal/mol).
3.2. Magnitude of the Asymmetry Depends on Geometry
Next, we explored a sequence of solute geometries: triangle, square, pentagon, hexagon, heptagon, and octagon. As before, each net neutral molecule has a charged head bead and the rest of the beads (the “tail”) have dispersed neutralizing charges of the opposite sign. Figure 4 shows that the hydration free energy asymmetry grows larger as the solute grows larger. This is probably because, as the polygon size grows larger, the magnitude of the charges on the tail beads shrinks, so the head bead becomes more dominant. As before, N-bracelets are preferentially solvated over their P-bracelet charge image pairs.
Figure 4.
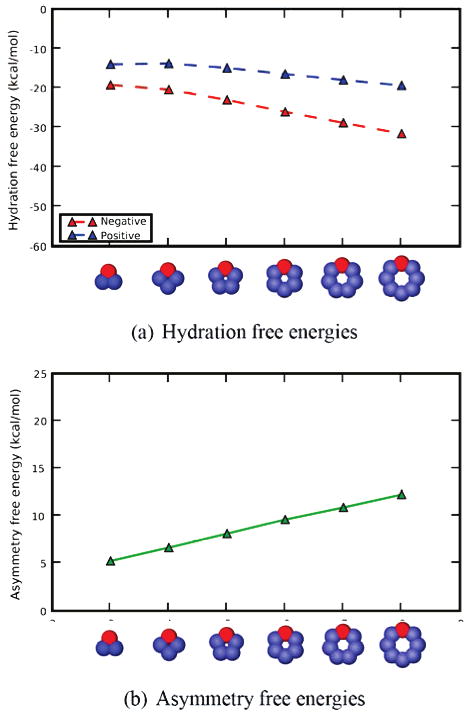
Hydration free energies and asymmetries as a function of bracelet size, for the distributed scheme. Shown, for solutes where the neutralizing charge is distributed, are (a) calculated hydration free energies in TIP3P water as a function of bracelet (polygon) size and (b) the asymmetry in hydration free energies between solutes where the large charge is positive, and those where the large charge is negative, for TIP3P water, as a function of bracelet size. In the legend, “positive” and “negative” denote the sign of the largest charge; in all cases the solutes are net neutral. Cartoon representations at the bottom are for the “negative” case; red atoms are negative and blue are positive, with color intensity denoting the charge magitude. Lines are a guide for the eye.
In separate tests, we tried increasing the Lennard-Jones radius for the beads by a factor of 2 and found that this, unsurprisingly, leads to smaller hydration free energies because of the weaker electrostatic interactions with water (Supporting Information). The trends in the asymmetry free energy remain the same. Furthermore, the original Lennard-Jones radius is not unrealistic: A united atom methyl group has a radius only roughly 1.1 times larger, and the oxygen radii for acetic acid in GAFF23 are slightly smaller (by a factor of around 0.9).
3.3. Asymmetry is Not a Simple Function of Dipole Moment or Charge Distribution
It could be argued that the asymmetry differences for different solutes in the polygon series, above, can be explained simply in terms of an increasing dipole moment as we move up the series from triangle to hexagon. To test this, we repeated all of the calculations from Section 4.2 using a fixed dipole scheme, where the distribution of charges was designed to keep the dipole moment the same as that of the triangle, in every geometry. (Higher-order multipole moments also change with geometry, but they are weaker than dipole interactions). Resulting asymmetry free energies are shown in Figure 5. Also, it could be argued that both of the above schemes change the charge distribution, not just the geometry, so we repeated all of the calculations using the opposing scheme discussed above, where the neutralizing charge is distributed across only two beads, with charge magnitude 0.5, and these two beads are as far away from the head bead as possible. Results are shown in Figure 5. Additional figures, as well as the full data, are available in the Supporting Information.
Figure 5.
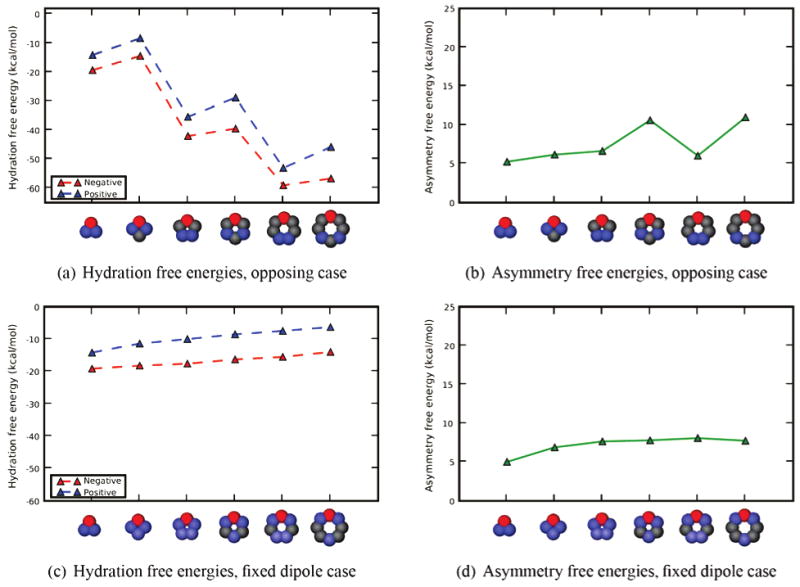
Asymmetries for the opposing and fixed dipole bracelets, as a function of size. Shown, as a function of bracelet size, are asymmetries in TIP3P water for (a) the opposing case, where the neutralizing charges are of magnitude 0.5 and as far from the large charge as possible, and (b) for the case where the neutralizing charges are distributed to keep the dipole moment of the solute fixed to the value for the triangle case. In the legend, positive and negative denote the sign of the largest charge. Cartoon representations at the bottom are for the negative case. Red atoms are negative and blue are positive, with color intensity denoting the charge magnitude. Lines are a guide for the eye.
In both schemes, hydration asymmetries still depend on the size of the bracelet and generally increase with increasing size. Again, in all cases, N-bracelets are preferentially solvated over P-bracelets. In the opposing scheme (Figure 5a), the asymmetry free energy is markedly larger for bracelets with six and eight sides than for those with odd numbers of sides. We believe this is because two adjacent beads with charges of 0.5 (in cases with odd numbers of sides) behave like a single, larger bead with charge 1.0. This is not true when the charged beads are separated by a neutral bead (in cases with even numbers of sides). Thus cases with even numbers of sides have larger asymmetry free energies.
It is interesting to note that, in the fixed dipole scheme, the asymmetry free energy levels off for larger solutes (Figure 5). This may be because the charge distributions for these cases begin to change relatively little for larger sizes (as in the Supporting Information), at least if two adjacent beads with smaller charges can function like a single bead with twice the charge. Or it could be that the asymmetry is somehow related to the dipole moment.
We also find that hydration free energies are asymmetric even for solutes with much smaller partial charges. In particular, as we compute the electrostatic part of the hydration free energy, we do so by turning off the solute partial charges linearly as a function of λ, and we find that N-bracelets are always preferentially solvated over P-bracelets, even when all of the partial charges are extremely small. A plot is shown in the Supporting Information.
3.4. Hydration Free Energy Asymmetry is Not an Artifact of the Water Model
Are these hydration free energy asymmetries due to a bad model of water? Our original calculations were in TIP3P water; we repeated them in TIP4P-Ew15 and TIP5P-E16 water using the “distributed” charge scheme. In TIP4P water models, the oxygen charge center is offset from the Lennard-Jones center by a short distance. In TIP5P models, there are two offset oxygen charge centers (“lone pairs”).27
We found that hydration free energy asymmetries increase in the order TIP5P-E < TIP3P < TIP4P-Ew (Figure 6, and Supporting Information). The TIP5P-E < TIP3P result is consistent with previous work on ion solvation.10 A previous study on the hydration free energies of charged spheres (ions) also found hydration free energy asymmetries that were strongly water-model-dependent.12 It is not clear which, if any, of these should be regarded as a “gold standard”, but it is clear that all of these models have water dipole centers that are offset from the van der Waals center and give asymmetric hydration free energies for different polar solutes.
Figure 6.
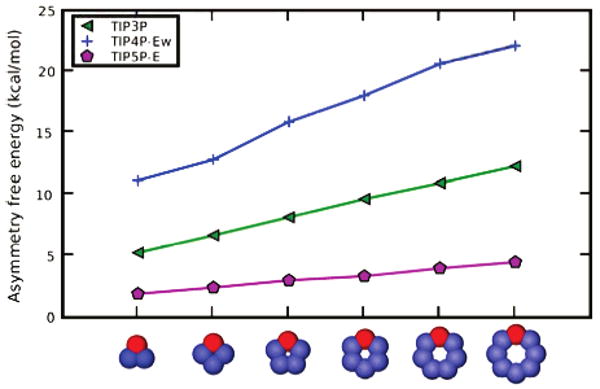
Asymmetries for the distributed scheme, with different water models. Shown, as a function of bracelets size, are asymmetries for bracelets with distributed charges, for TIP3P (triangles), TIP4P-Ew (plus symbols), and TIP5P-E (pentagons). In each case, the asymmetry increases monotonically with the size of the bracelet. Cartoon representations at the bottom are for the negative case. Red atoms are negative and blue are positive, with color intensity denoting the charge magnitude. Lines are a guide for the eye.
Previous work studying hydration free energies of various small molecules in explicit solvent also found that results could be highly water-model-dependent.19 So it is perhaps not surprising that we see different hydration free energy asymmetries with different water models. How asymmetric is real water, and which water model best represents reality? Our data cannot shed any light on this. It can be argued that TIP4P-Ew and TIP5P-E have better pure water properties, but previous work found at least that computed hydration free energies are less accurate with TIP4P-Ew relative to TIP3P,19 but the small molecule parameters were developed using three-point water models, so this decrease in accuracy does not necessarily mean that TIP4P-Ew is worse. Clearly more work in this area is needed, and it may prove interesting to repeat the studies done in this work using QM/MM simulations, which could help provide an answer to the question of how asymmetric real water is.
3.5. Linear Chains Also Exhibit Asymmetries that Depend on Arrangement of Charges
In addition to bracelet solutes, we also explored polar neutral straight rods of beads, having various internal charge distributions (Figure 8 and Supporting Information). Again, we find hydration free energy asymmetries, typically around 3 kcal/mol (Figure 9). As with the bracelets, the sign on the head bead determines the dominant electrostatics. The rod with a negative head bead is preferentially solvated in water over the rod with the positive head bead. Also, as with bracelets, these effects are enthalpically driven. It is interesting to note that the asymmetry is much smaller, but still not zero, if there is no head bead.
Figure 8.
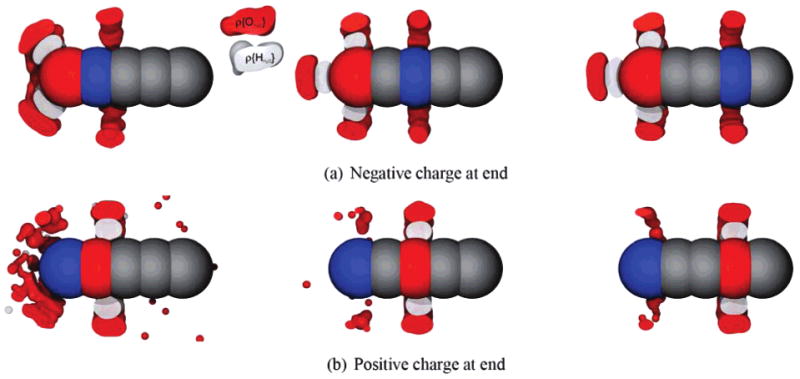
Water (oxygen and hydrogen) occupancies around some rods. Shown are density plots of water and hydrogen occupancies in the most occupied bins around several different rod chains, cut away through the center of the rod. Red atoms are negatively charged (−1), and blue are positively charged (+1). Occupancy tolerance values are shown in the Supporting Information.
Figure 9.
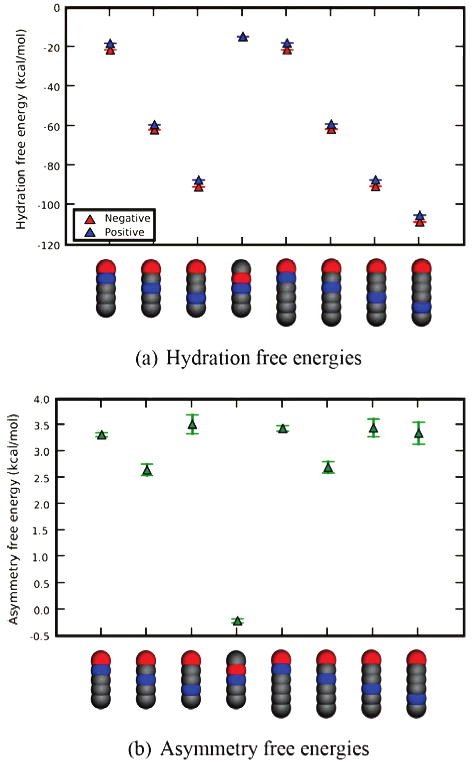
Hydration free energies and hydration asymmetries for different rods with five and six members. Shown are results for the indicated different linear cases for selected five- and six-element rods. Red spheres are negatively charged, blue are positively charged, and gray are neutral. The asymmetry free energy is measured as the difference in hydration free energies between the molecule shown, and its analog with the sign of the charges reversed.
There are several interesting features apparent in the water occupancy plots (Figures 7 and 8). First, there are several different kinds of water structure around charged atoms in Figure 8: (1) rings, or simple equatorial structures, like those around the buried charged atom in every part of Figure 8 and around the head atom in the right two panels of Figure 8b; (2) rings plus caps, where the cap lies on the rod axis, like that near the negatively charged atom in part a of Figure 8; and (3) lampshades, as in the left panel of parts a and b of Figure 8. These features are apparently influenced strongly by the detailed solvent structure because it is not obvious in advance which structure to expect. Apparently, solvent granularity is playing a key role here. Additionally, there are clear asymmetries between Figure 8a and b. Finally, even at the largest separations between the two charges, there is communication between water surrounding the two charged atoms. This is evidenced by the fact that the mean water dipole moment always points from positive to negative, and the ring structures around the buried atoms appear pushed away from the head atom (Figure 7).
Figure 7.
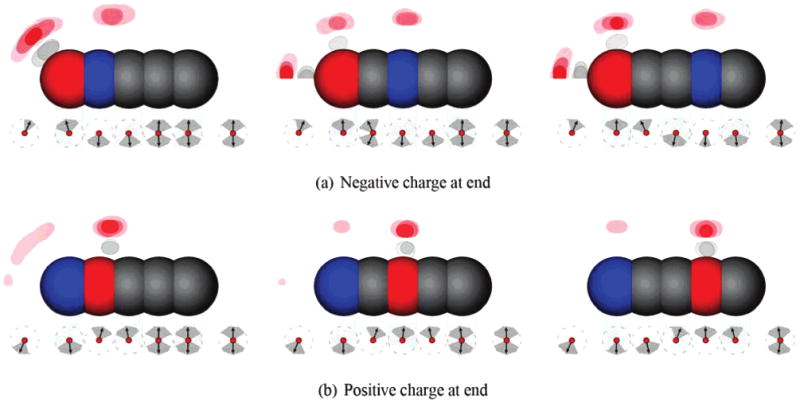
Water (oxygen and hydrogen) occupancies and dipole orientations around some rods. Shown are density plots of water oxygen (red) and hydrogen (gray/white) occupancies in the most occupied bins around several different rods chains (top half of each plot), as well as the mean water dipole orientation (bottom half of each plot, arrows) and full width at half-maximum of the distribution of dipole orientations (gray regions around arrows). Red atoms are negatively charged (−1), and blue are positively charged (+1). When two dipole arrows are shown, both are equally probable. Cylindrical symmetry is used to project occupancies and dipoles into the plane. Occupancy tolerance values are shown in the Supporting Information.
Ben-Naim et al. have pointed out the concept of conditional solvation, where the solvation free energy of a particular group depends on its environment due to correlations between neighbors out to some distance.28 That is exactly the effect we see here, and correlations can extend out past four neighbors for the rods considered.
Detailed maps of the orientation and density of the first solvation shell water around these solute rods are available in the Supporting Information.
3.6. Observed Asymmetries are Not Easily Built into Implicit Solvent Models by Adjusting Radii
Implicit solvent models often handle asymmetries in ion hydration free energies by choosing different effective radii for negative ions versus positive ions.4–9 In this context, for every hydration free energy, there is one adjustable parameter (the ionic radius) so it is possible to adjust radii to get perfect agreement with experiments.
For our hypothetical net neutral solutes, however, continuum dielectric implicit solvent models predict hydration free energy asymmetries of zero, for identical radii. We tested this using OpenEye's ZAP, which solves the Poisson–Boltzmann equation, and computed hydration free energies for all of the bracelets for the opposing charge scheme. Indeed, implicit solvent hydration free energies were identical for P- and N-bracelets. The rms error (relative to explicit solvent results) was 16.7 kcal/mol for N-bracelets and 10.56 kcal/mol for P-bracelets.
We then tested whether the asymmetry could be captured with appropriate radii. We adjusted the radii for positively and negatively charged atoms until we reproduced the explicit solvent (TIP3P) hydration free energies for the triangle geometry (capturing the asymmetry).33 However, these radii were not transferrable to other bracelets (Figure 10), with rms errors of 18 kcal/mol for N-bracelets and 13 kcal/mol for P-bracelets, so hydration free energies actually get worse with the new radii. Hence, using different radii to capture charge asymmetries is not a general and transferrable solution for computing hydration free energies. Adjusting radii would be especially problematic when solute geometry can change as a function of time, but this is true for many biomolecules, polymers, and even small molecules.29
Figure 10.
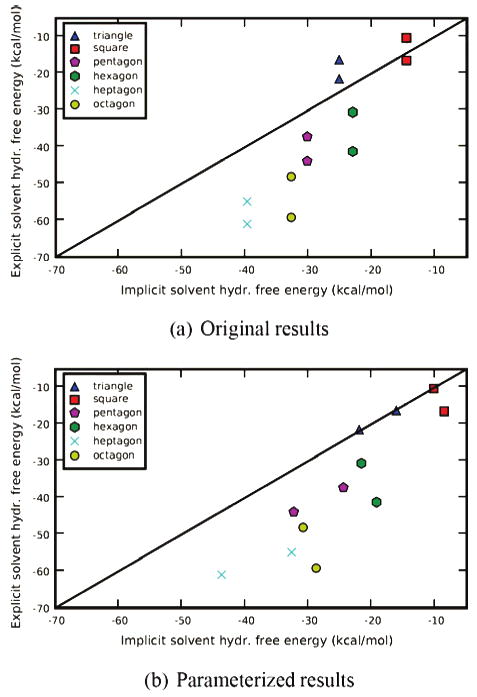
Comparison of implicit and explicit solvent hydration free energies for bracelets with the opposing scheme. Shown are explicit (TIP3P) versus implicit (PB) solvent hydration free energies for different bracelets with the opposing charge scheme. (a) Hydration free energies from explicit solvent versus implicit solvent using Bondi radii. (b) Hydration free energies from explicit solvent versus implicit solvent with radii for positive and negative atoms derived to make the triangle results match with explicit solvent as well as possible. The black line is the x = y line denoting agreement between explicit and implicit solvent.
3.7. Real Solutes Also Appear to Have Hydration Free Energy Asymmetries
Our bracelet and rod solutes described above are fictitious, chosen deliberately to explore hydration free energy asymmetries. In those cases, the only difference between pairs was electrostatic. Here, we apply the same tool to real solutes, where we now consider an isosteric pair, N,N-dimethylaniline and nitrobenzene.
Nitrobenzene and N,N-dimethylaninline each have a side group. The side groups have nearly opposite polarities. In nitrobenzene, the nitrogen has a large positive charge (because the oxygens are electron withdrawing, and share the negative charge). In N,N-dimethylaniline, the nitrogen has a large negative charge (because the nitrogen is electron-withdrawing relative to carbon; the methyl groups share the positive charge). In real solute pairs, such as these, there is not perfect charge mirroring. Thus, the dipole moment of N,N-dimethylaniline in cyclohexane is 1.5 D30 and that of nitrobenzene is 4.0 D.31
Experimentally, nitrobenzene is more strongly hydrated, with a hydration free energy of −4.12 kcal/mol; N,N-dimethylaniline has a hydration free energy of −3.45 kcal/mol, a difference of 0.67 kcal/mol.32 Because of the large difference in dipole moments, the Poisson–Boltzmann equation predicts a difference of 4.6 kcal/mol between the two hydration free energies.29 Given the large experimental difference in dipole moment, why are the hydration free energies so similar? Explicit solvent comes closer to reproducing the experimental difference. We calculated hydration free energies in TIP3P water and obtained −6.22 ± 0.02 kcal/mol for nitrobenzene and −4.07 ± 0.03 kcal/mol for N,N-dimethylaniline, a difference of only 2.1 kcal/mol.
To address the issue of asymmetries in hydration free energies, we created artificial analogs of the two molecules where we gradually removed all but the electrostatic differences. Our ultimate goal was to develop analogs where, simply by changing the sign of the charge on the benzene's side group, we could switch from representing nitrobenzene electrostatics to representing dimethylaniline electrostatics.
To do so, we first created united atom (UA) N,N-dimethylaniline, with methyl groups treated as single atoms. The hydration free energy for this was −3.49 ± 0.02 kcal/mol. We then further modified nitrobenzene and UA dimethylaniline by making hybrid molecules, where all Lennard-Jones and bonded parameters for the two molecules are identical so that the only remaining differences are electrostatic. “Hybrid” nitrobenzene had a hydration free energy of −6.05 ± 0.02 kcal/mol, and hybrid UA N,N-dimethylaniline had a hydration free energy of −3.38 ± 0.02 kcal/mol. We then created the further analogs shown in Table 1, where the aromatic ring and side group charges were each net neutral, so we could change the overall sign of the side group without changing the net charge of the molecule. In one scheme, the “neutral ring” scheme, we did this by changing all carbons attached to hydrogens, and the attached hydrogens, to have a net charge of zero. In another scheme, the “charged ring” scheme, we simply made the charge on each carbon equal to the charge on the attached hydrogen. (Partial charges are available in the Supporting Information). For each of these schemes, we did nitrobenzene and dimethylaniline analogs, both with the normal charge on the side group, and with the side group charges negated.
TABLE 1.
Computed Hydration Free Energies for Nitrobenzene and N,N-dimethylaniline Analog Pairs
| Analogs | |||
|---|---|---|---|
| Moleculea | ΔGsolv (kcal/mol) (largest charge negatived) |
ΔGsolv (kcal/mol) (largest charge positived) |
Asymmetry (kcal/mol) |
 |
-2.24±0.02 | -1.13±0.02 | 1.01±0.03 |
 |
-0.42±0.02 | 0.21±0.02 | 0.63±0.03 |
 |
-5.93±0.02 | -2.32±0.02 | 3.61±0.03 |
 |
-3.16±0.02 | -1.98±0.02 | 1.18±0.03 |
We show a cartoon of each molecule for the case where the large charge is positive. Neutral atoms are shown as filled gray spheres; charged atoms are shown as shells with colored spheres scaled to indicate the magnitude of the partial charge. Partial charges are available in the Supporting Information.
Partial charges for the side group in these cases are based on those from nitrobenzene.
Partial charges for the side group in these cases are based on those from UA N,N-dimethylaniline.
The case where the largest charge is positive is shown in the left column. For the other case, charges on the side group and attached carbon are negated, but any other charges are left unchanged.
Our results (Table 1) explain why the hydration free energies of the two molecules are relatively similar (experimentally and in explicit solvent), despite their large differences in polarity and dipole moment. We find that in every analog pair we created the compound that has a large negative charge and smaller positive charges (like N,N-dimethylaniline) is preferentially solvated over the equivalent compound with the sign of the charges reversed (like nitrobenzene). The magnitude of this effect ranges from 0.6 to 3.6 kcal/mol, depending on which charge distribution is used in the comparison. Thus, the large differences in dipole moment for N,N-dimethylaniline and nitrobenzene would tend to cause nitrobenzene to have a much more favorable hydration free energy; but this is opposed by the hydration free energy asymmetry, which favors N,N-dimethylaniline. This effect is not captured by the PB equation, which predicts a much larger difference in hydration free energies between nitrobenzene and N,N-dimethylaniline than those observed experimentally and in explicit solvent.
We suspect that similar patterns of hydration asymmetries can be found by studying existing hydration free energy measurements, but we have not yet identified other suitable isostere pairs.
4. Conclusions
We studied the hydration of various polar solutes in computational explicit water simulations. We considered solutes having a concentrated charge on one atom and diffuse neutralizing charges spread across several atoms. A positive head charge attracts the negative charge on a water molecule, whereas a negative head charge attracts the positive charges on a water. Because the charge center of water is offset from the steric center, solutes with negative head charges are preferentially hydrated over solutes with positive head charges. This asymmetry in hydration free energies is enthalpically driven, and dominated by first solvation shell effects. We observe these asymmetries with a variety of popular explicit water models, although the magnitude of the effect varies considerably with water model. We also find that the common strategy of adjusting effective atomic radii to capture charge asymmetries in implicit solvent models cannot capture these effects accurately.
In addition to testing these hydration free energy asymmetries for artificial solutes, we also compared real solutes. Nitrobenzene, for example, is not much more strongly solvated than N,N-dimethylaniline, despite the fact that it is much more polar. We found that this difference can be partly attributed to asymmetric organization of water with respect to the sign of the charge.
The asymmetries observed here are not captured by existing implicit solvent models. However, given that most of the asymmetries observed here are dominated by first solvation shell effects, there may be a way to improve implicit solvent models by including some explicit treatment of first solvation shell effects.
Supplementary Material
Acknowledgments
We thank Christopher I. Bayly (Merck-Frosst) for helpful discussions and for the suggestion of the N,N-dimethylamine/nitrobenzene pair. We thank M. Scott Shell (UCSB) and John D. Chodera (Stanford) for helpful discussions, and Nathan Baker (Washington University) for comments on the manuscript. We appreciate the support of NIH grant GM 63592.
Footnotes
Supporting Information Available: Charge distributions for all of the nitrobenzene and united atom N,N-dimethylaniline examples; charge distributions for the fixed dipole charge scheme; full tables of computed hydration free energies for rods and bracelets; a tolerance table used in making occupancy plots in Figures 2 and 8; plots showing hydration free energies for bracelets using other Lennard-Jones radii; plots showing water dipole orientations and radial distribution functions (in cylindrical coordinates) around selected rods; enthalpies of solvation for different rods; asymmetries for a selected bracelet using smaller partial charges; and convergence plot of enthalpy of hydration for the hexagon with the opposing charge scheme. This material is available free of charge via the Internet at http://pubs.acs.org.
References and Notes
- 1.Gilson MK, Honig BH. Proteins: Struct, Funct, Genet. 1988;3:32–52. doi: 10.1002/prot.340030104. [DOI] [PubMed] [Google Scholar]
- 2.Still WC, Tempczyk A, Hawley RC, Hendrickson T. J Am Chem Soc. 2000;90:6127–6129. [Google Scholar]
- 3.Latimer WM, Pitzer KS, Slansky CM. J Chem Phys. 1939;7:108–111. [Google Scholar]
- 4.Rashin AA, Honig B. J Phys Chem. 1985;89:5588–5593. [Google Scholar]
- 5.Roux B, Yu HA, Karplus M. J Phys Chem. 1990;94:4683–4688. [Google Scholar]
- 6.Hummer G, Pratt LR, Garcia AE. J Phys Chem. 1996;100:1206–1215. [Google Scholar]
- 7.Lynden-Bell RM, Rasaiah JC. J Chem Phys. 1997;107:1981–1991. [Google Scholar]
- 8.Koneshan S, Rasaiah JC, Lynden-Bell RM, Lee SH. J Phys Chem B. 1998;102:4193–4204. [Google Scholar]
- 9.Ashbaugh HS. J Phys Chem B. 2000;104:7235–7238. [Google Scholar]
- 10.Schurhammer R, Wipff G. New J Chem. 1999;23:381–391. [Google Scholar]
- 11.Schurhammer R, Engler E, Wipff G. J Phys Chem B. 2001;105:10700–10708. [Google Scholar]
- 12.Rajamani S, Ghosh T, Garde S. J Chem Phys. 2004;120:4457–4465. doi: 10.1063/1.1644536. [DOI] [PubMed] [Google Scholar]
- 13.Chorny I, Dill KA, Jacobson MP. J Phys Chem B. 2005;109:24056–24060. doi: 10.1021/jp055043m. [DOI] [PubMed] [Google Scholar]
- 14.Jorgensen WL, Chandrasekhar J, Madura JD, Impey RW, Klein ML. J Chem Phys. 1983;79:926–935. [Google Scholar]
- 15.Horn HW, Swope WC, Pitera JW, Madura JD, Dick TJ, Hura GL, Head-Gordon T. J Chem Phys. 2004;120:9665–9678. doi: 10.1063/1.1683075. [DOI] [PubMed] [Google Scholar]
- 16.Rick SW. J Chem Phys. 2004;120:6085–6093. doi: 10.1063/1.1652434. [DOI] [PubMed] [Google Scholar]
- 17.Bennett CH. J Comput Phys. 1976;22:245–268. [Google Scholar]
- 18.Shirts MR, Bair E, Hooker G, Pande VS. Phys Rev Lett. 2003;91(14):140601. doi: 10.1103/PhysRevLett.91.140601. [DOI] [PubMed] [Google Scholar]
- 19.Mobley DL, Dumont È, Chodera JD, Dill KA. J Phys Chem B. 2007;111:2242–2254. doi: 10.1021/jp0667442. [DOI] [PubMed] [Google Scholar]
- 20.Lindahl E, Hess B, van der Spoel D. J Mol Mod. 2001;7:306–317. [Google Scholar]
- 21.van der Spoel D, Lindahl E, Hess B, Groenhof G, Mark AE, Berendsen HJC. J Comput Chem. 2005;26:1701–1718. doi: 10.1002/jcc.20291. [DOI] [PubMed] [Google Scholar]
- 22.Ryckaert JP, Ciccotti GH, Berendsen JC. J Comput Phys. 1977;23:327–341. [Google Scholar]
- 23.Wang J, Wolf RM, Caldwell JW, Kollman PA, Case DA. J Comput Chem. 2004;25:1157–1174. doi: 10.1002/jcc.20035. [DOI] [PubMed] [Google Scholar]
- 24.Jakalian A, Bush BL, Jack DB, Bayly CI. J Comput Chem. 2000;21:132–146. [Google Scholar]
- 25.Jakalian A, Jack DB, Bayly CI. J Comput Chem. 2002;23:1623–1641. doi: 10.1002/jcc.10128. [DOI] [PubMed] [Google Scholar]
- 26.Hess B, van der Vegt NFA. J Phys Chem B. 2006;110:17616–17626. doi: 10.1021/jp0641029. [DOI] [PubMed] [Google Scholar]
- 27.Mahoney MW, Jorgensen WL. J Chem Phys. 2000;112:8910–8922. [Google Scholar]
- 28.Ben-Naim A, Mazo RM. J Phys Chem. 1993;97:10829–10834. [Google Scholar]
- 29.Mobley DL, Chodera JD, Dill KA. J Phys Chem B. 2008;112:938–946. doi: 10.1021/jp0764384. [DOI] [PMC free article] [PubMed] [Google Scholar]
- 30.Tucker SW. J Chem Phys. 1970;52:2545–2547. [Google Scholar]
- 31.Hassell WF, Walker S. Trans Faraday Soc. 1966;62:2695–2703. [Google Scholar]
- 32.Rizzo RC, Aynechi T, Case DA, Kuntz ID. J Chem Theory Comput. 2006;2:128–139. doi: 10.1021/ct050097l. [DOI] [PubMed] [Google Scholar]
- 33.We initially tried adjusting radii for the hexagon case, but we could find no solution that would adequately capture the asymmetry by adjusting only radii for positive and negative atoms. This is probably because the atoms are spaced closely enough that if some of the radii are reduced to allow closer approach of solvent and capture the asymmetry the adjoining neutral atoms limit how close solvent can approach and ultimately limit how much can be achieved by this adjustment.
Associated Data
This section collects any data citations, data availability statements, or supplementary materials included in this article.


