

Abstract
Background
Despite the high prevalence and morbidity of minor and subsyndromal depression in primary care elderly people, there are few data to identify those at highest risk of poor outcomes. The goal of this observational cohort study was to characterize the one-year outcomes of minor and subsyndromal depression, examining the predictive strength of a range of putative risks including clinical, functional and psychosocial variables.
Methods
Patients aged ≥ 65 years were recruited from primary care medicine and family medicine practices. Of 750 enrollees, 484 (64.5%) completed baseline and one-year follow-up assessments of depression diagnosis (major depression vs. minor and subsyndromal depression vs. non-depressed) by the Structured Clinical Interview for DSM-IV, depressive symptom severity (Hamilton Rating Scale for Depression), and validated measures of other predictors.
Results
Patients with baseline minor and subsyndromal depression were more depressed than the non-depressed group at follow-up: They had a 7.0-fold (95% CI 4.5–10.8) risk of developing major depression, and a one-year adjusted Hamilton Depression Score of 11.0 (95% CI 10.2–11.8) compared with 7.8 (95% CI 7.1–8.5) for the non-depressed group; these outcomes were less severe than those of the major depression group. Independent predictors of depression outcomes included race, psychiatric and physical functioning, and social support.
Conclusions
Minor and subsyndromal depression are likely to persist, and pose an elevated risk of worsening over one year. Clinicians and preventive interventions researchers should focus on modifiable risks, such as psychiatric functioning or social support, in elders suffering clinically significant depressive symptoms.
Keywords: depression, geriatric, primary care, outcomes
Introduction
The enormous societal burden of late-life depression includes symptomatic distress, functional disability and excess mortality (Charney et al., 2003), which largely presents to primary care providers (Gallo and Coyne, 2000). However, the majority of seniors with clinically significant depressive symptoms do not meet standard diagnostic criteria for major depression or dysthymic disorder (Lyness et al., 2007). Unlike major depression, so-called minor and subsyndromal depressive conditions have a relatively small evidence base regarding treatments; extant data suggest that available therapies have modest effect sizes (Unutzer et al., 2002; Bruce et al., 2004; Pinquart et al., 2006).
Given this, and also noting that the naturalistic outcomes of depression are heterogeneous (Lyness et al., 2006), identification of specific predictors of depression outcomes in the elderly is important to help clinicians focus treatment efforts on those patients at highest risk of poor outcomes. Such work also could identify potentially modifiable risk markers to inform the development of innovative approaches to therapies including preventive interventions (Schoevers et al., 2006). Yet prior studies of outcome predictors have been limited by sample biases from psychiatric or other medical subspecialty settings, or by the sole use of self-report assessments (Harris et al., 2006). As well, most studies, particularly those in primary care, have tested the role of only a few select predictor domains. Thus, while the collective literature supports the predictive role of demographic, psychopathological, medical, functional, psychological and interpersonal factors, it remains unclear which of these domains is most operant in the real-world context where all exist simultaneously. One recent report found that greater medical burden and poorer self-rated health and subjective social support were significant independent predictors of one-year depression outcomes (Lyness et al., 2006). However, this study did not test the role of personality, other psychiatric comorbidities, or physical disability disaggregated from psychiatrically impaired functioning. The generalizability of these results also may have been limited by relying on subjects from the “Usual Care” control group of a randomized controlled trial.
Accordingly, the current data are reported from a well-characterized cohort of older persons recruited from primary care practices. The study goal was to describe their naturalistic depressive outcomes at one year, hypothesizing that subjects with minor and subsyndromal depression at study intake would have outcomes intermediate between those with major depression and those initially not depressed. The influences of a wide range of clinically important predictor variables (Cole and Dendukuri, 2003) on depression outcomes also were examined; prior published longitudinal studies using this dataset tested more focal hypotheses with only a more limited set of predictors (Cui et al., 2007; 2008)
Methods
Procedures and subjects
As described previously (Lyness et al., 2007), all patients aged ≥65 years who presented for care on selected days at internal medicine and family medicine primary care offices were approached for enrollment, including private practice and hospital-based clinic settings. After obtaining written informed consent, using procedures approved by the University of Rochester Research Subjects Review Board, subjects underwent face-to-face intake interviews by a trained rater in their homes or at the university research offices. These interviews were completed with 50.1% of potentially eligible subjects, a completion rate consistent with previous work using intensive, rigorous assessment methodologies in primary care settings (Schulberg et al., 1998); enrolled subjects did not significantly differ from non-enrolled patients in age, gender, or the 15-item Geriatric Depression Scale score (Sheikh and Yesavage, 1986). All study measures were repeated during similar face-to-face follow-up interviews completed at one year (between 11 and 14 months after the intake assessment).
Measures
Interviews included the Structured Clinical Interview for DSM-IV (SCID), a validated and widely used method for establishing psychiatric diagnoses in research contexts (Spitzer et al., 1994), and the 24-item version of the Hamilton Rating Scale for Depression (Ham-D), assessing depressive symptom severity (Williams, 1988). The SCID and the Ham-D were completed based on the interview and primary care chart review, with the one-year interview also informed by a telephone interview six months after intake. Inter-rater reliability was high, e.g. an intra-class correlation coefficient of 0.93 for the Ham-D (based on six raters and five subjects), and κ coefficients for the diagnoses of major and minor depression ranging from 0.66 to 0.86 (P < 0.001, based on six raters and three subjects).
Depression diagnoses based on SCID criteria were assigned at a consensus conference of study investigators and raters. The groups were defined as: (1) Major Depression (Maj Dep): meeting full criteria for current major depressive disorder; (2) Minor/Subsyndromal Depression (Min/SSD): either meeting full criteria for current minor depressive disorder, as defined in the appendix to DSM-IV, or DSM-IV dysthymic disorder, or subsyndromal depression, the latter defined as a minimum of two depressive symptoms present at either the ‘subthreshold’ or ‘threshold’ level by SCID criteria, with at least one symptom being either depressed mood or decreased interests / pleasure, yet not meeting criteria for major or minor depression; and (3) Non-Depressed (Non-Dep): all others, i.e. those not meeting criteria for major, minor or subsyndromal depression, or for dysthymic disorder. The definition of subsyndromal depression(SSD), used in studies of elderly patients in primary care (Lyness et al., 2006) and homecare settings (McAvay et al., 2004), has been shown to identify a symptomatically and functionally impaired group in this cohort (Lyness et al., 2007). Analyses also examined the predictive role of a prior history of major or minor depression (as determined by the SCID), and explored the outcomes of the minor depression and SSD subgroups separately.
Other psychiatric diagnoses from the SCID were considered as outcome predictors. These included the presence of any current anxiety or alcohol use disorder. Dementia was diagnosed according to DSM-IV criteria by an experienced geriatric psychiatrist (JML) based on all information available from the research interview, cognitive measures (e.g. Mini-mental State Examination; MMSE; Folstein et al., 1975), and the primary care chart. Antidepressant treatment was measured by the Composite Antidepressant Scale (Alexopoulos et al., 1996), although interpretation of treatment as a predictor variable must recognize that interventions are often associated with poorer outcomes in naturalistically followed cohorts, presumably due to confounding by indication (i.e. the most ill patients are more likely to receive treatment).
Medical illness burden was assessed by the Cumulative Illness Rating Scale (CIRS; Linn et al., 1968), a validated measure of the severity of pathology in each organ system, completed by a physician-investigator (JML). Four measures of functional status were used. Basic activities of daily living were assessed by the Instrumental Activities of Daily Living (IADL) and Physical Self-Maintenance Scales (PSMS) (Lawton and Brody, 1969). The IADL assessed higher-order ADLs such as shopping, driving and meal preparation, while the PSMS assessed self-care ADLs such as bathing, grooming and feeding oneself. Overall level of functioning related to psychiatric factors (i.e. on a continuum of mental health – illness) was rated on the Global Assessment of Functioning (GAF) from DSM-IV, and related to physical impairments on the Karnofsky Performance Status Scale (KPSS) (Karnofsky and Burchenal, 1949).
A modified version of the Louisville Older Persons Event Survey (LOPES; Murrell et al., 1984) was used to rate the presence and severity of any stressful life event (other than medical illness in oneself) in the past six months. The Duke Social Support Inventory assessed three dimensions of social support: social interaction, perceived social support and instrumental support (Landerman et al., 1989). Personality traits were assessed with the NEO Five Factor Inventory (NEO-FFI) (Costa and McCrae, 1992), a validated self-report instrument yielding scores on trait neuroticism, extraversion, openness to experience, agreeableness, and conscientiousness. The NEO-FFI self-report forms were left with the subjects to be completed and returned using the self-addressed stamped envelopes.
Analyses
Multivariate regression analyses determined the independent associations of predictors with outcomes. The naturalistic course of depression was examined by linear regression models for one-year depressive symptom severity (Ham-D), and proportional odds (i.e. ordinal logistic) models for one-year depression diagnosis (Non-Dep vs. Min/SSD vs. Maj Dep), controlling for demographics (age, gender, years of education) and medical burden (CIRS score). We chose these covariates as fundamental factors that might differ by baseline depression status and potentially predict one-year outcomes, paralleling prior work using the PROSPECT dataset (Lyness et al., 2006). The proportional odds models yield odds ratios reflecting the probability of moving into a worse category of depression (i.e. from Non-Dep to Min/SSD or Maj Dep, or from Non-Dep or Min/SSD to Maj Dep). To test the putative predictors of one-year depressive outcomes, clinical considerations informed a hypothesis-driven series of regression analyses, with the variables entered as blocks in the following steps: (1) demographics (including race), previous history of major or minor depression, any current anxiety, alcohol or dementia disorders, baseline depression (Ham-D score or diagnosis depending on the outcome variable); (2) medical and functional variables (CIRS, IADL, PSMS, KPSS, and GAF scores); (3) psychosocial variables, e.g. social support, life events; and (4) antidepressant treatment (Composite Antidepressant Score). Paralleling prior work (Lyness et al., 2006), variables significant at P < 0.20 at each step were manually retained for the next step to allow for suppression effects. In the subset of patients with personality data, steps three and four were repeated additionally entering standardized scores for the five NEO-FFI traits. Significance level was set at P < 0.05 (2-tailed). Sensitivity analyses examined results without the personality predictors in the subsample of patients who had returned personality data, to test whether findings were due to the inclusion of personality predictors or were artifacts of restricting analysis to this subsample; NEO-FFI results indeed were largely attributable to sample restriction and so are only reported briefly below. As an additional sensitivity analysis, all predictors that were significant in univariate analyses at P < 0.20 were entered simultaneously into a multivariate model. It is important to note that we included the maximum number of subjects with complete data for the measures needed for a given analysis, consistent with usual epidemiological approaches to multivariate analyses.
Results
Of 750 subjects completing the study intake, 17 had died and 484 (64.5% of the initial group) remained in the study at one-year follow-up. (Note that while all 484 provided one-year Ham-D scores, 482 had one-year SCID depression diagnosis data.) Of those completing one-year follow-up, 299 (61.8%) were female and 455 (94.0%) were white. Four hundred and thirty (88.8%) had been recruited from general internal medicine practices, 26 (5.4%) from geriatric primary care, and 28 (5.8%) from family medicine practices. Other descriptive data at intake for those completing one-year follow-up are provided in Table 1. Compared with those not completing follow-ups, those included in the present analyses did not differ significantly in age, gender, education, depression diagnosis, Ham-D score, or CIRS score, but were more likely to be white (OR [95% CI] 2.5 [1.4–4.5], χ2 = 8.8, df = 1, P = 0.003). Baseline NEO personality forms were received from 368 subjects (76.0% of those completing one-year follow-ups); NEO completers were more likely to be white (OR [95% CI] 3.0 [1.2–7.3], χ2 = 5.6, df = 1, P = 0.018) but did not differ in age, gender, education, depression diagnosis, Ham-D, or CIRS scores.
Table 1. Descriptive data by depression diagnosis group at study intake. Values are shown as N, mean (SD), range unless otherwise specified.
| Variable | Major Depression (N = 23) | Minor/Subsyndromal Depression (N = 173) | Non-Depressed (N = 286) |
|---|---|---|---|
| Age (years) | 75.2 (5.8), 66–86 | 74.9 (6.2), 65–91 | 75.5 (6.9), 65–97 |
| Gender (female) | N = 15 (65.2%) | N = 119 (68.8%) | N = 164 (57.3%) |
| Education (years) | 13.3 (2.5), 8–17 | 14.0 (2.7), 0–17 | 14.4 (2.4), 7–17 |
| Ham-D | 21.5 (5.5), 9–32 | 11.6 (5.4), 1–27 | 5.7 (3.6), 0–22 |
| GAF | 51.2 (7.4), 40–60 | 67.6 (10.4), 42–87 | 80.1 (11.9), 40–100 |
| MMSE | 27.4 (2.3), 20–30 | 27.7 (2.2), 17–30 | 27.8 (2.5), 11–30 |
| CIRS | 10.7 (3.3), 6–17 | 7.7 (2.9), 1–16 | 7.0 (2.7), 1–16 |
| KPSS | 69.1 (14.6), 40–90 | 77.2 (12.0), 37–94 | 80.6 (12.3), 36–94 |
| IADL | 5.0 (5.5), 0–17 | 1.8 (3.3), 0–22 | 1.6 (3.6), 0–22 |
| PSMS | 3.3 (2.8), 0–11 | 1.8 (2.0), 0–9 | 1.2 (1.9), 0–14 |
| LOPES presence of stressful event | N = 19 (82.6%) | N = 140 (82.5% of 170 with LOPES data) | N = 177, 63.3% of 280 with LOPES data |
| DSSI-social interaction | 7.7 (1.7), 4–11 | 8.7 (1.5), 4–12 | 9.2 (1.6), 5–12 |
| DSSI-perceived social support | 17.5 (2.9), 7–21 | 19.0 (2.6), 8–21 | 19.9 (1.8), 10–21 |
| DSSI-instrumental support | 15.5 (2.5), 12–20 | 15.4 (2.4), 12–24 | 14.8 (2.3), 12–23 |
| Race (other than white) | N = 0 (0%) | N = 10 (5.8%) | N = 15 (5.3%) |
| CAD score | 1.8 (1.7), 0–4 | 0.9 (1.4), 0–4 | 0.3 (0.9), 0–4 |
| Past history major depression | N = 10 (43%) | N = 51 (29.5%) | N = 47 (16.4%) |
| Past history minor depression | N = 3 (13%) | N = 46 (26.6%) | N = 70 (24.5%) |
| Dementia | N = 1 (4.4%) | N = 5 (2.9%) | N = 12 (4.2%) |
| Active anxiety disorder | N = 6 (26.1%) | N = 19 (11.0%) | N = 6 (2.1%) |
| Active alcohol use disorder | N = 1 (4.4%) | N = 7 (35.9%) | N = 7 (2.5%) |
| Neuroticism | 59.1 (10.6), 45–75 | 49.6 (9.6), 28–72 | 41.2 (8.0), 25–67 |
| Extraversion | 39.2 (12.4), 25–61 | 48.9 (9.4), 25–69 | 53.6 (10.0), 25–75 |
| Openness | 51.1 (13.0), 31–70 | 50.0 (10.0), 25–74 | 49.4 (9.7), 26–75 |
| Agreeableness | 46.5 (11.3), 25–60 | 54.0 (9.5), 34–75 | 55.6 (9.0), 30–75 |
| Conscientiousness | 42.7 (12.1), 25–59 | 47.0 (10.3), 25–73 | 50.7 (9.3), 25–73 |
Ham-D: Hamilton Depression Rating Scale (higher score = greater depressive symptom severity).
GAF: Global Assessment of Functioning (higher score = better psychiatric functioning).
MMSE: Mini-mental State Examination (higher score = better cognitive functioning).
CIRS: Cumulative Illness Rating Scale (higher score = greater medical illness burden).
KPSS: Karnofsky Performance Status Scale (higher score = better physical functioning).
IADL: Instrumental Activities of Daily Living (higher score = poorer functioning with instrumental activities of daily living).
PSMS: Physical Self-Maintenance Scale (higher score = poorer functioning with physical self-care tasks).
LOPES: Louisville Older Persons Event Survey (presence or absence of stressful life event).
DSSI: Duke Social Support Inventory (higher score = greater social interaction, better perceived social support, or less instrumental support).
CAD: Composite Antidepressant score (higher score = higher antidepressant dosage).
Personality traits from NEO Five Factor Inventory, in T-scores according to national norms (M = 50, SD = 10).
Depression outcomes by initial depression diagnosis
Table 2 shows a bivariate cross-tabulation of depression diagnoses at study intake and one-year. Multivariate proportional odds models controlling for age, gender, education, and CIRS score revealed that baseline depression diagnosis as a whole was a significant predictor of follow-up diagnosis (χ2 = 99.9, df = 2, P < 0.001). At follow-up the Min/SSD group was more likely than the non-depressed group to meet diagnostic criteria for Min/SSD or major depression (χ2 = 77.5, df = 1, P < 0.001), although their outcomes were better than the group with major depression at baseline (χ2 = 13.0, df = 1, P < 0.001). Controlling for baseline age, gender, education, and CIRS score, patients in the Min/SSD group were 7 times more likely (95% CI 4.5–10.8; χ2 = 77.4, df = 1, P < 0.001) than the non-depressed group to develop major depression, while patients in the major depression group were 50.3 (95% CI 16.6–152.1; χ2 = 48.0, df = 1, P < 0.001) times more likely than the non-depressed group to have major depression one year later. However, the proportion of Min/SSD subjects developing major depression was fairly low, and many improved to the non-depressed group at one year. Secondary analyses examining differences between minor and SSD subgroups showed that the minor depression subgroup was 12.6 times more likely (95% CI 5.5–29.1; χ2 = 60.5, df = 1, P < 0.001) than the non-depressed group to move into major depression at one year, while the SSD subgroup was 6.1 times more likely (95% CI 3.9–9.6; χ2 = 35.2, df = 1, P < 0.001) than the non-depressed group to move into major depression at one year; a statistically non-significant difference between the two levels of depression (χ2 = 2.8, df = 1, P = 0.10).
Table 2. Depression diagnosis at intake and one-year follow-up.
| Depression Diagnosis At One-Year | |||
|---|---|---|---|
| Depression Diagnosis At Intake | Major Depression | Minor/Subsyndromal Depression | Non-Depressed |
| Major depression (N = 23) | 7 | 15 | 1 |
| Minor/subsyndromal depression (N = 173) | 8 | 121 | 44 |
| Non-depressed (N = 286) | 1 | 84 | 201 |
| Total (N = 482) | 16 | 220 | 246 |
Pearson χ2 = 153.1, df = 4, P < 0.001.
NB. Two subjects who completed other one-year follow-up measures did not complete the SCID and so lacked depression diagnosis at one-year.
Similarly, as shown in Figure 1, the baseline non-depressed, Min/SSD and major depression groups also showed a pattern of graded severity with respect to one-year Ham-D scores, adjusted for baseline age, gender, education and CIRS score. Secondary analyses, not shown in the figure, revealed no statistically significant differences in adjusted one-year Ham-D scores between the SSD and Minor Depression subgroups (adjusted one-year Ham-D scores (SE) 12.3 (0.9) vs. 10.6 (0.5), P = 0.09).
Figure 1.
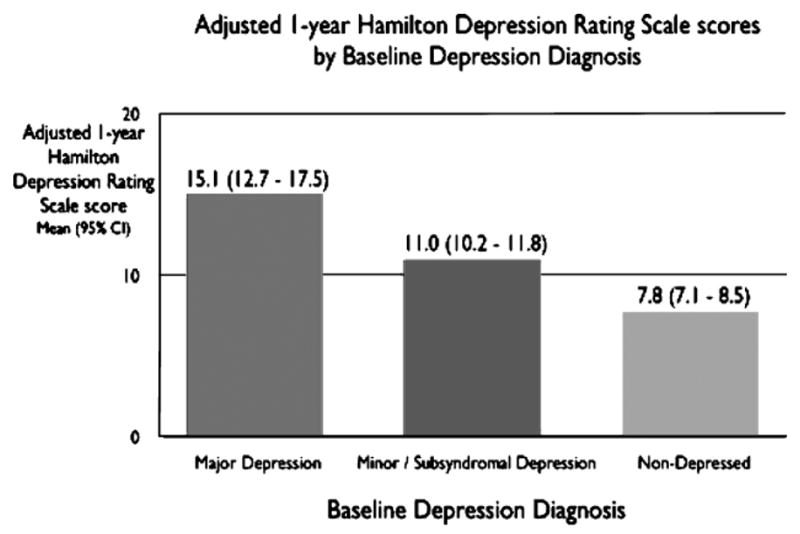
Adjusted one-year Hamilton Depression Rating Scale scores by baseline depression diagnosis. One-year scores adjusting for age, gender, baseline Cumulative Illness Rating Scale score pair-wise comparisons: Minor/subsyndromal depression vs. non-depressed F = 32.6, df = 1,474, P < 0.001. Minor/subsyndromal depression vs. major depression F = 10.6, df = 1,474, P = 0.001.
Predictors of depression outcomes
The final multivariate models for all predictors (for the entire sample, thus excluding personality) are shown in Table 3. The significant independent predictors of depression diagnosis at one year were white race and baseline depression diagnosis, GAF score, social interaction, and perceived social support. Results were unchanged when minor depression and SSD were treated as separate subgroups. The independent predictors of one-year Ham-D score were baseline scores on the Ham-D, physical functioning (KPSS), psychiatric functioning (GAF), perceived social support, and instrumental social support. In all final models, the direction of the effect was such that higher baseline symptoms and poorer functioning or social support predicted poorer depressive outcome.
Table 3. Final multivariate models predicting depression outcome.
| Variable (At Study Intake) | Odds Ratio (95% Confidence Interval) | χ2 | P Value |
|---|---|---|---|
| a. Predicting one-year depression diagnosis (major depression vs. minor/subsyndromal depression vs. non-depressed) | |||
| White race | 4.3 (1.4–13.4) | 6.3 | 0.012 |
| Major depression | 17.8 (5.3–60.0) | 21.5 | <0.001 |
| Minor/subsyndromal depression | 4.2 (2.6–6.8) | 33.4 | <0.001 |
| GAF | 0.9 (0.9–0.96) | 28.1 | <0.001 |
| DSSI-social interaction | 1.2 (1.02–1.4) | 5.3 | 0.022 |
| DSSI-perceived social support | 0.9 (0.8–0.98) | 4.6 | 0.032 |
| DSSI-instrumental support | 0.9 (0.8–0.99) | 4.0 | 0.045 |
| Variable (At Study Intake) | Coefficient (95% Confidence Interval) | t | P Value |
| b. Predicting one-year depressive symptom severity (Hamilton Depression Rating Scale score) | |||
| Hamilton Depression Rating scale | 0.5 (0.4 – 0.6) | 9.7 | <0.001 |
| Past history minor depression | 0.7 (−0.3 – 1.7) | 1.4 | 0.18 |
| KPSS | −0.06 (−0.1 – −0.02) | −3.1 | 0.002 |
| GAF | −0.06 (−0.1 – −0.01) | −2.3 | 0.023 |
| DSSI-social interaction | 0.2 (−0.07 – 0.5) | 1.4 | 0.16 |
| DSSI-perceived social support | −0.3 (−0.6 – −0.1) | −3.0 | 0.003 |
| DSSI-instrumental support | −0.3 (−0.5 – −0.08) | −2.8 | 0.005 |
P values obtained from t statistic, df = 1.
KPSS: Karnofsky Performance Status Scale.
GAF: Global Assessment of Functioning.
DSSI: Duke Social Support Inventory.
P values obtained from Wald χ2, df = 1.
The addition of the NEO-FFI personality traits to the prediction models yielded largely similar findings, with differences from the above-described models mainly attributable to sample restriction among those who completed and returned the NEO-FFI questionnaires. In the sensitivity analysis that simultaneously entered all variables significant at P < 0.20 in bivariate comparisons, neuroticism was marginally significant in its association with one-year depression diagnosis (for each +1 SD in neuroticism, OR (95% CI) 1.5 (1.0–2.2); χ2 = 3.8, df = 1, P = 0.05).
Discussion
As hypothesized, minor and subsyndromal depression had a one-year outcome intermediate between that of major depression and the non-depressed group. These results demonstrate the clinical significance of so-called “lesser” depressive conditions among older primary care patients, posing substantially elevated risk of persistent depressive symptoms and worsening into major depression (albeit with a relatively low absolute rate of the latter). At the same time, outcomes are not universally poor, strongly suggesting that therapeutic intervention should be targeted at those at greatest risk. These findings extend prior data obtained from the Usual Care arm of the “PROSPECT” clinical trial (Lyness et al., 2006) by examining these issues in a naturalistically followed study cohort. (Note that the slightly higher baseline Ham-D scores for the major depression and minor/subsyndromal depression groups in our cohort, compared to those in the PROSPECT Usual Care group, may reflect the greater representativeness of our study group compared to those enrolled in a randomized controlled trial, although we cannot exclude the possibility that rater variability between our study and PROSPECT accounts for the differences.)
Targeting interventions for patients with minor and subsyndromal depression may prove useful as both indicated- and relapse-prevention strategies. A recent indicated-prevention study – for example, examining incident major depression among those with subsyndromal symptoms – found that the number needed to treat was 5.8 (Schoevers et al., 2006). Collaborative care interventions in primary care may be cost-effective for this purpose (Simon et al., 2002).
Still, it remains to be determined whether the evidence-based psychosocial and medication treatments shown to be efficacious for major depression have a role in minor and subsyndromal depression. Psychosocial treatments may be more helpful than medications for those elders with less severe forms of depression (Ciechanowski et al., 2004; Pinquart et al., 2006). However, current treatments leave too many patients suffering persistent symptoms (Unutzer et al., 2002; Bruce et al., 2004).
Our work further extended findings from the PROSPECT study (Lyness et al., 2006) by examining a wider range of potential predictors of outcome. Taking this broader view, it is striking that various dimensions of social support have emerged consistently as independent predictors of depression outcome in older primary care patients (Travis et al., 2004; Harris et al., 2006; Smit et al., 2006), while personality and life events have not. Overall medical burden as measured by the CIRS, while strongly associated with depression outcome in bivariate analyses, did not retain an independent association in the final multivariate models, a finding that may be explainable by the inclusion of several functional status measures, particularly the KPSS, a physician-rated measure of physical disability rarely used in previous studies. As well, it is possible that the effects of medical burden or personality on outcome may be more powerful over a longer follow-up period or with different outcome measures, as exemplified by the independent association of medical burden with two-year depression trajectories (defined by cluster analysis) in a subset of the present sample (Cui et al., 2008).
Study limitations must be acknowledged, including the possibility of sample bias introduced by the enrollment rate of 50.1% and one-year follow-up completion rate of 64.5%; it is possible, for example, that subjects with greater depressive symptoms would be less likely to enroll or follow-up. However, these rates are comparable to prior work using similarly rigorous, time-intensive assessment methodologies, and comparative statistics suggest that the biases introduced in this cohort were few. The role of specific types of life stressors (other than medical burden) was not examined, nor were health behaviors such as alcohol intake or physical activity level. The study group was predominantly white and relatively well educated for an older cohort, potentially limiting generalizability to other populations. Small subgroup sizes precluded examination of differences among most racial and ethnic minority subgroups, although white race was independently associated with depression outcome in this cohort; interpretation of this finding, however, must recognize the potential biases introduced by the greater retention of whites during the follow-up period. A cross-sectional study found that whites were more likely than blacks to be diagnosed with depression (Gallo et al., 2005); it is not known whether such findings reflect race differences in symptom detection and reporting or more substantive differences in depression course. Future work also might examine fruitfully whether specific depressive symptoms are more highly predictive of poor outcomes than other symptoms or than broader categories such as minor/subsyndromal depression.
In summary, clinicians should recognize that minor and subsyndromal depression are likely to persist and pose substantially elevated risk of worsening over time, and that poorer functional status or social support confer additional risk of poor outcome. Interventions and prevention research might fruitfully focus on modifiable risks, such as improving psychiatric functioning or social support in elders suffering from clinically significant depressive symptoms.
Acknowledgments
This work was supported by NIMH grants R01 MH61429, K24 MH71509, K24 MH072712, and T32 MH073452 and a preliminary version of this paper was presented in part at the International College of Geriatric Psychoneuropharmacology, Basel, Switzerland, 16 October 2004. The authors thank the patients, staff and providers of the following primary care practices: University of Rochester Medical Center, Department of Medicine; Pulsifer Medical; East Ridge Family Medicine; Highland Family Medicine; Olsan Medical; Clinton Crossings Medical; Panorama Internal Medicine; Highland Geriatric Medicine; and Culver Medical. The authors thank the following for technical assistance: Karen Gibson, Constance Bowen, James Evinger, Cameron Gardner, Iwona Juskiewicz, Ayesha Khan, Michael New, Andra Niculescu, Jean Sauvain, Jill Scheltz and Judy Woodhams.
Footnotes
Conflict of interest: None.
References
- Alexopoulos GS, et al. Recovery in geriatric depression. Archives of General Psychiatry. 1996;53:305–312. doi: 10.1001/archpsyc.1996.01830040039008. [DOI] [PubMed] [Google Scholar]
- Bruce ML, et al. Reducing suicidal ideation and depressive symptoms in depressed older primary care patients: a randomized controlled trial. JAMA. 2004;291:1081–1091. doi: 10.1001/jama.291.9.1081. [DOI] [PubMed] [Google Scholar]
- Charney DS, et al. Depression and Bipolar Support Alliance consensus statement on the unmet needs in diagnosis and treatment of mood disorders in late life. Archives of General Psychiatry. 2003;60:664–672. doi: 10.1001/archpsyc.60.7.664. [DOI] [PubMed] [Google Scholar]
- Ciechanowski P, et al. Community-integrated home-based depression treatment in older adults: a randomized controlled trial. JAMA. 2004;291:1569–1577. doi: 10.1001/jama.291.13.1569. [DOI] [PubMed] [Google Scholar]
- Cole MG, Dendukuri N. Risk factors for depression among elderly community subjects: a systematic review and meta-analysis. American Journal of Psychiatry. 2003;160:1147–1156. doi: 10.1176/appi.ajp.160.6.1147. [DOI] [PubMed] [Google Scholar]
- Costa PT, McCrae RR. The NEO Personality Inventory: Revised Professional Manual. Odessa, FL: Psychological Assessment Resources; 1992. [Google Scholar]
- Cui X, Lyness JM, Tu X, King DA, Caine ED. Does depression precede or follow executive dysfunction? Outcomes in older primary care patients. American Journal of Psychiatry. 2007;164:1221–1228. doi: 10.1176/appi.ajp.2007.06040690. [DOI] [PubMed] [Google Scholar]
- Cui X, Lyness JM, Tang W, Tu X, Conwell Y. Outcomes and predictors of late-life depression trajectories in older primary care patients. American Journal of Geriatric Psychiatry. 2008;16:406–415. doi: 10.1097/JGP.0b013e3181693264. [DOI] [PubMed] [Google Scholar]
- Folstein MF, Folstein SE, McHugh PR. “Mini-mental state”. A practical method for grading the cognitive state of patients for the clinician. Journal of Psychiatric Research. 1975;12:189–198. doi: 10.1016/0022-3956(75)90026-6. [DOI] [PubMed] [Google Scholar]
- Gallo JJ, Coyne JC. The challenge of depression in late life: bridging science and service in primary care. JAMA. 2000;284:1570–1572. doi: 10.1001/jama.284.12.1570. [DOI] [PubMed] [Google Scholar]
- Gallo JJ, Bogner HR, Morales KH, Ford DE. Patient ethnicity and the identification and active management of depression in late life. Archives of Internal Medicine. 2005;165:1962–1968. doi: 10.1001/archinte.165.17.1962. [DOI] [PMC free article] [PubMed] [Google Scholar]
- Harris T, Cook DG, Victor C, DeWilde S, Beighton C. Onset and persistence of depression in older people–results from a 2-year community follow-up study. Age and Ageing. 2006;35:25–32. doi: 10.1093/ageing/afi216. [DOI] [PubMed] [Google Scholar]
- Karnofsky DA, Burchenal JH. The clinical evaluation of chemotherapeutic agents in cancer. In: MacLeod CM, editor. Evaluation of Chemotherapeutic Agents. New York: Columbia: 1949. [Google Scholar]
- Landerman R, George LK, Campbell RT, Blazer DG. Alternative models of the stress buffering hypothesis. American Journal of Community Psychology. 1989;17:625–642. doi: 10.1007/BF00922639. [DOI] [PubMed] [Google Scholar]
- Lawton MP, Brody EM. Assessment of older people. Self-maintaining and instrumental activities of daily living. Gerontologist. 1969;9:179–186. [PubMed] [Google Scholar]
- Linn BS, Linn MW, Gurel L. Cumulative illness rating scale. Journal of the American Geriatrics Society. 1968;16:622–626. doi: 10.1111/j.1532-5415.1968.tb02103.x. [DOI] [PubMed] [Google Scholar]
- Lyness JM, et al. Outcomes of minor and subsyndromal depression among elderly patients in primary care settings. Annals of Internal Medicine. 2006;144:496–504. doi: 10.7326/0003-4819-144-7-200604040-00008. [DOI] [PubMed] [Google Scholar]
- Lyness JM, et al. The clinical significance of subsyndromal depression in older primary care patients. American Journal of Geriatric Psychiatry. 2007 doi: 10.1097/01.JGP.0000235763.50230.83. [DOI] [PubMed] [Google Scholar]
- McAvay GJ, Bruce ML, Raue PJ, Brown EL. Depression in elderly homecare patients: patient versus informant reports. Psychological Medicine. 2004;34:1507–1517. doi: 10.1017/s0033291704002582. [DOI] [PubMed] [Google Scholar]
- Murrell SA, Norris FH, Hutchins GM. Distribution and desirability of life events in older adults: population and policy implications. Journal of Community Psychology. 1984;12:301–311. [Google Scholar]
- Pinquart M, Duberstein PR, Lyness JM. Treatments for later-life depressive conditions: a meta-analytic comparison of pharmacotherapy and psychotherapy. American Journal of Psychiatry. 2006;163:1493–1501. doi: 10.1176/ajp.2006.163.9.1493. [DOI] [PubMed] [Google Scholar]
- Schoevers RA, et al. Prevention of late-life depression in primary care: do we know where to begin? American Journal of Psychiatry. 2006;163:1611–1621. doi: 10.1176/ajp.2006.163.9.1611. [DOI] [PubMed] [Google Scholar]
- Schulberg HC, Mulsant B, Schulz R, Rollman BL, Houck PR, Reynolds CF. Characteristics and course of major depression in older primary care patients. International Journal of Psychiatry in Medicine. 1998;28:421–436. doi: 10.2190/G23R-NGGN-K1P1-MQ8N. [DOI] [PubMed] [Google Scholar]
- Sheikh JI, Yesavage JA. Geriatric Depression Scale (GDS): recent evidence and development of a shorter version. Clinical Gerontologist. 1986;5:165–173. [Google Scholar]
- Simon GE, et al. Cost-effectiveness of a program to prevent depression relapse in primary care. Medical Care. 2002;40:941–950. doi: 10.1097/00005650-200210000-00011. [DOI] [PubMed] [Google Scholar]
- Smit F, Ederveen A, Cuijpers P, Deeg D, Beekman A. Opportunities for cost-effective prevention of late-life depression: an epidemiological approach. Archives of General Psychiatry. 2006;63:290–296. doi: 10.1001/archpsyc.63.3.290. [DOI] [PubMed] [Google Scholar]
- Spitzer RL, Gibbon M, Williams JBW. Structured Clinical Interview For Axis I DSM-IV Disorders. Biometrics Research Department, New York State Psychiatric Institute; 1994. [Google Scholar]
- Travis LA, Lyness JM, Shields CG, King DA, Cox C. Social support, depression, and functional disability in older adult primary-care patients. American Journal of Geriatric Psychiatry. 2004;12:265–271. [PubMed] [Google Scholar]
- Unutzer J, et al. Collaborative care management of late-life depression in the primary care setting: a randomized controlled trial. JAMA. 2002;288:2836–2845. doi: 10.1001/jama.288.22.2836. [DOI] [PubMed] [Google Scholar]
- Williams JBW. A structured interview guide for the Hamilton depression rating scale. Archives of General Psychiatry. 1988;45:742–747. doi: 10.1001/archpsyc.1988.01800320058007. [DOI] [PubMed] [Google Scholar]