

Abstract
The purpose of this study was to investigate the kinetic behavior of 3′-deoxy-3′-18F-fluorothymidine (18F-FLT) before and early after initiation of chemoradiation therapy in patients with squamous cell head and neck cancer.
Methods
A total of 8 patients with head and neck cancer underwent 18F-FLT PET scans (7 patients at baseline and after 5 d [10 Gy] of radiation therapy given with concomitant chemotherapy and 1 patient only at baseline). Dynamic PET images were obtained with concurrent arterial or venous blood sampling. Kinetic parameters including the flux constant of 18F-FLT based on compartmental analysis (K-FLT), the Patlak influx constant (K-Patlak), and standardized uptake value (SUV) were calculated for the primary tumor and 18F-FLT–avid cervical lymph nodes for all scans.
Results
Mean pretreatment values of uptake for the primary tumor and cervical nodes were 0.075 ± 0.006 min−1, 0.042 ± 0.004 min−1, and 3.4 ± 0.5 (mean ± SD) for K-FLT, K-Patlak, and SUV, respectively. After 10 Gy of radiation therapy, these values were 0.040 ± 0.01 min−1, 0.018 ± 0.016 min−1, and 1.8 ± 1.1 for K-FLT, K-Patlak, and SUV, respectively. For all lesions seen on pretherapy and midtherapy scans, the correlation was 0.90 between K-FLT and K-Patlak, 0.91 between K-FLT and SUV, and 0.99 between K-Patlak and SUV.
Conclusion
The initial 18F-FLT uptake and change early after treatment in squamous head and neck tumors can be adequately characterized with SUV obtained at 45–60 min, which demonstrates excellent correlation with influx parameters obtained from compartmental and Patlak analyses.
Keywords: 3′-deoxy-3′-18F-fluorothymidine, 18F-FLT, head and neck cancer
The PET radiopharmaceutical 3′-deoxy-3′-18F-fluorothymidine (18F-FLT) is used for the imaging of DNA synthesis and cellular proliferation. After intravenous injection, the intracellular trapping of 18F-FLT occurs through phosphorylation by thymidine kinase 1. Thymidine kinase 1 is a key enzyme in DNA synthesis, with high enzymatic activity observed during the S phase of the cell cycle and low activity in the G0/G1 phase (1). Accumulation of 18F-FLT inside the cell is, therefore, considered an indirect marker of active cellular proliferation. Good correlation has been demonstrated between the Ki-67 score, an established marker of cellular proliferation, and 18F-FLT uptake in lung cancer, lymphoma, breast cancer, and gliomas (2–4).
18F-FLT uptake has been reported by several investigators in untreated squamous cell head and neck cancers (5–7); however, to our knowledge there are currently no reports on changes in 18F-FLT uptake early after initiation of radiotherapy in head and neck tumors. Furthermore, the image-analysis schemes in reports on untreated head and neck cancers were based on visual analysis and semiquantitative evaluation of 18F-FLT uptake as measured by the standardized uptake value (SUV) without kinetic analysis. SUV provides a snapshot of 18F-FLT uptake at a predefined time point. 18F-FLT uptake in the tumor, however, is a dynamic process that involves facilitated diffusion in and out of the cell and phosphorylation and dephosphorylation of 18F-FLT. Kinetic analysis of 18F-FLT uptake may provide important information on these processes. Parameters obtained through kinetic analysis, compared with SUVs, may show stronger correlation with cellular proliferation markers (8) and could, therefore, potentially better reflect treatment response, or these parameters may provide only similar (i.e., highly correlated) information, not warranting the additional technical efforts required for the full kinetic assessment. The objectives of this study were to evaluate the kinetic analysis of 18F-FLT uptake in head and neck tumors and assess the change in 18F-FLT uptake in the tumor early after initiation of chemoradiation therapy.
MATERIALS AND METHODS
Patients
A total of 8 patients (6 men, 2 women; mean age ± SD, 51.8 ± 8.1 y; range, 35–60 y) with histologically proven squamous cell head and neck cancer—stage III or IV—were enrolled in this study. All patients were scheduled to undergo definitive concurrent chemoradiation for treatment of squamous cell head and neck cancer. Seven patients underwent two 18F-FLT PET scans; the first scan was obtained at 0–10 d (mean, 3 d) before the initiation of therapy (pretherapy scan) and the second scan was obtained after 5 daily fractions of radiotherapy, which corresponded to 10 Gy of a prescribed dose of 70 Gy (midtherapy scan). Six of the 7 patients who underwent the pretherapy and midtherapy scans also had 1 cycle of concurrent chemotherapy before the midtherapy 18F-FLT PET scan. The chemotherapy regimen consisted of cisplatinum and paclitaxel in 4 patients, cisplatinum only in 1 patient, and carboplatinum and paclitaxel in 1 patient. Chemotherapy was administered between the second and the fourth days of radiation therapy. One patient declined the second 18F-FLT PET scan. This study was approved by the local Institutional Review Board, and each patient provided informed consent.
18F-FLT PET
18F-FLT was produced on the basis of the previously described method of Machulla et al. (9). All imaging was performed on an ECAT EXACT HR+ PET scanner (Siemens Medical Solutions USA, Inc.) operated in the 3-dimensional mode. Transmission imaging was performed before the injection of 18F-FLT. Each patient was administered 18F-FLT (2.59 MBq/kg [0.07 mCi/kg]; maximum dose, 185 MBq [5 mCi]) intravenously via an infusion pump for 2 min, followed by a 10-mL flush. Dynamic images were obtained over the primary tumor and the neck, initially at a rate of 1 min per frame × 5 frames for the first 6 patients and then expanded to 10 frames for the final 2 patients. Imaging then proceeded at a rate of 5 min per frame for the balance of the 60 min (i.e., 11 or 10 frames, respectively).
Concurrent with imaging, venous and arterial blood sampling was performed. Arterial samples were drawn before, after, and at the midpoints of the dynamic imaging intervals, specifically at 0, 0.5, 1.5, 2.5, 3.5, 4.5, 7.5, 12.5, 17.5, 22.5, 27.5, 32.5, 37.5, 42.5, 47.5, 52.5, 57.5, and 60 min after initiation of the 18F-FLT infusion. Venous samples were drawn at 3 (1 min after the end of the infusion), 5, 20, and 60 min after the initiation of the injection. Whole blood and plasma were assayed for total radioactivity. Venous samples were assayed for unchanged 18F-FLT and metabolites by high-performance liquid chromatography or Sep-Pak (Waters) methods, as described by Shields et al. (10). The fraction of unchanged 18F-FLT versus time in the venous samples was fit to a single exponential curve. This fitted curve was used to correct the arterial plasma values for the presence of metabolites.
Image Analysis
Dynamic images were iteratively reconstructed (2 iterations and 8 subsets; gaussian, 8.0 mm; zoom, 1.2). When needed, the dynamic image sequence was motion-corrected to the middle frame of the dynamic series. Time–activity curves were constructed for volumes of interest (VOIs) over the tumor and visualized 18F-FLT–avid nodes within the field of view using the PMOD Image Display and Analysis functions (PVIEW) (version 2.9; PMOD Technologies, Ltd.). VOIs were created by placing a bounding box around the tissue of interest on the pretherapy images and using a 50% maximum activity threshold. Mean and maximum voxel values within the VOI were examined. The midtherapy images were coregistered to the pretherapy images, and the same VOIs were applied to both datasets. Motion-correction and coregistration operations used the algorithms available in the PMOD Image Matching and Fusion Tool (PFUS) (PMOD Technologies, Ltd.).
The dynamic image data for the primary tumors and cervical nodes were fit to a 2-compartment model using the PMOD Kinetic Modeling Tool (PKIN) (PMOD Technologies, Ltd.), with initial values equivalent to the typical values reported by Muzi et al. (11). In this model, K1 represents the rate constant for transport of 18F-FLT from blood into tissue, k2 represents the rate constant of transfer from tissue back to blood, k3 reflects the rate constant of phosphorylation of 18F-FLT, and k4 describes the rate of dephosphorylation. The metabolite-corrected plasma curve was used as the arterial input function, and the sampled whole-blood curve was used for spillover correction in the implementation of the 2-compartment model. 18F-FLT flux (K-FLT) was calculated as (11):
| Eq. 1 |
The fraction of phosphorylated 18F-FLT was calculated as (12):
| Eq. 2 |
K-FLT was calculated using the full 2-compartment model as described above (i.e., 4 parameters = 4p) and also with k4 held equal to zero (i.e., 3 parameters = 3p).
The Patlak influx rate constant (K-Patlak) was determined for the primary tumors and 18F-FLT–avid neck nodes using the metabolite-corrected arterial plasma curve and the VOI data from 10 to 60 min (13). Standardized uptake values (SUVs), mean and maximum, were determined at each time point for each of the VOIs to evaluate the time course of 18F-FLT tissue uptake and were compared with K-Patlak values for each frame. The SUV determined during the time frame ending at 60 min (SUV60) was compared with the K-Patlak and K-FLT (3p and 4p).
RESULTS
Characterization of the Input Function
Full arterial and venous sampling for the baseline and midtherapy scans was obtained for 4 patients. Four patients had only venous blood sampling. There were only minor differences between 18F-FLT concentrations in whole-blood versus plasma samples and arterial versus venous samples. After 5 min, the mean error between arterial and venous whole-blood samples was −0.1406 kBq/mL (−3.8 nCi/mL) (−14%), with a mean absolute error of 0.3219 kBq/mL (8.7 nCi/mL) (19%). At 60 min, venous whole-blood concentrations overestimated the arterial whole-blood concentration by 0.1739 kBq/mL (4.7 nCi/mL) (17%), venous plasma overestimated arterial plasma concentrations by 0.1665 kBq/mL (4.5 nCi/mL) (15%), and venous whole blood overestimated arterial plasma concentrations by an average of only 0.0518 kBq/mL (1.4 nCi/mL) (4.5%). Whole-blood samples underestimated the plasma-based area under the curve by 1.7% over the course of 1 h. The error for given sampling intervals ranged from a 7.2% overestimation (early in the time course, i.e., <7.5 min) to a 1.7% underestimation of the area under the curve.
Interim review of the pretherapy and midtherapy 18F-FLT PET scans in 4 patients with full arterial and venous blood sampling revealed a consistent arterial concentration of 18F-FLT when normalized by the administered dose and late venous samples. This allowed the generation of a standard arterial input function curve (Fig. 1), which was used to generate a scaled standard input function for 4 patients who did not undergo arterial blood sampling. Complete information on the individual arterial plasma curves and tabulated values for the standard curve are available in the supplemental materials (Supplemental Figs. 1–3 and Supplemental Table 1; supplemental materials are available online only at http://jnm.snmjournals.org). The scaled arterial input function was determined by multiplying the injected dose by the dose-normalized arterial plasma concentration, scaling this curve by the ratio of the calculated concentration to the measured concentration at the specific sample time, and applying the individualized metabolite correction over time.
FIGURE 1.

Standard 18F-FLT plasma curves presented as value normalized by administered dose (Bq/mL/MBq). Solid line represents measured curve, and dashed line is metabolite-corrected curve. Individual patient data and table of plotted values are available in supplemental material.
Metabolism Correction
Metabolite correction specific to the individual was obtained for all studies except those for the first 2 patients. In these patients, the percentage of unchanged 18F-FLT was assumed to be 74% based on the previously published data by Shields et al. (10). In the remaining patients combining the pretherapy and midtherapy scans, the fraction of 18F-FLT unchanged with time resulted in an exponential function, y = 0.989e−0.005t (R2 = 0.88). This function corresponds to a fraction unchanged at 60 min of 73% (74% ± 5.6%).
18F-FLT Influx Measures
The primary tumors were clearly visible on all pretherapy and midtherapy studies. 18F-FLT uptake in a tonsillar cancer and cervical nodal metastases on pretherapy and midtherapy scans is demonstrated in Figure 2. One or more 18F-FLT–avid nodes was present in 7 of the 8 patients (n = 28). Measures (mean ± SD) of the influx of 18F-FLT (K-FLT, K-Patlak, and SUV60) for tumors and 18F-FLT–avid lymph nodes in patients with full arterial and venous sampling are presented in Table 1 (data for each patient are tabulated in the Supplemental Table 2). K-FLT, derived from both 4p and 3p parameter estimates, was significantly greater than K-Patlak (P < 0.001); however, each of the parameters was highly correlated (Table 2, Fig. 3, and Supplemental Figs. 4 and 5).
FIGURE 2.
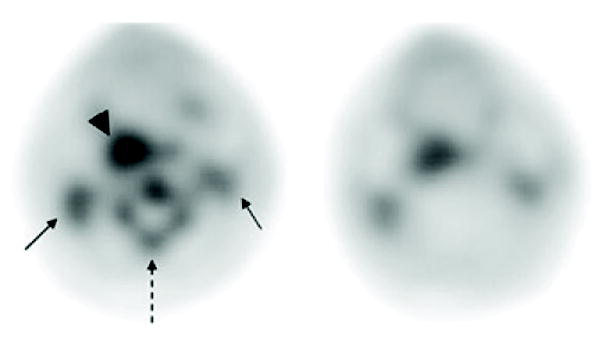
Pretherapy (left) and midtherapy (right) 18F-FLT PET images of patient with right tonsillar neoplasm (arrowhead), with bilateral cervical nodal metastases (solid arrows). Note interval decrease in 18F-FLT uptake in tumor and marked reduction in cervical bone marrow activity (dashed arrow).
TABLE 1.
Comparison of Kinetic Parameters and SUV by Tissue and Treatment Status
| Parameter |
|||||
|---|---|---|---|---|---|
| Tissue | K-FLT-4p (1/min) | K-FLT-3p (1/min) | K-Patlak (1/min) | SUV-60 | SUV-60 max |
| Primary tumor | |||||
| Before therapy | 0.075 ± 0.006 | 0.054 ± 0.006 | 0.042 ± 0.004 | 3.4 ± 0.5 | 4.8 ± 0.8 |
| Midtherapy | 0.040 ± 0.010 | 0.029 ± 0.015 | 0.018 ± 0.016 | 1.8 ± 1.1 | 2.6 ± 1.6 |
| 18F-FLT–avid neck nodes | |||||
| Before therapy | 0.047 ± 0.015 | 0.031 ± 0.008 | 0.026 ± 0.008 | 2.3 ± 0.7 | 3.2 ± 1.2 |
| Midtherapy | 0.024 ± 0.007 | 0.017 ± 0.011 | 0.010 ± 0.007 | 1.2 ± 0.5 | 1.7 ± 0.8 |
K-FLT-4p = influx parameter as defined in text derived from 4-parameter model fit; K-FLT-3p = influx parameter derived from fit holding k4 = 0; SUV-60 = mean SUV from 55 to 60 min after initiation of 18F-FLT infusion; max = maximum value for same region of interest.
Data are mean ± SD for patients with full arterial and venous sampling (n = 4 on 2 occasions).
TABLE 2.
Correlations Between Kinetic Parameters and SUVs
| Parameter | Primary tumor and neck node | Primary tumor only | Neck node only |
|---|---|---|---|
| K-Patlak vs. K-FLT-4p | 0.896 | 0.931 | 0.862 |
| K-Patlak vs. K-FLT-3p | 0.987 | 0.983 | 0.987 |
| K-Patlak vs. SUV-60 | 0.987 | 0.980 | 0.988 |
| K-Patlak vs. SUV-60 max | 0.966 | 0.972 | 0.958 |
| K-FLT-4p vs. K-FLT-3p | 0.916 | 0.953 | 0.873 |
| K-FLT-4p vs. SUV-60 | 0.910 | 0.904 | 0.895 |
| K-FLT-4p vs. SUV-60 max | 0.889 | 0.875 | 0.873 |
| K-FLT-3p vs. SUV-60 | 0.969 | 0.961 | 0.975 |
| K-FLT-3p vs. SUV-60 max | 0.944 | 0.951 | 0.939 |
| SUV-60 vs. SUV-60 max | 0.987 | 0.990 | 0.983 |
K-FLT-4p = influx parameter as defined in text derived from 4-parameter model fit; K-FLT-3p = influx parameter derived from fit holding k4 = 0; SUV-60 = mean SUV from 55 to 60 min after initiation of 18F-FLT infusion; max = maximum value for same region of interest.
FIGURE 3.

Comparison of SUV60 with K-FLT derived from 4-parameter fits in 4 patients with arterial blood sampling (A) and with K-Patlak in all patients (B), including pretherapy and midtherapy scans. B includes values determined in patients without arterial sampling through use of scaled standard input function.
Change in 18F-FLT Uptake with Therapy
Significant changes occurred in the uptake of 18F-FLT in the tumor with therapy. In patients with arterial sampling, the mean K-FLT in primary tumors and nodes (n = 18) changed from 0.054 ± 0.018 to 0.027 ± 0.010 min−1 and from 0.036 ± 0.012 to 0.017 ± 0.010 min−1, for 4- and 3-parameter estimates, respectively. The mean K-Patlak in the same group decreased from 0.029 ± 0.010 to 0.012 ± 0.009 min−1 and mean SUV60 from 2.53 ± 0.80 to 1.31 ± 0.67 between pretherapy and midtherapy scans. All changes were significant at the P < 0.001 level (based on 2-sided, paired t test). The changes were highly correlated between the parameters, especially between the K-Patlak and the SUV60 (R2 = 0.99) (Fig. 4 and Supplemental Fig. 6). The results for the patients with venous sampling only closely paralleled the above results, with K-Patlak in primary tumors and 18F-FLT–avid nodes (n = 10) decreasing from 0.022 ± 0.13 to 0.011 ± 0.008 min−1, the K-FLT (4p) decreasing from 0.045 ± 0.025 to 0.027 ± 0.018 min−1, and the SUV60 changing from 2.47 ± 0.97 to 1.66 ± 0.42. All changes were significant at the P < 0.01 level and highly correlated between the parameters (R2 = 0.99 for K-Patlak vs. SUV60). A single, small neck node with low uptake (SUV, 0.8 before therapy) and no K-FLT value (because of an inability to fit the compartmental model even with fixed-volume parameters) was removed from the analyses. No patient experienced an increase in 18F-FLT uptake, by any measure (i.e., K-Patlak, K-FLT, or SUV60 [mean or maximum]) either in the tumor or in an 18F-FLT–avid node between the pretherapy and the midtherapy scan times.
FIGURE 4.

Comparison of change in SUV60 between pretherapy and midtherapy scans with change in K-FLT in patients with arterial blood sampling (A) and comparison of SUV and K-Patlak in all patients (B). B includes values determined in patients without arterial sampling through use of scaled standard input function.
The time course of 18F-FLT uptake differed dramatically between the pretherapy and midtherapy scans. Figure 5 illustrates the time course of uptake expressed as a percentage of the concentration in the final imaging time frame. The uptake of 18F-FLT with time during pretherapy studies reflected a steady increase to an apparent plateau value, whereas the midtherapy studies exhibited rapid initial increases in concentration with a gradual washout to a plateau value. These kinetic changes were modulated by changes in the rate of phosphorylation (i.e., k3: before therapy, 0.13 ± 0.066, compared with midtherapy, 0.062 ± 0.029; P < 0.001) and ultimately, the fraction phosphorylated (before therapy, 0.36 ± 0.16 vs. 0.21 ± 0.09; P < 0.001), without statistically significant changes noted in the other parameters (i.e., K1, k2, or k4 or early distribution volume [i.e., K1/k2]).
FIGURE 5.

18F-FLT uptake in primary tumor at different time points expressed as percentage of the concentration at 60 min after administration at pretherapy (A) and midtherapy (B) scans. Heavy solid line represents mean value at each time point. At 45 min, uptake is within ±10% of 60-min concentration in all patients for both pretherapy and midtherapy scans.
Figure 6 illustrates the time course of the relationship between K-Patlak and the mean SUV for tumors and 18F-FLT–avid lymph nodes at each of the imaging interval midpoints for pre- and midtherapy studies. Consistent with the uptake time course and the significant correlations between the kinetic parameter values and SUV, the correlations between the 2 values increased rapidly with time to a plateau value in excess of 0.95 by 45 min after the initiation of the 18F-FLT infusion.
FIGURE 6.

Correlation between K-Patlak and SUV at particular time point vs. midpoint time (min) of imaging interval for pretherapy (solid curve) and midtherapy (dashed curve) scans.
DISCUSSION
The clinical study reported here examined the kinetics of 18F-FLT uptake in head and neck cancers before and after 5 d of chemoradiotherapy. Results of this study show that SUV (mean and maximum) obtained at 45–60 min after the initiation of 18F-FLT infusion shows excellent correlation with parameters obtained through rigorous quantitative modeling for 18F-FLT uptake in squamous cell head and neck tumors. Significant change in 18F-FLT uptake was observed in cancer tissue after 1 wk of chemoradiotherapy. These differences are most consistent with decreases in thymidine kinase activity in tumor tissue after therapy.
The influence of radiotherapy on thymidine is extensive and complex. In vitro studies using irradiated cancer cell lines suggest an initial increase in thymidine kinase activity in the first 8 h after radiation exposure (14). After a peak increase at 8 h, thymidine kinase activity decreased significantly. Cultured normal fibroblasts appear to have an even greater decrease in thymidine kinase abundance. Exposure of cultured fibroblasts to 1 Gy of ionizing radiation resulted in a 5.2-fold decrease in thymidine kinase messenger RNA 48 h after treatment (15). These in vitro observations with a single-dose exposure corroborate the in vivo changes detected by 18F-FLT imaging.
Significant changes in cell cycle parameters may be observed in squamous cell head and neck cancer after 10 Gy of radiation therapy. Using halogenated pyrimidines (iododeoxyuridine and bromodeoxyuridine) as DNA markers, Zackrisson et al. have shown that the change in the level of incorporation of halogenated pyrimidines into the DNA after 10 Gy of radiation correlated with the outcome of treatment (16). Another study by Valente et al. found a significant decrease in the Ki-67 score in oral cancer patients after 10 Gy of radiotherapy, with a significantly better outcome in patients with greater than 32% reduction of the Ki-67 score (17). We also found a significant decrease in 18F-FLT uptake in squamous cell head and neck cancers after 10 Gy of radiation therapy.
A major advantage of PET is the ability to measure the rate of metabolic processes. This is particularly important in the early assessment of response to therapy when the tumor is likely to be present and the early changes in metabolic processes may predict overall treatment response. The goal is to develop quantitative imaging tools that will provide a reliable measurement of metabolic processes and the changes with therapy and will also represent feasible procedures in a busy clinical operation. Compartmental analysis with nonlinear regression is the most comprehensive method for analysis of processes involved in the accumulation of a radiotracer in the tumor. Bading and Shields recommend using the 4-parameter model, at least in the initial studies, to elucidate the uptake process of 18F-FLT in a particular tumor and to evaluate the effect of treatment on cell proliferation (18).
Compartmental analysis of 18F-FLT provides important information on the rate of initial passive diffusion, efflux, phosphorylation, and dephosphorylation (K1, k2, k3, and k4, respectively) of 18F-FLT in the tumor. Our data show that initially during chemoradiation therapy the phosphorylation rate of 18F-FLT in tumors is significantly decreased, whereas the other parameters are not significantly changed from baseline. To perform compartmental analysis of tumor uptake of 18F-FLT, an arterial input function is required. This is ideally achieved through arterial sampling but may also be accurately estimated through an image-based input curve using the heart or a large artery visible on the dynamic sequence. Our attempts to generate image-based arterial time–activity curves were, for the most part, unsuccessful. The relatively slow input from the infusion (which was conducive to consistent arterial curves between patients), the slower dynamic frame rate used (which was conducive to improved count statistics in the images), and the disrupted anatomy and frequent tumor proximity to major vessels all factored in to the unsatisfactory results for characterizing the arterial input function, even when concentration-scaled with late blood samples. However, because of the consistency between the patients in their arterial blood concentrations when normalized by the dose administered and late venous samples, we were able to generate standard arterial input functions, which were used in patients without arterial sampling. We found no significant difference in whole-blood versus plasma concentration of 18F-FLT. This result is consistent with the report by Muzi et al. in patients with lung cancer (19). We also found that approximately 27% of 18F-FLT in the blood was converted to 18F-FLT-glucoronide at 60 min, which is similar to the 25% ± 5% result reported by Muzi et al. in lung cancer patients and Shields et al. in patients with colorectal cancer (10).
Imaging requirements for compartmental analysis are relatively complex for routine clinical use, requiring dynamic imaging, multiple arterial and venous blood samples, and expertise in pharmacokinetics analysis. A relatively simpler method for quantitation is to use the graphical Patlak analysis (13). This method is based on the assumption that the dephosphorylation of 18F-FLT is negligible and after the initial equilibration period the ratio of concentration in tumor versus plasma will show a linear increase when plotted against normalized time. In our study, there was an excellent correlation between the influx parameters obtained from K-Patlak and K-FLT both in the pretherapy and in the midtherapy settings. Consistent with the assumption of negligible dephosphorylation, there was greater agreement between the K-Patlak and the K-FLT derived from the 3-parameter fits (3p) than from the 4p fit. Good agreement between Patlak and full compartmental analysis for 18F-FLT uptake has also been reported in other tumors. Shields et al. found a correlation factor of 0.98 between K-Patlak and K-FLT in breast cancers before therapy (10). Good agreement was also reported by Visvikis et al. in colorectal cancers and their metastases (20). Patlak analysis, compared with full compartmental analysis, does not require fast dynamic imaging during the initial equilibration phase and may be relatively less sensitive to noise. However, this technique still requires an arterial input function and dynamic imaging for at least 60 min. Therefore, Patlak analysis is also not routinely used in clinical PET. The most commonly used quantification method in clinical PET imaging is SUV. SUV calculation does not require dynamic imaging or an arterial input function and can be easily obtained on all commercial PET systems, which routinely include SUV calculations in the image-processing systems. The excellent correlation between SUV and the more complex uptake parameters of 18F-FLT uptake (K-Patlak and K-FLT) in our study allows considerable simplification of the 18F-FLT imaging protocol for the assessment of response to therapy.
If SUV is to be used for quantitation of 18F-FLT uptake, timing of the scan is critical for comparison between baseline and posttherapy scans, because SUV provides a measure of uptake at a certain time point. The pretherapy studies in our population with head and neck cancer reached this threshold at a mean time of 14.9 min using ± 10% of the 60-min concentration as the timing standard. The midtherapy scans reached this same threshold at 35.7 min (P = 0.01). All studies in all patients met this criterion by 45 min after the initiation of dose infusion. In addition, the correlation between K-Patlak and SUV was greater than 0.95 in both pre- and midtherapy studies by this same 45-min threshold. Therefore, static imaging commencing between 45 and 60 min should result in consistent tissue concentrations for comparison of 18F-FLT uptake in head and neck cancers at baseline and after the initiation of therapy.
A potential limitation of our study is that cervical nodal staging was primarily based on clinical and radiologic (CT and 18F-FDG PET) assessment without histologic confirmation of all cervical nodes. Clinical and imaging-based staging of the neck is the standard of care in patients with head and neck cancer and is used for treatment decisions in this patient population. Furthermore 18F-FLT uptake, compared with 18F-FDG uptake, has been reported to have a higher specificity for tumors (21). 18F-FLT uptake, however, may be also seen in inflammatory neck nodes with reactive B-cell proliferation (7). In our patients, the histopathologically proven primary tumors and the 18F-FLT–avid lymph nodes exhibited similar kinetic behavior in response to treatment. Further investigations are warranted to evaluate the effect of 18F-FLT uptake in inflammatory processes on the accuracy of 18F-FLT PET in evaluating treatment response.
CONCLUSION
Squamous cell head and neck cancers show relatively intense 18F-FLT uptake and demonstrate a significant change in 18F-FLT uptake after 10 Gy of radiotherapy. SUV calculations provide information nearly equivalent to the data provided by the more complex K-FLT and K-Patlak parameters. 18F-FLT PET static imaging should begin no earlier than 45 min after injection, to ensure consistent uptake parameters during the monitoring of chemoradiation therapy in head and neck cancers.
Supplementary Material
Acknowledgments
The authors acknowledge the support and efforts of the technical staff of the University of Iowa PET Imaging Center (John Richmond, Dean Clermont, Christine Mundt, Julie Riggert, and Beth Schmitt); our research nurses, Jo Clark and Jane Hershberger; and our clinical research coordinator, Kellie Bodeker-Goranson, in the Department of Radiation Oncology. Part of this study was presented at the Academy of Molecular Imaging/The Society for Molecular Imaging Joint Molecular Imaging Conference 2007 in Providence, Rhode Island, and at the American Association of Pharmaceutical Scientists 2007 annual meeting in San Diego, California. This research was funded in part by a grant from the University of Iowa Carver College of Medicine and Holden Comprehensive Cancer Center and by NIH grant 1R21 CA130281-01.
References
- 1.Rasey JS, Grierson JR, Wiens LW, et al. Validation of FLT uptake as a measure of thymidine kinase-1 activity in A549 carcinoma cells. J Nucl Med. 2002;43:1210–1217. [PubMed] [Google Scholar]
- 2.Vesselle H, Grierson J, Muzi M, et al. In vivo validation of 3′deoxy-3′-[18F]fluorothymidine ([18F]FLT) as a proliferation imaging tracer in humans: correlation of [18F]FLT uptake by positron emission tomography with Ki-67 immunohistochemistry and flow cytometry in human lung tumors. Clin Cancer Res. 2002;8:3315–3323. [PubMed] [Google Scholar]
- 3.Buck AK, Bommer M, Stilgenbauer S, et al. Molecular imaging of proliferation in malignant lymphoma. Cancer Res. 2006;66:11055–11061. doi: 10.1158/0008-5472.CAN-06-1955. [DOI] [PubMed] [Google Scholar]
- 4.Chen W, Cloughesy T, Kamdar N, et al. Imaging proliferation in brain tumors with 18F-FLT PET: comparison with 18F-FDG. J Nucl Med. 2005;46:945–952. [PubMed] [Google Scholar]
- 5.Cobben DC, van der Laan BF, Maas B, et al. 18F-FLT PET for visualization of laryngeal cancer: comparison with 18F-FDG PET. J Nucl Med. 2004;45:226–231. [PubMed] [Google Scholar]
- 6.Linecker A, Kermer C, Sulzbacher I, et al. Uptake of 18F-FLT and 18F-FDG in primary head and neck cancer correlates with survival. Nuklearmedizin. 2008;47:80–85. doi: 10.3413/nukmed-0092. [DOI] [PubMed] [Google Scholar]
- 7.Troost EG, Vogel WV, Merkx MA, et al. 18F-FLT PET does not discriminate between reactive and metastatic lymph nodes in primary head and neck cancer patients. J Nucl Med. 2007;48:726–735. doi: 10.2967/jnumed.106.037473. [DOI] [PubMed] [Google Scholar]
- 8.Kenny LM, Vigushin DM, Al-Nahhas A, et al. Quantification of cellular proliferation in tumor and normal tissues of patients with breast cancer by [18F]fluorothymidine-positron emission tomography imaging: evaluation of analytical methods. Cancer Res. 2005;65:10104–10112. doi: 10.1158/0008-5472.CAN-04-4297. [DOI] [PubMed] [Google Scholar]
- 9.Machulla HJ, Blocher A, Kuntzsch M, et al. Simplified labeling approach for synthesizing 3′-deoxy-3′-[18F]fluorothymidine ([18F]FLT) J Radioanal Nucl Chem. 2000;24:843–846. [Google Scholar]
- 10.Shields AF, Briston DA, Chandupatla S, et al. A simplified analysis of [18F]3′-deoxy-3′-fluorothymidine metabolism and retention. Eur J Nucl Med Mol Imaging. 2005;32:1269–1275. doi: 10.1007/s00259-005-1813-0. [DOI] [PubMed] [Google Scholar]
- 11.Muzi M, Mankoff DA, Grierson JR, et al. Kinetic modeling of 3′-deoxy-3′-fluorothymidine in somatic tumors: mathematical studies. J Nucl Med. 2005;46:371–380. [PubMed] [Google Scholar]
- 12.Schiepers C, Chen W, Dahlbom M, et al. 18F-fluorothymidine kinetics of malignant brain tumors. Eur J Nucl Med Mol Imaging. 2007;34:1003–1011. doi: 10.1007/s00259-006-0354-5. [DOI] [PubMed] [Google Scholar]
- 13.Patlak CS, Blasberg RG, Fenstermacher JD. Graphical evaluation of blood-to-brain transfer constants from multiple-time uptake data. J Cereb Blood Flow Metab. 1983;3:1–7. doi: 10.1038/jcbfm.1983.1. [DOI] [PubMed] [Google Scholar]
- 14.Haveman J, Sigmond J, van Bree C, et al. Time course of enhanced activity of deoxycytidine kinase and thymidine kinase 1 and 2 in cultured human squamous lung carcinoma cells, SW-1573, induced by gamma-irradiation. Oncol Rep. 2006;16:901–905. doi: 10.3892/or.16.4.901. [DOI] [PubMed] [Google Scholar]
- 15.de Toledo SM, Azzam EI, Keng P, et al. Regulation by ionizing radiation of CDC2, cyclin A, cyclin B, thymidine kinase, topoisomerase IIα, and RAD51 expression in normal human diploid fibroblasts is dependent on p53/p21Waf1. Cell Growth Differ. 1998;9:887–896. [PubMed] [Google Scholar]
- 16.Zackrisson B, Flygare P, Gustafsson H, et al. Cell kinetic changes in human squamous cell carcinomas during radiotherapy studied using the in vivo administration of two halogenated pyrimidines. Eur J Cancer. 2002;38:1100–1106. doi: 10.1016/s0959-8049(02)00034-5. [DOI] [PubMed] [Google Scholar]
- 17.Valente G, Orecchia R, Gandolfo S, et al. Can Ki67 immunostaining predict response to radiotherapy in oral squamous cell carcinoma? J Clin Pathol. 1994;47:109–112. doi: 10.1136/jcp.47.2.109. [DOI] [PMC free article] [PubMed] [Google Scholar]
- 18.Bading JR, Shields AF. Imaging of cell proliferation: status and prospects. J Nucl Med. 2008;49(suppl 2):64S–80S. doi: 10.2967/jnumed.107.046391. [DOI] [PubMed] [Google Scholar]
- 19.Muzi M, Vesselle H, Grierson JR, et al. Kinetic analysis of 3′-deoxy-3′-fluorothymidine PET studies: validation studies in patients with lung cancer. J Nucl Med. 2005;46:274–282. [PubMed] [Google Scholar]
- 20.Visvikis D, Francis D, Mulligan R, et al. Comparison of methodologies for the in vivo assessment of 18FLT utilisation in colorectal cancer. Eur J Nucl Med Mol Imaging. 2004;31:169–178. doi: 10.1007/s00259-003-1339-2. [DOI] [PubMed] [Google Scholar]
- 21.van Waarde A, Cobben DC, Suurmeijer AJ, et al. Selectivity of 18F-FLT and 18F-FDG for differentiating tumor from inflammation in a rodent model. J Nucl Med. 2004;45:695–700. [PubMed] [Google Scholar]
Associated Data
This section collects any data citations, data availability statements, or supplementary materials included in this article.